Czech J. Anim. Sci., 60, 2015 (11): 487–497 Original Paper
doi: 10.17221/8557-CJAS
Supported by the State Key Laboratory of Animal Nutrition of China (2004DA125184F1209), National Natural Science Foundation of China (31372329), Innovation Scientists and Technicians Troop Construction Projects of Zhengzhou City (121PCXTD516), and Zhengzhou City Feed and Nutritional Key Lab (111PYFZX153).
R. Zhao and B.X. Yan contributed equally to this work.
Effect of different dietary oil sources on the growth
performance, blood characteristics, fatty acid profiles,
and expression of lipogenic genes in the liver
of broiler chickens
B.X. Yan
1, R. Zhao
2, J.P. Wang
3, W. Chen
1, Y.Q. Huang
1, Z.X. Wang
1,
J.S. Zhang
1, L.L. Liu
1, D.F. Qi
11College of Animal Science and Veterinary Medicine, Henan Agricultural University,
Zhengzhou, P.R. China
2Henan Province Xinxiang City Livestock Husbandry and Veterinary Management Bureau,
Xinxiang, P.R. China
3Institute of Animal Nutrition, Sichuan Agricultural University, Sichuan, P.R. China
ABSTRACT: The effect of different levels of corn oil (CO) and flaxseed oil (FO) on growth performance, blood characteristics, fatty acid composition, and expression of lipogenic genes in the liver of broiler chickens was stud-ied. Two hundred forty female Cobb-500 broiler chickens at the age of one day (body weight (BW) = 46 ± 4 g) were fed a corn soybean meal based diet containing 5% CO (LC), 3.75% CO + 1.25% FO (FO1), 2.5% CO + 2.5% FO (FO2) or 5% FO (FC). Chickens fed FO1 diet had better BW gain (P = 0.049) and gain/feed ratio (P = 0.006) than those fed LC and FC diets during days 1–21 of age. However, for the whole experimental period (1–42 days of age), the dietary lipid source had no effect on the growth performance. On day 42 of age, the hepatic percent-ages of 18:3n-3 (P = 0.001) and 20:5n-3 (P < 0.001) were higher in FC than in LC group, which led to a higher content of total n-3 PUFA and lower n-6/n-3 PUFA ratio. The contents of 18:2n-6 (P < 0.05) and Σ n-6 PUFA (P = 0.009) were lower in FC than in LC group. Chickens fed FO1 and FO2 diets had higher Ca2+-ATPase activity and
lower lipoprotein lipase activity than those fed LC and FC diets, whereas activities of lactate dehydrogenase and Na+,K+-ATPase were increased by FO2 than by LC diet (P < 0.05). The relative mRNA expression level of lipin 1
in chickens fed FO2 and FC was higher (P < 0.01) than in those fed LC and FO1 diets. Our results demonstrated that higher levels of FO led to hepatic enrichment of n-3 PUFA content and lower n-6/n-3 PUFA ratios in liver and increased the expression of lipin 1 whereas the expression of lipin 2, NADH dehydrogenase subunit 2, Δ-6 fatty acid desaturase, WD and tetratricopeptide repeats 1, and glyceraldehyde-3-phosphate dehydrogenase was not affected.
Keywords:flaxseed oil; enzyme activity; lipogenic genes expression; lipid metabolism
INTRODUCTION
Dietary polyunsaturated fatty acids (PUFA) influ-ence the fatty acid profile of membranes to alter
the activities of important enzymes associated with metabolism (Vajreswari and Narayanareddy 1992a, b). Activity of Na+,K+-ATPase (EC 3.6.3.9)
can be modulated via dietary manipulation of the n-6/n-3 PUFA ratio (Djemli-Shipkolye et al. 2003). A latest study showed that the activity of Na+,K+
-ATPase correlated negatively with the proportion of saturated fatty acids (SFA), but positively with that of PUFA in the membranes (Rodrigo et al. 2014).
Different fatty acid deposition and a lower ratio of n-6/n-3 PUFA in the tissue of bull, rabbit, pig, broiler muscles, and eggs of hens were also achieved by changing the source of dietary fat (Raes et al. 2004; Herdmann et al. 2010; Oliveira et al. 2010; Benatmane et al. 2011). In recent years, interest has been focused on the effect of the dietary fat source on the fatty acid deposition in pig, salmon, rabbit liver, etc.(Enser et al. 2000; Bell et al. 2001; Benatmane et al. 2011), but only few data on its effect on poultry liver have been found. As we know, liver is the major site of lipogenesis and de novo fatty acid biosynthesis (Lodhi et al. 2011), and liver lipid transfer to other tissues through blood and exerting effect on the lipid content and composition. So further research into the effect of dietary fat source on the fatty acid deposi-tion in poultry liver is needed to understand the mechanisms underlying the deposition of PUFA in poultry tissues (muscles, abdominal fat, and eggs). Lipin 1 (LPIN1), lipin 2 (LPIN2), WD and tetratri-copeptide repeats 1 (WDTC1), ∆6-desaturase (FADS2), and NADH dehydrogenase subunit 2 gene (ND2) are lipid metabolism genes with crucial functions in fat metabolism (Chen et al. 2014). Lipin-1 and lipin-2 proteins encoded by LPIN1 and LPIN2 genes can regulate glycerolipid homeostasis by acting as phosphatidic acid phosphohydrolase enzymes in the triglyceride synthesis pathway and regulating DNA-bound transcription factors to control gene transcription (Schweitzer et al. 2015). WDTC1 is an obesity gene which appears to inhibit fat formation in a dosage-sensitive man-ner in both animals and humans (Suh et al. 2007). FADS2 gene encodes ∆6-fatty acid desaturase which is a rate-limiting desaturase involved in metabolic processes of fatty acids (Zhu et al. 2014). ND2 variation is significantly associated with the pectoral muscle fat content of chickens (Lu et al. 2014). Previous reports showed that the PUFA levels were closely associated with alteration of expression of the body lipid metabolism related genes as hepatic LPIN1 transcript was found to be negatively regulated by the dietary PUFA pro-portion and its expression of mRNA levels was
correlated with the PUFA proportion in muscle (Martin et al. 2007; Yu and Shu 2013), FADS2 gene expression level in adipocyte was reported to be negatively correlated with 20:5n-3 and 20:4n-6 (Ralston et al. 2015). However, literature about the effects of PUFA on the expression of ND2 in broilers is lacking.
The aim of our study was to evaluate the ef-fect of different dietary oil sources on growth performance, blood characteristics, fatty acid composition, and expression of lipogenic genes in the liver of broiler chickens.
MATERIAL AND METHODS
Birds management and experimental design. Animals used in this experiment were reared and slaughtered according to the Institutional Guide-lines of the Care and Use of Laboratory Animals at Henan Agricultural University (Zhengzhou, China).
The 240 female Cobb-500 broiler chickens at 1 day of age (body weight (BW) = 46 ± 4 g) were randomly divided into four treatments with 6 rep-licates per treatment. The birds were raised in 24 cages under permanent light and had free access to feed and water. Standard temperature (33–35°C in the first week, then decreasing by 2–3°C per week), humidity, and ventilation were maintained throughout the whole experimental period.
The diets were formulated according to the re-quirements of broilers recommended by the NRC criteria (1994 version; Table 1), keeping consistent levels of energy, protein, calcium, phosphorus, amino acids, vitamins, and trace elements among the four treatments in corn-soybean meal based diet. The treatments were as follows: (1) LC: 5% corn oil (CO); (2) FO1: 3.75% CO + 1.25% flaxseed oil (FO); (3) FO2: 2.5% CO + 2.5% FO; and (4) FC: 5% FO. The fatty acid profiles of the finisher ex-perimental diets are shown in Table 2.
Czech J. Anim. Sci., 60, 2015 (11): 487–497 Original Paper
doi: 10.17221/8557-CJAS
lipoprotein cholesterol (HDL-C), triglyceride, and low-density lipoprotein cholesterol (LDL-C) levels were determined using an automatic analyzer kit (TBA-2000FR; Building Biological Engineering Co., Ltd., Nanjing, China). Double replicates of liver tissue samples were collected on day 42 from each individual broiler chicken. One sample was stored at −40°C for fatty acid and ATPase analysis and the other was snap-frozen in liquid nitrogen (−80°C) for lipid metabolism enzyme and RNA extraction.
Hepatic fatty acid profile analysis.Lipids were extracted from the liver tissue samples using chlo-roform/methanol (1 : 1 v/v) by a modified method of Folch et al. (1957). Fatty acid methyl esters were prepared for gas chromatography determination using KOH/methanol (Luo et al. 2009).
The 6890N-5973 Gas Chromatograph–Mass Spectrometer System (Agilent Technologies Inc., Santa Clara, USA) equipped with a quadrupole mass spectrometer detector, a hydrogen flame ionization detector, and quartz capillary chro-matographic column HP-5MS (30 m × 0.25 mm × 0.25 μm) was used in this experiment. The injector and quadrupole mass spectrometer detector were kept at 250°C and 150°C, respectively. Nitrogen was used as carrier gas with a flow rate of 1.0 ml/min, split ratio was 1 : 10. The column was programmed as follows: 60°C for 3 min, increase to 260°C (4°C/min), and held constant for 50 min. The fatty acids were identified by comparing the area of the peaks of the sample with that of known standards (Sigma-Aldrich, St. Louis, USA).
Liver lipid metabolism enzyme and ATP en-zyme assay. The levels of enzyme activities in liver including cholinesterase (CHE) (EC 3.1.1.8), lactate dehydrogenase (LDH) (EC 1.1.1.27), lipo-protein lipase (LPL) (EC 3.1.1.34), hepatic lipase (HL) (EC 3.1.1.3), Na+,K+-ATP, Mg2+-ATP, and
Ca2+-ATP (EC 3.6.3.8) were analyzed using the kit
of the Building Biological Engineering Co., Ltd. RNA isolation and cDNA synthesis.Total RNAs were extracted from the liver tissues of broiler chickens by using RNAiso Plus (TaKaRa Biotech-nology, Dalian, China). The quality of the isolated RNA was determined using GeneQuant pro UV spectrophotometer (Amersham Pharmacia Ltd., Bucks, UK). Total RNA (2 μg) was used to syn-thesize the cDNA using random hexamer prim-ers with PrimeScript RT reagent Kit with gDNA Eraser (TaKaRa Biotechnology) according to the
manufacturer’s instructions. The synthesized first strand cDNAs were stored at –20°C for further use.
[image:3.595.304.532.125.425.2]Real-time quantitative RT-PCR (qRT-PCR). The expression levels of lipin 1 (LPIN1) (Gen-Bank Accession No. HM473175.1), lipin 2(LPIN2) (GenBank Accession No. JN012098.2), WD and tetratricopeptide repeats 1 (WDTC1) (GenBank
Table 1. Composition and main characteristics of diets (g/kg, as-fed basis)
Ingredients Starter1 Finisher1
Corn 523.0 574.4.
Soybean meal (CP 480 g/kg) 354.1 303.0 Corn gluten meal (CP 600 g/kg) 5.0
Variable oil2 50.0 50.0
Fish meal3 30.0 30.0
Dicalcium phosphate 15.5 12.6
Limestone 12.6 12.0
NaCl 3.5 3.5
dl-Methionine (980 g/kg) 1.4 0.5 l-Lysine-HCl (780 g/kg) 0.3
Choline chloride (600 g/kg) 2.6 2.0
Vitamin premix4 2.0 2.0
Trace mineral premix5 5.0 5.0
Calculated composition (%)
ME6 (MJ/kg) 12.61 13.03
CP 215.0 200.0
Lysine 11.5 10.5
Ca 10.0 9.2
Available P 4.5 4.0
Met + Cys 9.0 7.2
ME = metabolizable energy, CP = crude protein
1starter diets provided in days 1–21; finisher diets provided in days 22–42
25% variable oil in the treatments was: 5% corn oil, 3.75% corn oil + 1.25% linseed oil, 2.5% corn oil + 2.5% linseed oil, and 5% linseed oil for LC, FO1, FO2, and FC groups, respectively 3product of Peru (CP 62.5%)
4provided per kg of diet: vitamin A 1500 IU, vitamin D 3 200 IU, vitamin E 10 mg, vitamin K3 0.5 mg, thiamin 1.8 mg, riboflvin 3.6 mg, vitamin B6 3.5 mg, vitamin B12 25 μg, niacin 35 mg, folic acid 0.55 mg, biotin 0.2 mg, pantothenic acid 10 mg
5provided per kg of diet: 40 mg of Zn (as ZnSO
4·7H2O), 60 mg of Mn (as MnSO4·5H2O), 80 mg of Fe (as FeSO4·7H2O), 10 mg of Cu (as CuSO4·5H2O), 0.35 mg of I (as KI), and 0.15 mg of Se (as Na2SeO3·5H2O)
Accession No. XM_417728.4), ∆6-fatty acid desaturase (FADS2) (GenBank Accession No. EF636888.3), NADH dehydrogenase subunit 2 (ND2) (GenBank Accession No. AP003580.1), and glyceraldehyde-3-phosphate dehydrogenase (GAPDH) (GenBank Accession No. NM_204305.1) were determined using Taqman qRT-PCR with 18S ribosomal RNA (18SrRNA) (GenBank Ac-cession No. FM164514.1) as an internal control. The primers/probes for qRT-PCR were optimized according to the reference (Puthpongsiriporn and Scheideler 2005). The standard curve for each gene was constructed with purified PCR products generated using the specific primers of objective gene and reference gene. Template cDNAs were quantified using a spectrophotometer and serially diluted tenfold to span the range of predicted CT
[image:4.595.65.530.114.445.2]values that would be obtained from experimental samples. The qRT-PCR was performed on the Applied Biosystems 7500 Real-Time PCR System (Applied Biosystems, Foster City, USA). PCR ampli-fications were carried out in a final volume of 25 µl reaction mixture containing 1 µl template cDNA, 12.5 μl TaqMan Universal PCR Master Mix (con-taining AmpliTaq Gold DNA Polymerase, Amp- Erase, UNG, dNTPs with dUTP, and optimized buffer components; all Applied Biosystems), 0.5 µl (10 µmol/l) of each primer, 2.5 µl Taqman probe, 0.5 µl Rox. The experiment had three biological replications with no template control as well as no RT sample. The qRT-PCR was carried out with two-step protocol as follows: denaturation at 95°C for 2 min, followed by 40 cycles of denaturation at 95°C for 15 s, and annealing/extension at 60°C for
Table 2. Fatty acid composition (% of total FA) in finisher diets (measured value)
Item LC (n = 6) FO1 (n = 6) FO2 (n = 6) FC (n = 6)
14:0 0.42 0.39 0.43 0.42
16:0 18.02 18.95 17.34 16.05
16:1n-7 0.35 0.33 0.38 0.35
17:0 2.67 2.57 2.70 3.22
18:0 2.60 2.64 2.58 2.75
18:1n-3 37.07 36.27 35.98 35.97
18:2n-6 18.76 18.59 16.06 14.70
18:3n-3 0.30 1.22 3.57 5.46
20:1n-9 2.24 2.15 2.30 2.14
20:2n-6 1.43 1.56 1.64 1.72
20:3n-3 2.46 2.15 2.48 2.40
20:4n-6 3.70 3.56 4.97 4.37
20:5n-3 1.57 1.49 1.41 1.55
22:5n-3 2.17 2.03 2.09 2.12
22:6n-3 6.24 6.11 6.08 6.28
∑ SFA1 23.71 24.55 23.05 22.94
∑ MUFA2 39.66 38.75 38.66 38.46
∑ n-6 PUFA3 26.35 25.86 25.15 23.19
∑ n-3 PUFA4 10.28 10.85 13.15 15.41
∑PUFA 36.63 36.71 38.30 38.60
18:2n-6/18:3n-3 62.53 15.24 4.49 2.69
n-6 PUFA/n-3 PUFA 2.56 2.38 1.91 1.50
LC = 5% corn oil group, FO1 = 3.75% corn oil +1.25% flaxseed oil group, FO2 = 2.5% corn oil + 2.5% flaxseed oil group, FC = 5% flaxseed oil group, SFA = saturated fatty acids, MUFA = monounsaturated fatty acids, PUFA = polyunsaturated fatty acids 1∑ 14:0, 16:0, 17:0, and 18:0
Czech J. Anim. Sci., 60, 2015 (11): 487–497 Original Paper
doi: 10.17221/8557-CJAS
1 min. For each sample, the relative mRNA level equalled to objective gene copy number/reference gene copy number. The mRNA level of each gene was normalized to 1 for the group with the lowest average value in all samples. Primer sequences are listed in Table 3.
Statistical analysis.All data were analyzed with the GLM procedure of SAS (Statistical Analysis System, 1992), with each group and pen as the ex-perimental unit, respectively. Before carrying out the statistical analysis of gene counts, conversion of the data was performed using the equation:
relative mRNA level = objective gene copy number/reference gene copy number The significance of difference was tested by Duncan’s Multiple Range test. P-value < 0.05 was considered statistically significant.
RESULTS
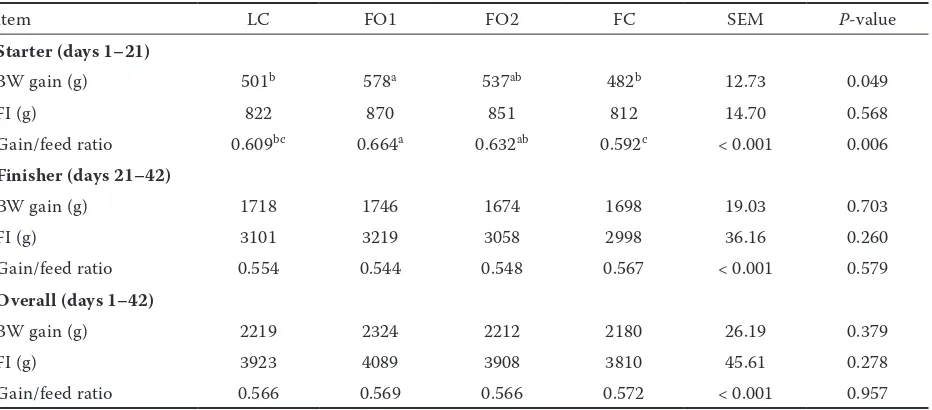
Growth performance.There was no difference in growth performance between the dietary treat-ments in days 21–42 and 1–42 of age (P < 0.05,
Table 4). Chickens fed FO1 diet showed greater BW gain (P = 0.049) and feed efficiency (P = 0.006) than those on LC and FC treatments in days 1–21 (P < 0.05).
Blood characteristics.All blood parameters (to-tal cholesterol, triglycerides, LDL-C, and HDL-C) did not differ between the four treatments on day 42 (P > 0.05, Table 5).
[image:5.595.63.548.113.427.2]Fatty acid composition in liver.As is shown in Table 6, the contents of SFA (P < 0.05), espe-cially of 18:0 (P < 0.001), were increased by FC treatment whereas the proportion of MUFA did not change (P > 0.05) except 18:1n-3 (P < 0.05), which was decreased by 39.9 and 66.1% with FO2 and FC treatments, respectively, compared with LC diet. The concentrations of 18:3n-3 (P = 0.001) and 20:5n-3 (P < 0.001) were increased by FC treatment, which led to a higher total n-3 PUFA proportion and lower n-6/n-3 ratio in FC treat-ment than in the other treattreat-ments. However, the contents of 22:5n-3 and 22:6n-3 did not differ by the treatments (P > 0.05). In contrary to n-3 PUFA, the content of 18:2n-6 and ∑ n-6 PUFA were lower in FC group than in LC group.
Table 3. Primers used for RT-PCR analysis
Gene + GenBank Acc. No. Sequences of primer and probe Product length (bp)
18S rRNA (FM165414.1)
F: 5’GATCCATTGGAGGGCAAGTC3’
113 R: 5’CAGCTCGATCCCAAGATCC3’
probe: 5’CAGCAGCCGCGGTAATTCCAGC3’
LPIN1 (HM473175.1)
F: 5’GAGATGGATAACAATCAGGAG3’
140 R: 5’GAAGATACACTGCTGTCCAG3’
probe: 5’CTGTCTACGTCCCCCATCCTGTC3’
LPIN2 (JN012098.2)
F: 5’CCGGAATCAACCAAGATAAGC3’
105 R: 5’ATCAGAGCTGAGGATGACTC3’
probe: 5’CTGGAACATCCCAGAACAGCTACC3’
WDTC1 (XM_417728.4)
F: 5’GGAGACTTGTTGGCCTCTG3’
131 R: 5’GTCAAGTTCTTGCCGCATTC3’
probe: 5’CCATTGTCTGGGATCCTCTGCACC3’
ND2
(AP003580.1)
F: 5’TCTGCACAGTAAGCCTCATC3’
149 R: 5’GATAGTGGCTTCAATCGCTC3’
probe: 5’CCAGCATCACAATCTCCAGCAACC3’
FADS2 (EF636888.3)
F: 5’ATTGGACACCTTAAGGGTGC3’
104 R: 5’AGCATGTTCACATCTGGGTC3’
probe: 5’CCATCGTCACTTCCAACATCACGC3’
GAPDH (NM_204305.1)
F: 5’TTGTCAGCAATGCATCGTGC3’
98 R: 5’TGATGGCATGGACAGTGGTC3’
Enzyme activities in liver.Activities of CHE, HL, and Mg2+-ATP were not affected by dietary
treat-ments (P > 0.05), whereas FO1 and FO2 treatments led to greater activities of Ca2+-ATP but lower
activities of LPL than LC and FC treatments (P < 0.05) (Table 7). Na+,K+-ATP gained the greatest
activity in FO2 treatment (P < 0.05). LDH activity was increased by treatments FO1 and FO2 due to their diet composition, compared to the reduced LDH activity by the LC group (P < 0.05).
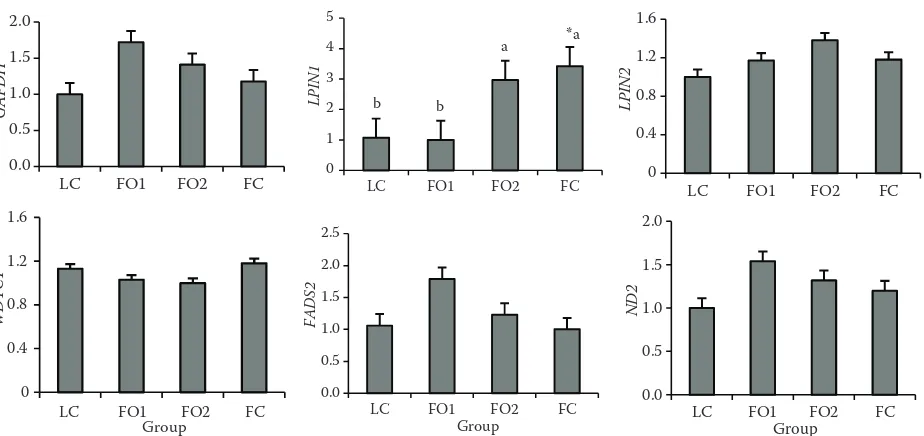
Expression of lipid metabolism related gene in liver.The relative mRNA expression level of LPIN1 was higher (P < 0.01) by FO2 and FC treat-ments than by LC and FO1 treattreat-ments, whereas that of FADS2, WDTC1, GAPDH, ND2, and LPIN2 did not differ between the four treatments (P > 0.05; Figure 1).
DISCUSSION
[image:6.595.66.532.112.317.2]In the current study, growth performance of broiler chickens in days 21–42 and 1–42 of treat-ment was in line with previous reports that the substitution of some (Olomu and Baracos 1991) or all (Benatmane et al. 2011) dietary oil with FO did not significantly affect weight gain, feed consumption, and feed efficiency. The study of Rahimi et al. (2011) showed that BW gain during days 1–21 did not differ by feeding 7.5% FO, but it decreased with adding the amount of 10%, which is completely opposite to our result of the elevated BW gain at 21 days by FO1 treatment (replacing 1.25% CO by FO). The reason may be attributed to the different replacement ratio of CO with FO in our study. The better BW gain at 21 days and
Table 4. Effects of different oil sources on growth performance in broilers
Item LC FO1 FO2 FC SEM P-value
Starter (days 1–21)
BW gain (g) 501b 578a 537ab 482b 12.73 0.049
FI (g) 822 870 851 812 14.70 0.568
Gain/feed ratio 0.609bc 0.664a 0.632ab 0.592c < 0.001 0.006
Finisher (days 21–42)
BW gain (g) 1718 1746 1674 1698 19.03 0.703
FI (g) 3101 3219 3058 2998 36.16 0.260
Gain/feed ratio 0.554 0.544 0.548 0.567 < 0.001 0.579
Overall (days 1–42)
BW gain (g) 2219 2324 2212 2180 26.19 0.379
FI (g) 3923 4089 3908 3810 45.61 0.278
Gain/feed ratio 0.566 0.569 0.566 0.572 < 0.001 0.957
LC = 5% corn oil group, FO1 = 3.75% corn oil +1.25% flaxseed oil group, FO2 = 2.5% corn oil + 2.5% flaxseed oil group, FC = 5% flaxseed oil group, BW gain = body weight gain per chick, FI = feed intake per chick
a–cmeans in the same row with different superscripts differ (P < 0.05)
Table 5. Effects of dietary oil sources on blood characteristics of broilers slaughtered at 42 days of age1
Item LC FO1 FO2 FC SEM P-value
Total cholesterol (mmol/l) 2.99 2.64 2.94 2.59 0.093 0.326
Triglyceride (mmol/l) 0.21 0.18 0.24 0.19 0.012 0.464
LDL-C (mmol/l) 2.10 1.67 1.97 1.8 0.071 0.140
HDL-C (mmol/l) 0.85 0.95 0.92 0.77 0.034 0.237
[image:6.595.62.532.638.711.2]Czech J. Anim. Sci., 60, 2015 (11): 487–497 Original Paper
doi: 10.17221/8557-CJAS
gain/feed ratio in chickens fed FO1 indicate that the partial replacement of CO with FO was more beneficial to broiler growth in days 1–21 than if solely FO and CO diets were administered.
Concentrations of HDL-C, total cholesterol, and tri-glycerides were not affected by different lipid sources in the current study diets, which is consistent with previous results of Stuglin and Prasad (2005). The HL activity proceeds to hydrolyze the triglyceride in the triglyceride-rich HDL (Brunzell et al. 2012), the con-stant variation tendency of HL and HDL-C observed in our work may support this conclusion to some de-gree. Our results concerning LDL-C agreed with the study of Celebi and Utlu (2006) in layers whose LDL-C levels were lower with diets rich in PUFA (4% FO and sunflower oil) but higher with a diet rich in SFA (tallow oil diet). In our study, 1.25% FO provided the greatest amount of HDL-C (which is protective against atherosclerosis), and the lowest amount of LDL-C (which is atherogenic (Brunzell et al. 2012)), and proved to be the most suitable for preventing cholesterol metabolism related diseases, as reported previously.
It has been proved that a key factor in postpran-dial lipid metabolism is the activity of LPL, which
plays a role in the clearance of chylomicrons derived from dietary fat (Patsch et al. 1987). Inconsistently with the previous research that FO (10%) diet led to an increase in the activity of LPL in the liver of chickens (Ferrini et al. 2010), a suppression effect was observed in our study, which may be due to the different adding amounts of FO in our work, as we observed that 5% FO led to greater activity of LPL than the adding amounts of 1.25% (FO1) and 2.5% (FO2). Our result, that diets containing FO gained greater LDH activities, agreed with the result of Yilmaz et al. (2004). Elevated LDH activity may be necessary to catalyze the lactate to pyruvate reaction (Maillet and Weber 2007) and pyruvate is the precursor of the fatty acid synthesis, so we speculate that elevated activity of LDH may promote metabolism of fat synthesis in liver. We found no significant difference for HL by adding FO. Similarly, a study of Kasim et al. (1988) showed that no change was observed in the HL activity during the n-3 fish oil supplementation.
Lipoperoxidation is a self-propagating biological reaction and severely alters structure and func-tion of mammalian cells (Esterbauer 1993). The membrane microenvironment and enzyme
activi-Figure 1. Effects of dietary oil sources on the relative expression level of lipogenic genes in broilers slaughtered at 42 days of age
For each gene, the relative mRNA level = copy number of objective gene/18S rRNA copy number
LC = 5% corn oil group, FO1 = 3.75% corn oil +1.25% flaxseed oil group, FO2 = 2.5% corn oil + 2.5% flaxseed oil group, FC = 5% flaxseed oil group
a,bmeans in the same column with different superscripts differ (P < 0.05)
*comparison among the four treatment groups, P < 0.05 (6 observations per treatment)
b b
a *a
0 1 2 3 4 5
LC FO1 FO2 FC
LPIN1
Group
0 0.4 0.8 1.2 1.6
LC FO1 FO2 FC
LPIN2
Group
0 0.4 0.8 1.2 1.6
LC FO1 FO2 FC
W
D
TC
1
Group
0.0 0.5 1.0 1.5 2.0 2.5
LC FO1 FO2 FC
FA
DS
2
Group
0.0 0.5 1.0 1.5 2.0
LC FO1 FO2 FC
ND
2
Group 0.0
0.5 1.0 1.5 2.0
LC FO1 FO2 FC
G
AP
D
H
[image:7.595.70.532.95.313.2]ties could be changed by oxidation. A significant negative correlation exists between the activity of ATP enzyme and the increase of oxidation. PUFA can impose the body’s peroxidation burden for containing reactive oxygen species (ROS) (Niki et al. 2005), the most susceptible ones being n-3 PUFA (Kamal-Eldin and Yanishlieva 2002). The present study showed that compared to LC group, enzymes (LDH, Na+,K+-ATP, Mg2+-ATP, and Ca2+-ATP)
ac-tivities improved with the FO adding amount of 1.25% and 2.5%, while its further increase (3.75%) could not maintain this effect. It implies that n-3 PUFA appears to be tightly regulated by feedback
inhibition and can reduce the risk of peroxidation with the right dosage. It is consistent with the results obtained by Zhou and Li (2009), and more recently by Yang et al. (2010), that PUFA can impose the body’s peroxidation burden. Mechanisms underlying these effects necessitate further research.
[image:8.595.60.533.127.451.2]The liver is the critical organ in the regulation of essential fatty acids and is sensitive to dietary n-3 PUFA. The present study demonstrated that the composition of fatty acids in muscles, eggs, and liver can be manipulated by dietary means (Raes et al. 2004; Herdmann et al. 2010; Oliveira et al. 2010; Benatmane et al. 2011). In our study, a significant
Table 6. Effects of dietary oil sources on fatty acid composition (% of total FA) of livers from broilers slaughtered at 42 days of age1
Item LC (n = 6) FO1 (n = 6) FO2 (n = 6) FC (n = 6) SEM P-value
14:0 0.37 0.30 0.32 0.15 0.035 0.106
15:0 0.08 0.08 0.07 0.06 0.010 0.744
16:0 19.49 19.04 18.70 18.37 1.283 0.993
16:1n-7 2.62 2.26 3.07 1.25 0.276 0.101
17:0 3.09 2.81 3.89 1.33 0.373 0.095
18:0 8.25b 7.84b 7.96b 27.63a 1.942 < 0.001
18:1n-3 37.57a 34.71ab 22.59bc 12.75c 3.197 0.008
18:2n-6 29.39a 20.51b 24.01ab 15.33b 1.734 0.023
18:3n-3 0.44b 3.47a 3.29a 3.43a 0.412 0.001
20:1n-9 1.68 1.85 2.48 1.34 0.194 0.193
20:2n-6 2.39 1.89 2.28 0.96 0.236 0.125
20:3n-3 2.42 2.13 2.73 1.96 0.233 0.694
20:4n-6 9.48 7.49 8.49 6.95 0.728 0.651
20:5n-3 2.00b 2.14b 3.19b 7.91a 0.552 < 0.001
22:5n-3 1.63 1.41 1.94 0.76 0.187 0.142
22:6n-3 8.27 8.25 11.31 13.02 0.967 0.220
∑ SFA2 26.58b 30.04b 27.76b 47.53a 2.735 0.011
∑ MUFA3 22.37 27.25 20.10 8.96 3.149 0.213
∑ n-3 PUFA4 12.26b 14.12b 18.64ab 23.40a 1.504 0.029
∑ n-6 PUFA5 38.79a 28.60ab 33.50a 20.10b 2.180 0.009
∑ PUFA6 51.05 42.72 52.14 43.50 2.089 0.250
n-6 PUFA/n-3 PUFA 3.39a 2.28a 2.22a 0.86b 0.261 0.002
C18:2/C18:3 73.13a 7.33b 7.47b 4.32b 8.665 < 0.001
LC = 5% corn oil group, FO1 = 3.75% corn oil +1.25% flaxseed oil group, FO2 = 2.5% corn oil + 2.5% flaxseed oil group, FC = 5% flaxseed oil group, SFA = saturated fatty acids, MUFA = monounsaturated fatty acids, PUFA = polyunsaturated fatty acids 1each mean represents 6 observations per treatment
2∑14:0, 15:0, 16:0, 17:0, and 18:0 3∑16:1, 18:1, and 20:1
4∑ 18:3, 20:5, 22:5, and 22:6 5∑18:2, 20:2, 20:3, and 20:4; 6∑n-3 PUFA and n-6 PUFA
Czech J. Anim. Sci., 60, 2015 (11): 487–497 Original Paper
doi: 10.17221/8557-CJAS
increase in most of the individual liver n-3 PUFA and a decrease in n-6 PUFA were observed in the case of the diet supplemented with FO as the source of 18:3n-3, when compared with CO diet. The above resulted in the reduction of n-6/n-3 PUFA ratio and 18:2/18:3 ratio, the former being in agreement with previous data (Enser et al. 2000; Bell et al. 2001) whereas the latter being inconsistent with the report of Benatmane et al. (2011) as the lower 18:2/18:3 ratio was not observed in liver by linseed diet for the elevated 18:2 content.
Because the same series of enzymes is shared for the conversion of n-3 and n-6 fatty acids, a competition exists between the n-3 and n-6 fatty acid families for metabolism with an excess of one causing a significant decrease in the conver-sion of the other (Schmitz and Ecker 2008), our results that chickens fed FC diet achieved a higher content of total n-3 PUFA but lower ratio of total n-6 PUFA was just consistent with the conclusion. In our study, the significant differences in the liver fatty acid composition were observed in the octadecanoic acid series as an elevated content of 18:0 and 18:3n-3 but a lower proportion of 18:1n-3 and 18:2n-6 were observed. The 18:3n-3 present in flaxseed oil is the substrate of elon-gases and desaturases, thus the content of 20:5n-3 and 22:6n-3 in the liver of broiler chickens in our study increased with the increasing percentage of dietary FO, and the 20:5n-3 in liver gained the highest proportion in chickens fed FC diet (5% FO), which was 2.48, 3.70, and 3.96 times of that in LC, FO1, and FO2 group, respectively.
Dietary fat administration has recently gained much attention for its role in regulating gene ex-pression. Marine n-3 PUFA have been found to be involved in the suppression of lipogenic genes in liver (Kaur and Sinclair 2010). In our study, feeding the diet enriched with n-3 PUFA significantly up-regulated the relative mRNA expression of LPIN1, which was consistent with the report of Thering et al. (2009). The significant changes for LPIN1 implied that its expression levels were under the post-transcription regulation. A previous study showed that mRNA expression of ND2 could be modulated by DJ-1 and oxygen concentration (Blackinton et al. 2009). In our study, we observed for the first time that the mRNA expression of ND2 could be regulated by a different dietary oil source, as 1.25% FO to some degree up-regulated the mRNA level of ND2 compared to a single CO diet, although not reaching a significant level. One explanation may be that FO promoted the metabolism of fat synthesis by the elevated LDH activity as was described, acetyl CoA as a precursor of fat synthesis and also the reactant of citric acid synthesis increased and then indirectly promoted tricarboxylic acid (TCA) cycle by increasing the content of citric acid, which further increased the TCA products of NADH, so did the ND2 as an important subunit of NADH (Gingrich et al. 2004).
In conclusion, adding FO was more favourable in the early stage of broilers’growth (days 1–21), as the BW gain and gain/feed ratio were improved significantly in this period, and the best adding amount was 1.25%. A more benefiting PUFA
com-Table 7. Effects of dietary oil sources on enzyme activities in the liver of broilers slaughtered at 42 days of age1
Item LC FO1 FO2 FC SEM P-value
CHE (U/g protein) 30.02 26.58 29.88 28.37 1.707 0.897
LDH (U/g protein) 10 698b 14 155a 13 828a 12 071ab 489.210 0.030
LPL (U/ml) 4.14a 1.39c 2.73b 4.03a 0.348 0.002
HL (U/ml) 1.83 2.23 2.22 2.28 0.120 0.514
Na+, K+-ATP (µmol P
i/mg protein/h) 1.26b 1.46ab 1.60a 1.21b 0.053 0.025 Mg2+-ATP (µmol P
i/mg protein/h) 1.49 1.58 1.68 1.37 0.053 0.190
Ca2+-ATP (µmol P
i/mg protein/h) 1.25b 1.58a 1.54a 1.19b 0.057 0.016
LC = 5% corn oil group, FO1 = 3.75% corn oil +1.25% flaxseed oil group, FO2 = 2.5% corn oil + 2.5% flaxseed oil group, FC = 5% flaxseed oil group, CHE = cholinesterase, LDH = lactate dehydrogenase, LPL = lipoprotein lipase, HL = hepatic lipase 1each mean represents 6 observations per treatment
[image:9.595.66.532.111.237.2]position and balancing n-6/n-3 PUFA ratio in liver were achieved with a higher levels of dietary FO. The expression level of LPIN1, but not of ND2, and the activities of LDH, LPL, Na+, K+-ATP, and
Ca2+-ATP enzymes in liver were also affected.
REFERENCES
Bell J.G., McEvoy J., Tocher D.R., McGhee F., Campbell P.J., Sargent J.R. (2001): Replacement of fish oil with rapeseed oil in diets of Atlantic salmon (Salmo salar) affects tissue lipid compositions and hepatocyte fatty acid metabolism. The Journal of Nutrition, 131, 1535–1543.
Benatmane F., Kouba M., Youyou A., Mourot J. (2011): Effect of a linseed diet on lipogenesis, fatty acid composition and stearoyl-CoA-desaturase in rabbits. Animal, 5, 1993–2000. Blackinton J., Kumaran R., van der Brug M.P., Ahmad R.,
Olson L., Galter D., Lees A., Bandopadhyay R., Cookson M.R. (2009): Post-transcriptional regulation of mRNA associated with DJ-1 in sporadic Parkinson disease. Neu-roscience Letters, 452, 8–11.
Brunzell J.D., Zambon A., Deeb S.S. (2012): The effect of hepatic lipase on coronary artery disease in humans is influenced by the underlying lipoprotein phenotype. Biochimica et Biophysica Acta (BBA) – Molecular and Cell Biology of Lipids, 1821, 365–372.
Celebi S., Utlu N. (2006): Influence of animal and vegetable oil in layer diets on performance and serum lipid profile. International Journal of Poultry Sciences, 5, 370–373. Chen W., Zhao R., Yan B., Zhang J., Huang Y., Wang Z.,
Guo Y. (2014): Effects of the replacement of corn oil with linseed oil on fatty acid composition and the expression of lipogenic genes in broiler chickens. Czech Journal of Animal Science, 59, 353–364.
Djemli-Shipkolye A., Raccah D., Pieroni G., Vague P., Coste T., Gerbi A. (2003): Differential effect of w3 PUFA supple-mentations on Na, K-ATPase and Mg-ATPase activities: possible role of the membrane w6/w3 ratio. The Journal of Membrane Biology, 191, 37–47.
Enser M., Richardson R., Wood J., Gill B., Sheard P. (2000): Feeding linseed to increase the n-3 PUFA of pork: fatty acid composition of muscle, adipose tissue, liver and sausages. Meat Science, 55, 201–212.
Esterbauer H. (1993): Cytotoxicity and genotoxicity of lipid-oxidation products. The American Journal of Clinical Nutrition, 57, 779S–785S.
Ferrini G., Manzanilla E., Menoyo D., Esteve-Garcia E., Baucells M., Barroeta A. (2010): Effects of dietary n-3 fatty acids in fat metabolism and thyroid hormone levels when compared to dietary saturated fatty acids in chick-ens. Livestock Science, 131, 287–291.
Folch J., Lees M., Sloane-Stanley G. (1957): A simple method for the isolation and purification of total lipids from animal tissues. Journal of Biological Chemistry, 226, 497–509.
Gingrich J.R., Pelkey K.A., Fam S.R., Huang Y., Petralia R.S., Wenthold R.J., Salter M.W. (2004): Unique domain anchoring of Src to synaptic NMDA receptors via the mitochondrial protein NADH dehydrogenase subunit 2. Proceedings of the National Academy of Sciences of the United States of America, 101, 6237–6242.
Herdmann A., Nuernberg K., Martin J., Nuernberg G., Doran O. (2010): Effect of dietary fatty acids on expres-sion of lipogenic enzymes and fatty acid profile in tissues of bulls. Animal, 4, 755–762.
Kamal-Eldin A., Yanishlieva N.V. (2002): N-3 fatty acids for human nutrition: stability considerations. European Journal of Lipid Science and Technology, 104, 825–836. Kasim S.E., Stern B., Khilnani S., McLin P., Baciorowski S.,
Jen K.L.C. (1988): Effects of omega-3 fish oils on lipid me-tabolism, glycemic control, and blood pressure in type II diabetic patients. The Journal of Clinical Endocrinology and Metabolism, 67, 1–5.
Kaur G., Sinclair A. (2010): Regulation of gene expression in brain and liver by marine n-3 polyunsaturated fatty acids. Progress in Nutrition, 12, 24–28.
Lodhi I.J., Wei X., Semenkovich C.F. (2011): Lipoexpedi-ency: de novo lipogenesis as a metabolic signal transmit-ter. Trends in Endocrinology and Metabolism, 22, 1–8. Lu W.W., Hou L.L., Zhang W.W., Zhang P.F., Chen W., Kang
X., Huang Y. (2014): Study on heteroplasmic variation and the effect of chicken mitochondrial ND2. Mitochondrial DNA, 1–7. doi: 10.3109/19401736.2014.971022. Luo H.F., Wei H.K., Huang F.R., Zhou Z., Jiang S.W., Peng J.
(2009): The effect of linseed on intramuscular fat content and adipogenesis related genes in skeletal muscle of pigs. Lipids, 44, 999–1010.
Maillet D., Weber J.M. (2007): Relationship between n-3 PUFA content and energy metabolism in the flight mus-cles of a migrating shorebird: evidence for natural doping. Journal of Experimental Biology, 210, 413–420.
Martin P.G., Guillou H., Lasserre F., Dejean S., Lan A., Pas-cussi J.M., SanCristobal M., Legrand P., Besse P., Pineau T. (2007): Novel aspects of PPARα-mediated regulation of lipid and xenobiotic metabolism revealed through a nutrigenomic study. Hepatology, 45, 767–777.
Niki E., Yoshida Y., Saito Y., Noguchi N. (2005): Lipid per-oxidation: mechanisms, inhibition, and biological effects. Biochemical and Biophysical Research Communications, 338, 668–676.
Czech J. Anim. Sci., 60, 2015 (11): 487–497 Original Paper
doi: 10.17221/8557-CJAS
diet of laying hens on the fatty acid profiles of egg yolks. Poultry Science, 89, 2484–2490.
Olomu J., Baracos V. (1991): Influence of dietary flaxseed oil on the performance, muscle protein deposition, and fatty acid composition of broiler chicks. Poultry Science, 70, 1403–1411.
Patsch J.R., Prasad S., Gotto Jr. A.M., Patsch W. (1987): High density lipoprotein2. Relationship of the plasma levels of this lipoprotein species to its composition, to the magnitude of postprandial lipemia, and to the activities of lipoprotein lipase and hepatic lipase. Journal of Clinical Investigation, 80, 341–347.
Puthpongsiriporn U., Scheideler S. (2005): Effects of dietary ratio of linoleic to linolenic acid on performance, anti-body production, and in vitro lymphocyte proliferation in two strains of leghorn pullet chicks. Poultry Science, 84, 846–857.
Raes K., De Smet S., Demeyer D. (2004): Effect of dietary fatty acids on incorporation of long chain polyunsaturated fatty acids and conjugated linoleic acid in lamb, beef and pork meat: a review. Animal Feed Science and Technol-ogy, 113, 199–221.
Rahimi S., Kamran Azad S., Torshizi K. (2011): Omega-3 enrichment of broiler meat by using two oil seeds. Journal of Agricultural Science and Technology, 13, 353–365. Ralston J.C., Matravadia S., Gaudio N., Holloway G.P.,
Mutch D.M. (2015): Polyunsaturated fatty acid regulation of adipocyte FADS1 and FADS2 expression and function. Obesity, 23, 725–728.
Rodrigo R., Miranda-Merchak A., Valenzuela Grau R., Bachler J.P., Vergara L. (2014): Modulation of (Na,K)-ATPase activity by membrane fatty acid composition: therapeutic implications in human hypertension. Clinical and Experimental Hypertension, 36, 17–26.
Schmitz G., Ecker J. (2008): The opposing effects of n-3 and n-6 fatty acids. Progress in Lipid Research, 47, 147–155. Schweitzer G.G., Chen Z., Gan C., McCommis K.S., Soufi
N., Chrast R., Mitra M.S., Yang K., Gross R.W., Finck B.N. (2015): Liver-specific loss of lipin-1-mediated phos-phatidic acid phosphatase activity does not mitigate intrahepatic TG accumulation in mice. Journal of Lipid Research, 56, 848–858.
Stuglin C., Prasad K. (2005): Effect of flaxseed consumption on blood pressure, serum lipids, hemopoietic system and liver and kidney enzymes in healthy humans. Journal of Cardiovascular Pharmacology and Therapeutics, 10, 23–27. Suh J.M., Zeve D., McKay R., Seo J., Salo Z., Li R., Wang M., Graff J.M. (2007): Adipose is a conserved dosage-sensitive antiobesity gene. Cell Metabolism, 6, 195–207.
Thering B., Graugnard D., Piantoni P., Loor J. (2009): Adi-pose tissue lipogenic gene networks due to lipid feeding and milk fat depression in lactating cows. Journal of Dairy Science, 92, 4290–4300.
Vajreswari A., Narayanareddy K. (1992a): Effect of dietary fats on erythrocyte membrane lipid composition and membrane-bound enzyme activities. Metabolism, 41, 352–358.
Vajreswari A., Narayanareddy K. (1992b): Effect of dietary fats on some membrane-bound enzyme activities, mem-brane lipid composition and fatty acid profiles of rat heart sarcolemma. Lipids, 27, 339–343.
Yang Y., Zhao C., Xiao S., Zhan H., Du M., Wu C., Ma C. (2010): Lipids deposition, composition and oxidative stability of subcutaneous adipose tissue and Longissimus dorsi muscle in Guizhou mini-pig at different develop-mental stages. Meat Science, 84, 684–690.
Yilmaz H.R., Songur A., Ozyurt B., Zararsiz I., Sarsilmaz M. (2004): The effects of n-3 polyunsaturated fatty ac-ids by gavage on some metabolic enzymes of rat liver. Prostaglandins, Leukotrienes and Essential Fatty Acids, 71, 131–135.
Yu K., Shu G. (2013): Fatty acid and transcriptome profiling of Longissimus dorsi muscles between pig breeds differ-ing in meat quality. International Journal of Biological Sciences, 9, 108–118.
Zhou R., Li S. (2009): In vitro antioxidant analysis and characterisation of antler velvet extract. Food Chemistry, 114, 1321–1327.
Zhu S.K., Tian Y.D., Zhang S., Chen Q.X., Wang Q.Y., Han R.L., Kang X.T. (2014): Adjacent SNPs in the transcrip-tional regulatory region of the FADS2 gene associated with fatty acid and growth traits in chickens. Genetics and Molecular Research, 13, 3329–3336.
Received: 2014–12–12 Accepted after corrections: 2015–06–11
Corresponding Author
Prof. Dr. Wen Chen, Henan Agricultural University, College of Animal Science and Veterinary Medicine, Zhengzhou, Henan, 450002, P.R. China


![CEDEFOP News [Vocational Training in Europe] No 2/1 9 88 European Dimension in Education](data:image/gif;base64,R0lGODlhAQABAIAAAP///wAAACH5BAEAAAAALAAAAAABAAEAAAICRAEAOw==)