doi: 10.17221/126/2015-AGRICECON
One of the dairy industry most prominent trends of the past decade has been its increasing globaliza-tion. The significantly increased demand for dairy products in the large emerging economies, many of which cannot be supplied domestically, has in-creased the magnitude of the global dairy trade (von Keyserlingk et al. 2013). The current economic situ-ation is complicated; the consequences of the eco-nomic crisis are still visible and the companies are searching for ways to achieve the growth (Hýblová 2014). At the same time, advances in the genetics, nutrition, and herd management have resulted in the increased milk yields and an associated reduction in the numbers of farms and cows in many countries (von Keyserlingk et al. 2013). The improvement of agricultural productivity is a consequence of a more efficient use of the production factors (Špička and Machek 2015). Many dairy farmers have adopted new technologies to boost the dairy farm profitability
and have changed the overall management of their dairy herds (Stelwagen et al. 2013). Given the policy changes within the European Union, the dairy herd size is expected also to increase in many European countries. Managing more cows may have implica-tions for the herd performance in the post-quota era (Jago and Berry 2011). In the Czech Republic, the overall process of the agriculture transformation has been most markedly reflected in the areas of the farm animal husbandry and production. The main reasons lie in the full liberalization of prices and the discontinuance of the relatively massive subsidies on the production or consumption prices since the 1990s. This has been reflected in a sharp decline in the number of farms with greatly increased herd sizes (MACR 2010).
As explained by Bailey et al. (1997), the economies of scale on modern dairy farms: (1) reduce the investment per cow, (2) lower the variable costs of production per
Dairy farm profit according to the herd size, milk yield,
and number of cows per worker
Lenka KRPALKOVA
1, Victor E. CABRERA
2, Jindich KVAPILIK
1, Jiri BURDYCH
3, 41Department of Cattle Breeding, Institute of Animal Science, Prague, Czech Republic
2Department of Dairy Science, University of Wisconsin, Madison, USA
3Department of Nutrition and feeding of farm animals, Institute of Animal Science, Prague,
Czech Republic
4VVS Verměřovice s.r.o,Verměřovice, Czech Republic
Abstract: Th e study evaluates the associations of the farm herd size (HERD), the milk yield (MY, kg/cow per year), and cows per worker (CW) with the production, reproduction, and economic traits in 60 commercial dairy herds (34 633 cows) in the
Czech Republic. Each parameter was split into 3 groups. Th e largest herds (≥ 750 cows) had the highest profi tability of costs
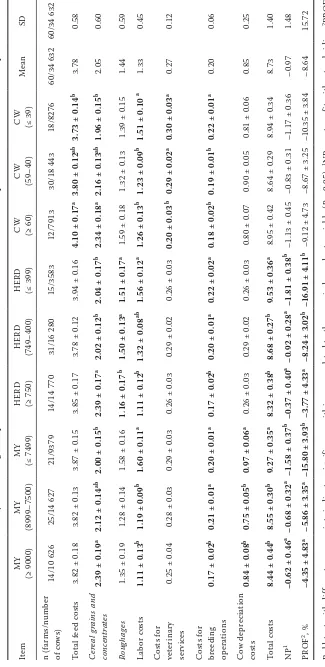
without subsidies (−3.8 ± 4.3%), the lowest cost for roughages (1.2 CZK/L milk), and the lowest cost for breeding operations (0.17 CZK/L milk), but the highest costs for the cereal grains and concentrates (2.4 CZK/L milk). Herds with the lowest MY (≤ 7 499) had the lowest profi tability of costs without subsidies (−15.8 ± 3.93%), the highest total costs (9.27 CZK/L milk), the highest labour costs (1.6 CZK/L milk), and the highest cow depreciation costs (0.97 CZK/L milk). Herds with the lowest CW (≤ 39) had the highest mean labour costs (1.51 CZK/L milk) and the highest costs for breeding operations (0.22 CZK/L milk). Herds with the highest CW (≥ 60) and the lowest CW (≤ 39) also diff ered in the total feed costs (4.1 vs. 3.73 CZK/L milk)
and the costs of cereals and concentrates (2.34 vs. 1.96 CZK/L milk). Th e increasing herd size tended to be accompanied by
higher milk yields and the overall effi ciency.
Keywords:cows, profi t, production, reproduction
unit, and (3) increase the labour and management efficiency. According to Olegginy et al. (2001), the increased herd size and specialization within the farm operation can bring efficiency improvements, which are in fact now becoming vital for the survival. Bailey et al. (1997) concluded that only dairy herd sizes in the range of 500 to 1 000 cows would be economically viable for the start-up operations. Von Keyserlingk et al. (2013) added that large herds tended to increase the production and to reduce the unit cost of milk, mainly as a result of spreading fixed costs across more production. In most countries with milk processing industries operating on a high level, farm income from milk sales is determined by the milk yield, the milk components (fat, protein, and lactose), and the milk quality (e.g., somatic cell counts) (Wolfova et al. 2007). It has also been shown that different milk pric-ing systems strongly influence the profitability of the milk production (Heikkilla et al. 2008). Cow fertility, too, plays an important role in the milk production and profitability of dairy herds (Giordano et al. 2012). Fertility has decreased in accordance with the rising milk production and such management changes as the growing numbers of cows per 1 worker and the time spent within the confinement housing (Grimard et al. 2006). Finally, the successful return on investment improves when the herd management is based on the quality heifer rearing, although it is often overlooked (Krpálková et al. 2014a).
Within this context, the objective of this study was to
evaluate the association of the farm herd size (HERD,
number of cows), the milk yield (MY, kg/cow per yr),
and cows per 1 worker (CW, cows/worker) with the
production, reproduction, and economic traits.
MATERIALS AND METHODS
Data from 60 Czech commercial dairy operations comprising 34 633 dairy cows were collected during 2012 (1 year) using a questionnaire. The collected data included the production and reproduction pa-rameters, rearing costs, economic papa-rameters, and other dependent variables (Tables 1 and 2). The inde-pendent variables were the herd size (HERD, number of cows), the milk yield (MY, kg/cow per year), and the number of cows/worker (CW). All parameters were measured as part of a standard milk recording system (ICAR 2013).
Cows on the participating farms were housed in the free-stall barns and milked in the parlour systems.
All calves were housed in the individual hutches equipped with buckets for water and fed a starter mixture. The diet of the heifers and cows consisted of the TMR (a mixture of forage and grain). The composition of the diets differed depending on the region, breed, management, and the use of the feed-ing company services.
Costs and net profit per L of milk produced were calculated according to a certified methodology used in the Czech Republic (Poláčková et al. 2010). The total feed costs included those for cereal grains, con-centrates, and roughages. The total costs included the total feed costs, labour costs, the costs of fuel and energy, the costs for veterinary services and breeding operations, depreciation of intangible and tangible fixed assets, cow depreciation costs, overhead costs, and other costs.
Net profit (NP) without government subsidies (i.e., direct payments to support dairy farmers) (CZK) was calculated as follows:
NP = TSM – TCc2 (1)
TCc2 = TCc1 – SC (2)
whereTSM= total sales of milk, TCc2 = total
accu-mulated costs for all cows less secondary revenues, TCc1 = total accumulated costs for all cows, SC= secondary products (i.e., rearing of calves, manure).
TCc1 includes the costs of purchased feed and bed-ding, self-produced feed and bedbed-ding, medicines and disinfectants, other direct costs and services, labour costs, depreciation of intangible and tangible fixed assets, depreciation of adult animals, costs of ancil-lary activities, and overhead (Poláčková et al. 2010).
Profitability of costs (PROF, in %) was calculated according to Equation 3 and was designated as a measurement of the business success (Poláčková et al. 2010). The purpose in using this parameter was the possibility of using it for making a yearly comparison among farms regardless of the herd size.
100 TCc2
NP PROF ¸u
¹ · ¨ © §
(3)
Statistical analyses
doi: 10.17221/126/2015-AGRICECON
and the specific variables’ boundaries that showed more statistical differences. Tukey’s test was used to determined significant differences among the means (Verbeke and Molenberghs 2000) and significance
was declared when P < 0.05. The general statistical
model was:
yijkl = μ + Bi + Rj+ Dk + eijkl (4)
whereyijkl = value of the dependent variable (Tables
1 and 2); μ = overall mean; Bi = ith breed effect (i =
32Holstein breed: 18 646 cows, 18 Czech Fleckvieh
breed: 7559 cows, 10 both breeds: 8428 cows); Rj
=effect of jth region of farm (j = frequency of the
studied farms [from 60 farms in total] in each of the 12 studied Czech regions: South Bohemia – 7; South Moravia – 5; Hradec Králové – 3; Liberec – 2; Moravia–Silesia – 5; Olomouc – 4; Pardubice – 6; Pilsen – 4; Central Bohemia – 10; Ústí nad Labem – 3;
Bohemian–Moravian Highlands –7; Zlín – 4); Dk =
effect of kth HERD, MY, or CW (Tables 1 and 2); and
eijkl = random error. Breed (Bi) was considered as a
fixed effect and the region of farm (Rj) as a random
effect. The independent variables HERD, MY, and CW were categorized in 3 groups (high, medium, and low) to help in interpreting the results of the analyses.
RESULTS AND DISCUSSION
Associations between herd size and profit
Jago and Berry (2011) had found no associations between the herd size and the milk production, except that the protein and fat amount increased with the herd size. In our study, the highest producing herds (MY ≥ 9000 kg) were those with the largest number of cows in the herd (809.07 ± 100.11 cows). The dif-ference in the mean MY between the largest and smallest herds was 442 kg. Percentage components (protein and fat) in milk did not differ significantly by the herd size, although the highest mean levels of the milk components were found in the largest herd group (not significant). It has previously been reported that large herds had a superior reproductive performance relative to the non-expanding and small herds (Faust et al. 2001). Animals in the expanding herds calved for the first time at a younger age, had a shorter calving interval, and were inseminated artificially at a higher rate (Jago and Berry 2011). Although the differences were not statistically significant, visible tendencies in our study correspond with these earlier findings.
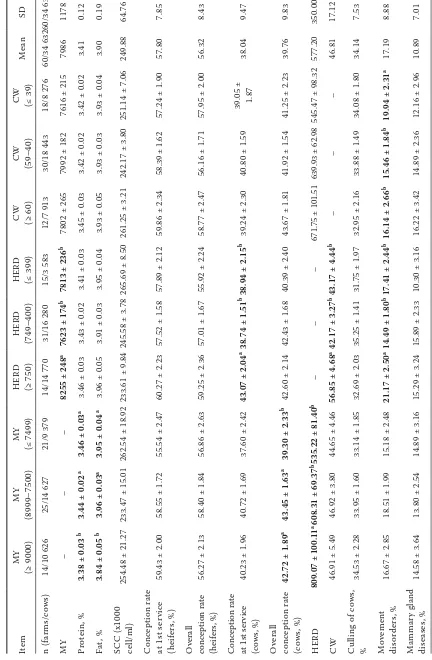
Culling rates also tend to increase with the herd size and milk yield. This probably relates to the CW and the amount of time available. Faust et al. (2001) found that culling increased when there were more than 50 cows per full-time employee. Nevertheless, we found no significant differences in culling rates according to HERD or CW, except that the highest mean incidence of culling due to the movement dis-orders, at 19.94 ± 2.31%, occurred with the lowest CW ≤ 39 and the highest mean at 21.17 ± 2.50% oc-curred when HERD < 750. Culling rates often increase when a herd expands as a result of buying cows from various sources (Alvasen et al. 2012; Derks et al. 2014). Also, generally the average parity number in cows reportedly decreases as the rate of expansion accelerates and as herd size increases (Olegginy et al. 2001; Alvasen et al. 2012). However, our results did not confirm these findings. The analysis of the survivability of calves in the evaluated HERD and CW groups showed the best results in the groups HERD ≥ 750 cows and CW ≥ 60 cows. Those differ-ences (of between 2 and 3 percentage points) between the highest and lowest CW groups were found to be statistically significant, however, only for the death rate and the total loss of calves (Table 1).
T
able 1. Ef
fe
c
t (me
an ± SD) of milk y
ie ld (M Y , kg/c ow p er y r), her d si ze (HE R D , n umb
er of c
o
ws), and n
umb
er of c
o ws p er wor ker (C W
) on lif
e time pr o duc -tion, r e pr o duc
tion, and he
alt h p arame ters It e m MY (≥ 9000) MY (8999–7500) MY (≤ 7499)
HERD (≥ 750)
HERD
(749–400)
HERD (≤ 399) CW (≥ 60)
CW
(59–40)
CW (≤ 39)
Me an SD n (f ar ms/c ows) 14/10 626 25/14 627 21/9 379 14/14 770 31/16 280 15/3 583 12/7 913 30/18 443 18/8 276 60/34 632 60/34 632 MY – – –
8255 ± 248
a
7623 ± 174
b
7813 ± 236
b
7802 ± 265
7992 ± 182
7616 ± 215
7986
1178
Pr
ot
ein, %
3.38 ± 0.03
b
3.44 ± 0.02
a
3.46 ± 0.03
a
3.46 ± 0.03
3.43 ± 0.02
3.41 ± 0.03
3.45 ± 0.03
3.42 ± 0.02
3.42 ± 0.02
3.41
0.12
Fa
t,
%
3.84 ± 0.05
b
3.96 ± 0.03
a
3.95 ± 0.04
a
3.96 ± 0.05
3.91 ± 0.03
3.95 ± 0.04
3.93 ± 0.05
3.93 ± 0.03
3.93 ± 0.04
3.90 0.19 S C C (x1000 ce ll/ml)
254.48 ± 21.27
233.47 ± 15.01
262.54 ± 18.92
233.61 ± 9.84
245.58 ± 3.78
265.69 ± 8.50
261.25 ± 3.21
242.17 ± 3.80
251.14 ± 7.06
249.88 64.76 Conc e ption ra te at 1st s e rv ic e (heif ers , %)
59.43 ± 2.00
58.55 ± 1.72
55.54 ± 2.47
60.27 ± 2.23
57.52 ± 1.58
57.89 ± 2.12
59.86 ± 2.34
58.39 ± 1.62
57.24 ± 1.90
57.80 7.85 O verall conc eption ra te (heif ers , %)
56.27 ± 2.13
58.40 ± 1.84
56.86 ± 2.63
59.25 ± 2.36
57.01 ± 1.67
55.92 ± 2.24
58.77 ± 2.47
56.16 ± 1.71
57.95 ± 2.00
56.32 8.43 Conc eption ra te at 1st s er vic e (c ows , %)
40.23 ± 1.96
40.72 ± 1.69
37.60 ± 2.42
43.07 ± 2.04
a38.74 ± 1.51 b38.94 ± 2.15
b
39.24 ± 2.30
40.80 ± 1.59
39.05 ± 1.87
38.04 9.47 O verall conc e ption ra te (c ows , %)
42.72 ± 1.89
a
43.45 ± 1.63
a
39.30 ± 2.33
b
42.60 ± 2.14
42.43 ± 1.68
40.39 ± 2.40
43.67 ± 1.81
41.92 ± 1.54
41.25 ± 2.23
39.76
9.83
HERD
809.07 ± 100.11
a608.31 ± 69.37 b 535.22 ± 81.40
b
–
–
–
671.75 ± 101.51
639.93 ± 62.98
545.47 ± 98.32
577.20
350.00
CW
46.91 ± 5.49
46.92 ± 3.80
44.65 ± 4.46
56.85 ± 4.68
a42.17 ± 3.27 b43.17 ± 4.44
b – – – 46.81 17.12 C
ulling of c
o
ws
,
%
34.53 ± 2.28
33.95 ± 1.60
33.14 ± 1.85
32.69 ± 2.03
35.25 ± 1.41
31.75 ± 1.97
32.95 ± 2.16
33.88 ± 1.49
34.08 ± 1.80
34.14 7.53 Movemen t dis o rders , %
16.67 ± 2.85
18.51 ± 1.99
15.18 ± 2.48
21.17 ± 2.50
a14.49 ± 1.80 b17.41 ± 2.44
b
16.14 ± 2.66
b
15.46 ± 1.84
b
19.94 ± 2.31
a 17.19 8.88 Mammar y gland dis e a se s, %
14.58 ± 3.64
13.80 ± 2.54
14.89 ± 3.16
15.29 ± 3.24
15.89 ± 2.33
10.30 ± 3.16
16.22 ± 3.42
14.89 ± 2.36
12.16 ± 2.96
10.89
doi: 10.17221/126/2015-AGRICECON It e m MY (≥ 9000) MY (8999–7500) MY (≤ 7499)
HERD (≥ 750)
HERD
(749–400)
HERD (≤ 399) CW (≥ 60)
CW
(59–40)
CW (≤ 39)
Me an SD P o st p a rt um co m plic ations , %
12.44 ± 2.15
a
9.15 ± 1.50
b
12.75 ± 1.87
a
10.64 ± 1.98
10.28 ± 1.43
13.09 ± 1.94
13.61 ± 2.00
10.11 ± 1.42
10.83 ± 1.78
21.06 10.07 L ow f e rtility , %
22.32 ± 3.13
18.21 ± 2.18
23.07 ± 2.72
21.47 ± 2.91
20.74 ± 2.09
19.99 ± 2.84
21.26 ± 3.01
19.59 ± 2.08
22.21 ± 2.61
14. 16 11.63 Se rv ic e s pe r conc e ption
2.21 ± 0.12
2.12 ± 0.07
2.23 ± 0.13
2.23 ± 0.11
a
2.23 ± 0.07
a
1.98 ± 0.10
b
2.14 ± 0.12
2.18 ± 0.07
2.17 ± 0.09
2.25 0.42 C alv ing in te rv al, d
398.15 ± 6.42
b
401.47 ± 4.05
b
411.30 ± 5.22
a
398.89 ± 5.89
406.93 ± 4.11
405.40 ± 5.59
400.20 ± 6.17
404.59 ± 4.24
407.12 ± 5.01
406.41
22.11
D
ays op
en, d
114.39 ± 4.98
b
110.63 ± 3.45
b
127.29 ± 4.05
a
111.33 ± 4.75
121.20 ± 3.32
116.75 ± 4.51
114.22 ± 5.01
115.93 ± 3.43
122.05 ± 4.06
120.69 19.24 Age a t f irst c alv ing , d
770.74 ± 14.02
b
791.98 ± 9.69
b
820.18 ± 12.18
a784.79 ± 13.24
799.24 ± 9.59
807.40 ± 12.63
781.01 ± 13.78
804.69 ± 9.48
797.93 ± 11.61
789.12 68.88 N umb er of lac ta tions
2.42 ± 0.18
2.52 ± 0.12
2.64 ± 0.16
2.43 ± 0.17
2.53 ± 0.12
2.66 ± 0.15
2.68 ± 0.17
a
2.57 ± 0.11
ab
2.39 ± 0.14
b 2.49 0.58 D e at h ra te of c alve s, %
5.42 ± 1.28
b
5.53 ± 0.89
b
8.18 ± 1.04
a
6.05 ± 1.20
6.42 ± 0.84
7.11 ± 1.14
5.56 ± 1.22
b
5.97 ± 0.84
b
7.81 ± 0.99
a 6.11 4.58 T o tal lo ss of c alve s, %
11.11 ± 1.48
b
11.45 ± 1.02
b
14.78 ± 1.20
a
11.68 ± 1.39
13.07 ± 0.97
12.75 ± 1.32
11.19 ± 1.43
b
12.41 ± 0.97
ab
13.85 ± 1.16
a 12.39 5.01 T o tal we ane d c alve s p er 100 co w s
97.45 ± 2.74
a
99.99 ± 1.90
a
91.56 ± 2.23
b
97.57 ± 2.65
96.34 ± 1.85
95.09 ± 2.51
98.75 ± 2.75
95.78 ± 1.87
95.62 ± 2.23
95.91 9.06 B old t ex t w it h dif fe re n t sup ers cr ipt s indic at e s sig nif ic anc e w it
hin a r
ow r ela te d t o t
he same inde
T
able 2. Ef
fe
c
t (me
an ± SD) of milk y
ie
ld (M
Y
, kg/c
ow p
er YR), si
ze of her
d (HE
R
D
, n
umb
er of c
o
ws), and c
o ws p er wor ker (C W ) on c o st
s and pr
of it It e m MY (≥ 9000) MY (8999–7500) MY (≤ 7499)
HERD (≥ 750)
HERD
(749–400)
HERD (≤ 399) CW (≥ 60)
CW
(59–40)
CW (≤ 39)
Me an SD n (f ar ms/n umb er of c o ws) 14/10 626 25/14 627 21/9379 14/14 770 31/16 280 15/3583 12/7913 30/18 443 18/8276 60/34 632 60/34 632 T o tal f e e d c o st s
3.82 ± 0.18
3.82 ± 0.13
3.87 ± 0.15
3.85 ± 0.17
3.78 ± 0.12
3.94 ± 0.16
4.10 ± 0.17
a
3.80 ± 0.12
ab
3.73 ± 0.14
b 3.78 0.58 C er eal g rain s an d concentr ate s
2.39 ± 0.19
a
2.12 ± 0.14
ab
2.00 ± 0.15
b
2.39 ± 0.17
a
2.02 ± 0.12
b
2.04 ± 0.17
b
2.34 ± 0.18
a
2.16 ± 0.13
ab
1.96 ± 0.15
b 2.05 0.60 R o u gha ge s
1.35 ± 0.19
1.28 ± 0.14
1.58 ± 0.16
1.16 ± 0.17
b
1.50 ± 0.13
a
1.51 ± 0.17
a
1.59 ± 0.18
1.32 ± 0.13
1.39 ± 0.15
1.44 0.59 L ab or c o st s
1.11 ± 0.13
b
1.19 ± 0.09
b
1.60 ± 0.11
a
1.11 ± 0.12
b
1.32 ± 0.08
ab
1.56 ± 0.12
a
1.26 ± 0.13
b
1.23 ± 0.09
b
1.51 ± 0.10
a 1.33 0.45 Co st s f o r ve te rinar y se rv ic es
0.25 ± 0.04
0.28 ± 0.03
0.29 ± 0.03
0.26 ± 0.03
0.29 ± 0.02
0.26 ± 0.03
0.20 ± 0.03
b
0.29 ± 0.02
a
0.30 ± 0.03
a 0.27 0.12 Co st s f o r br e e ding op era tions
0.17 ± 0.02
b
0.21 ± 0.01
a
0.20 ± 0.01
a
0.17 ± 0.02
b
0.20 ± 0.01
a
0.22 ± 0.02
a
0.18 ± 0.02
b
0.19 ± 0.01
b
0.22 ± 0.01
a 0.20 0.06 Cow de pr e cia tion co st s
0.84 ± 0.08
b
0.75 ± 0.05
b
0.97 ± 0.06
a
0.26 ± 0.03
0.29 ± 0.02
0.26 ± 0.03
0.80 ± 0.07
0.90 ± 0.05
0.81 ± 0.06
0.85 0.25 T o tal c o st s
8.44 ± 0.44
b
8.55 ± 0.30
b
9.27 ± 0.35
a
8.32 ± 0.38
b
8.68 ± 0.27
b
9.53 ± 0.36
a
8.95 ± 0.42
8.64 ± 0.29
8.94 ± 0.34
8.73
1.40
NP
1
–0.62 ± 0.46
a
–0.68 ± 0.32
a
–1.58 ± 0.37
b
–0.37 ± 0.40
a
–0.92 ± 0.28
a
–1.81 ± 0.38
b
–1.13 ± 0.45
–0.83 ± 0.31
–1.17 ± 0.36
–0.97
1.48
PROF
2, %
–4.35 ± 4.83
a
–5.86 ± 3.35
a
–15.80 ± 3.93
b
–3.77 ± 4.33
a
–8.24 ± 3.02
b
–16.91 ± 4.11
b
–9.12 ± 4.73
–8.67 ± 3.25
–10.35 ± 3.84
–8.64 15.72 B old t ex t w it h dif fe re n
t s up
ers cr ipt s indic at e s sig nif ic anc e w it
hin a r
ow r ela te d t o t
he same inde
p enden t v a ri able ( P < 0.05).
1NP = ne
t pr of it w it hout sub sidie s; 2PROF = pr of it
ability of c
doi: 10.17221/126/2015-AGRICECON
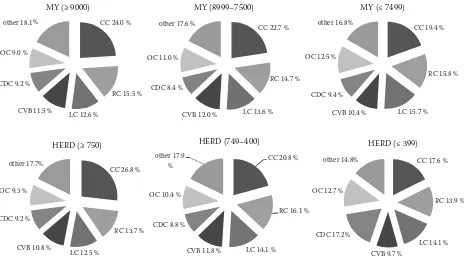
had the highest feed costs across all subcategories. The total feed costs and the costs of cereal grains and concentrates for that group were 4.10 ± 0.17 CZK and 2.34 ± 0.18 CZK per litre of milk, respectively. The differences between CW ≥ 60 cows and CW ≤ 39 cows in labour costs, costs for veterinary services, and costs for breeding operations were in favour of a higher CW number (Table 2). The distributions of the total costs according to the HERD groups are shown as percentages in Figure 1. The highest total costs (9.53 ± 0.36 CZK per L of milk) and the lowest net profit (−1.81 ± 0.38 per L of milk) occurred for the smallest herds (≤ 399 cows), whereas the highest profitability of cost was achieved for the largest herds (−3.77 ± 4.33 CZK per L of milk).
High-producing dairy herd
Researchers and producers commonly believe there is an inherent conflict between the high milk
[image:7.595.67.531.97.357.2]pro-duction and good fertility, health, and the overall profitability in lactating dairy cows. This possible an-tagonism is attributed to the competing physiological demands and the divergent genetic selection choices (Leroy and Kruif 2006). Generally, the management and genetic effects are considered separately. However, the selection for an increased production under one management system may lead to greater health risks under other management systems (Windig et al. 2006). Our results diverge from the view that a higher pro-ductivity must lead to a lower fertility. The analysis of MY in relation to the reproduction traits showed that the herds with MY ≥ 7500 kg/cow per year achieved the overall higher conception rates in cows. Also, those herds with a higher production (MY ≥ 9000 kg and MY of 8999–7500 kg/cow per year) had the shortest days open (114.39 ± 4.98 and 110.63 ± 3.45 d) and calving interval (398.15 ± 6.42 and 401.47 ± 4.05 d), respectively (Table 1). The reproduction problem lies in the inadequate management and environmental conditions in the high-producing herds (Heikkilä et
Figure 1. Distribution of total costs on 60 commercial dairy farms in the Czech Republic in 2012
Milk yield (MY, kg/cow per yr) values were grouped as: high (≥ 9000, n = 14; mean ± SD = 9507 ± 435), medium (8999–
7500, n = 25; mean ± SD = 8216 ± 509), and low (≤ 7499, n = 21; mean ± SD = 6,698 ± 484). Herd size was grouped as:
high (≥ 750, n = 14; mean ± SD = 1055 ± 385), medium (749 to 400, n = 31; mean ± SD = 525 ± 86), and low (≤ 399,
n = 15; mean ± SD = 239 ± 77). CC = cereal grains and concentrates feed costs, RC = roughages feed costs, LC = labor
costs, CDC = cow depreciation costs, CVB = costs for veterinary services and breeding operations, OC = overhead costs, other = costs of fuel and energy, depreciation of intangible and tangible fixed assets, and other.
CC 24.0 %
RC 15.5 %
LC 12.6 % CVB 11.5 %
CDC 9.2 % OC 9.0 %
other 18.1%
MY (≥ 9000)
CC 22.7 %
RC 14.7 %
LC 13.6 % CVB 12.0 %
CDC 8.4 % OC 11.0 %
other 17.6%
MY (8999–7500)
CC 19.4 %
RC 15.8 %
LC 15.7 % CVB 10.4 %
CDC 9.4 % OC 12.5 %
other 16.8%
MY (≤ 7499)
CC 26.8 %
RC 13.7 %
LC 12.5 % CVB 10.8 %
CDC 9.2 % OC 9.3 %
other 17.7%
HERD (≥ 750)
CC 20.8 %
RC 16.1 %
LC 14.1 % CVB 11.8 %
CDC 8.8 % OC 10.4 %
other 17.9 %
HERD (749–400)
CC 17.6 %
RC 13.9 %
LC 14.1 % CVB 9.7 %
CDC 17.2% OC 12.7 %
other 14.8%
al. 2008). These relationships between MY and health vary among herds and between cows within a herd (Kadokawa 2006). We found no significant differences between the MY groups regarding culling due to the movement disorders, mammary gland diseases, and a low fertility.
The herds with a higher production (MY ≥ 9000 kg and MY of 8999–7500 kg) had lower calf losses. The differences between the highest (≥ 9000 kg) and the lowest (≤ 7499 kg) MY groups for the death rate and the total loss of calves were approximately 3 to 4 percentage points. Similar results were found for the total weaned calves per 100 cows (Table 1). The nursing care for calves in lower MY herds was worst in comparison to that for the higher yielding herds Smith et al. (2000). In our study, a lower death loss was found in the higher MY groups (≥ 7500). Also, the herds with a higher production (MY ≥ 9000 kg and MY of 8999–7500 kg/cow per year) had heifers that were younger at the first calving (770.74 ± 14.02 and 791.98 ± 9.69 d, respectively). The difference in the mean age at the first calving between the high-est and lowhigh-est MY groups was 50 d (Table 1). Many studies suggest that the earlier the age at the first calving the better (Shamay et al. 2005; Stevenson et al. 2008). Krpálková et al. (2014b) concluded that the lowest average milk yield in the lifetime production was observed in the age at the first calving higher than 24.5 months of age.
The higher MY groups were the most profitable in the present study (Table 2), which also had lower total costs even though they had higher costs for the cereal grains and concentrates. According to Přibyl et al. (2004), the milk production per cow continues to increase by 2% to 3% annually and so the feed-ing strategies and approaches must correspond to the level of milk yield. Those herds with the best genetics cannot function well without high quality feedstuffs in sufficient amounts. Glanc et al. (2009) have reported that the components in milk (protein and fat) are important for the farm profitability and are positively correlated. Dairy managers must real-ize, however, that the selection for a higher milk yield can lead to the decline in the milk components on a percentage basis. In our study, the percentage contents of fat and protein in milk were the lowest in the highest MY group (protein 3.38 ± 0.03% and fat 3.84 ± 0.05%).
Kvapilík et al. (2013) have reported that the aver-age farm milk price in the Czech Republic during 2012 was 7.67 CZK/L of milk while the average of
the total costs was 9.14 CZK/L of milk. The average costs excluding indirect costs (i.e., the costs of rearing calves, the costs of manure disposal) were 8.73 CZK/L of milk. It is therefore evident that without subsidies, the dairy farms in the Czech Republic would be op-erating at a loss (Table 2). The lowest net profit per L of milk (−1.58 ± 0.37 CZK) and the profitability of costs without subsidies (−15.80 ± 3.93%) occurred in the lowest MY group (Table 2). The distributions of the total costs for all evaluated dairy farms according to MY and HERD level are shown as percentages in Figure 1. The largest single cost item was the total feed costs (i.e., cereal grains and concentrates feed costs, and roughages feed costs), which was the high-est in the larghigh-est herd size (HERD ≥ 750, 40.5%) and the lowest in the smallest herd size (HERD ≤ 399 kg, 31.5%). Within the feed costs, significant differences were observed only in the costs of the cereal grains and concentrates (Table 2). Those herds with the highest MY had the highest costs for cereal grains and concentrates per L of milk, at 2.39 ± 0.19 CZK, and the difference between the highest and lowest MY groups per L of milk was 0.39 CZK. The group with the lowest MY had the highest labour costs per L of milk (1.60 ± 0.11 CZK) and the highest cow depreciation costs per L of milk (0.97 ± 0.06 CZK). The highest MY group had the lowest costs for the breeding operations (0.17 ± 0.02 CZK). Increasing milk yields leave the total cost per L and net margin per L relatively unchanged, but the increased milk output substantially boosts the herd’s total profit (Buza et al., 2014). Kvapilík et al. (2013) and Heikkilla et al. (2008) found that the price movements for milk, the components in milk, and the production inputs can significantly affect the farm profitability and that the management should therefore adapt to these changes.
CONCLUSION
doi: 10.17221/126/2015-AGRICECON
the highest producing herds were also the largest herds and had the best reproductive performance. Furthermore, a higher number of cows per 1 worker was associated with a higher milk yield, larger herds, and ultimately a higher profitability. It is nevertheless evident that the market milk prices and subsidies have a major impact on the profitability of dairy farms in the Czech Republic.
ACKNOWLEDGMENTS
The authors thank those dairy producers who partic-ipated in this study. Their help was greatly appreciated. This research was supported by the project MZERO 0714 from the Ministry of Agriculture of the Czech Republic and QJ1510191 from the National Agency for Agricultural Research of the Czech Republic.
REFERENCES
Alvasen K., Jansson Mörk M., Halen Sandgren C., Thom-sen P.T., Emanuelson U. (2012): Herd-level risk factors associated with cow mortality in Swedish dairy herds. Journal of Dairy Science, 95: 4352–4362.
Bailey K., Hardin D., Spain J., Garret J., Hoehne J., Ran-dle R., Ricketts R., Steevens B., Zulovich J. (1997): An economic simulation study of large-scale dairy units in the Midwest. Journal of Dairy Science, 80: 205–214. Buza M.H., Holden L.A., White R.A., Ishler V.A. (2014):
Evaluating the effect of ration composition on income over feed cost and milk yield. Journal of Dairy Science, 97: 3073–3080.
Derks M., van Werven T., Hogeveen H., Kremer W.D. . (2014): Associations between farmer participation in veterinary herd health management programs and farm performance. Journal of Dairy Science, 97: 1336–1347. Faust M.A., Kinsel M.L., Kirkpatrick M.A. (2001):
char-acterizing biosecurity, health, and culling during dairy herd expansions. Journal of Dairy Science, 84: 955–965. Glantz M., Lindmark Mansson H., Stalhammer H., Bårström
L.-O., Fröjelin M., Knutsson A., Teluk C., Paulsson M. (2009): Effects of animal selection on milk composi-tion and processability. Journal of Dairy Science, 92: 4589–4603.
Grimard B., Freret S., Chevallier A., Pinto A., Ponsart C., Humblot P. (2006): Genetic and environmental fac-tors influencing first service conception rate and late embryonic/foetal mortality in low fertility dairy herds. Animal Reproduction Science, 91: 31–44.
Heikkilä A.-M., Nousiainen J.I., Jauhiainen L. (2008): Op-timal replacement policy and economic value of dairy cows with diverse health status and production capacity. Journal of Dairy Science, 91: 2342–2352.
Hýblová E. (2014): Analysis of mergers in Czech agricul-ture companies. Agricultural Economics – Czech, 60: 441–448.
Jago J.G., Berry D.P. (2011): Associations between herd size, rate of expansion and production, breeding policy and reproduction in spring-calving dairy herds. Animal, 5: 1626–33.
Kadokawa H., Martin G.B. (2006): A new perspective on management of reproduction in dairy cows: the need for detailed metabolic information, an improved selection index and extended lactation. Journal of Reproduction and Development, 52: 161–168.
Krpálková L., Cabrera V., Kvapilík J., Burdych J., Crump P. (2014a): Association between age at first calving, rearing average daily weight gain, and herd milk yield level on dairy herd production, reproduction, and profitability. Journal of Dairy Science, 97: 6573–6582.
Krpálková L., Cabrera V., Vacek M., Štípková M., Stádník L., Crump P. (2014b): Impact of prepubertal and post-pubertal growth and age at first calving on production and reproduction traits during the first 3 lactations in Holstein dairy cattle. Journal of Dairy Science, 97: 3017–3027.
Kvapilík J., Růžička Z., Bucek P. (2013): Yearbook. Raising cattle in the Czech Republic – Main results and indica-tors for 2012. ČMSCH a.s. Praha: 10–22.
Olegginy G.H., Ely L.O., Smith J.W. (2001): Effect of region and herd size on dairy herd performance parameters. Journal of Dairy Science, 84: 1044–1050.
Poláčková J., Boudný J., Janotová B., Novák J. (2010): Metodika kalkulací nákladů a výnosů v zemědělství. (Methodology for calculation of costs and benefits in agriculture.) ÚZEI, Prague.
Přibyl J., Šafus P., Štípková M., Stádník L., Čermák V. (2004): Selection index for bulls of Holstein cattle in the Czech Republic. Czech Journal of Animal Science, 49: 244–256.
SAS Institute (2008). SAS/STAT® 9.2 User’s Guide. SAS Inst. Inc., Cary, NC.
Shamay A., Werner D., Moallem U., Barash H., Bruckental I. (2005): Effect of nursing management and skeletal size at weaning on puberty, skeletal growth rate, and milk production during first lactation of dairy heifers. Journal of Dairy Science, 44: 1460–1469.
Stelwagen K., Phyn C.V.C., Davis S.R., Guinard-Flament J., Pomiès D., Roche J.R., Kay J.K. (2013): Invited re-view: Reduced milking frequency: Milk production and management implications. Journal of Dairy Science, 96: 3401–3413.
Stevenson J.L., Rodrigues J.A., Braga F.A., Bitente S., Dalton J.C., Santos J.E.P., Chebel R.C. (2008): Effect of breeding protocols and reproductive tract score on reproductive performance of dairy heifers and economic outcome of breeding programs. Journal of Dairy Science, 91: 3424–3438.
Ministry of Agriculture of the Czech Republic (MACR) (2010): Summary Report: General information about Agriculture in the Czech Republic in 2009. Ministry of Agriculture of the Czech Republic, Prague.
Špička J., Machek O. (2015): Change in the production efficiency of European specialized milk farming. Agri-cultural Economics – Czech, 61: 1–13.
von Keyserlingk M.A.G., Martin M.P., Kebreab E., Knowlton K.F., Grant R.J., Stephenson M., Sniffen C.J., Harner J.P., Wright A.D., Smith S.I. (2013): Invited review: sustainability of the US dairy industry. Journal of Dairy Science, 96: 5405–5425.
Verbeke G., Molenberghs G. (2000): Linear Mixed Models for Longitudinal Data. Springer-Verlag, New York. Windig J.J., Calus M.P.L., Beerda B., Veerkamp R.F. (2006):
Genetic correlations between milk production and health and fertility depending on herd environment. Journal of Dairy Science, 89: 1765–1775.
Wolfová M., Wolf J., Přibyl J. (2007): Impact of milk pricing system on the economic response to selection on milk components. Journal of Animal Breeding and Genetic, 124: 192–200.
Received: 21th April 2015
Accepted: 16th June 2015
Contact address:
Lenka Krpálková, Department of Cattle Breeding, Institute of Animal Science, Přátelství 815, 10400 Prague 10 – Uhříněves, Czech Republic