The world’s population is growing rapidly, and living standards are being enhanced; in association with these developments, the consumption of energy and resources is also increasing. The consequence is a significant change in climate.
The urgent need to reduce energy consumption
and also CO2 output around the world is existing.
To prevent climatic damage (global warming of more than 2 °C above pre-industrial levels), artificially made emissions must be reduced by at least 25–40% by the year 2020 (relative to the reference year 1990). The term sustainability, best known for its connotations in forestry, is now on everyone’s lips. Sustainability in forestry refers to the method of management of a forest whereby no more wood is extracted than can be grown again; thus, the forest is never completely cleared, but instead it is continuously regenerated.
This development has directed to a total trans-formation of viewpoint which is reviewed as much in common life as in commercial production and which characterizes the approach for technological and design innovations. For example, whereas car advertisements previously highlighted engine power (PS) and maximum speed ({km/h), other key factors, such as fuel consumption (l/100 km) and CO2 emis-sions (kg CO2/100 km), now play a significant role. A car in 1970 (e.g. the Opel Kadet) had a consumption
of 12 l/100 km and a weight of just 750 kg (Radgen and Blaustein 2001). Today, a mid-range car has only half of this fuel consumption at twice the weight in comparison with the old car.
Manufacturing activities improve the quality of human life by providing products, also extensively contribute to the global economy (Garetti and Taisch 2012). However, the associated environmental im-plications are also significantly high compared with other industries. Therefore, these activities need to be transformed into the more environmentally conscious way; this can be called as ‘sustainable production’. In fact, sustainable production reflects one of the most crucial components of sustainable development (Garetti and Taisch 2012).
Energy-consuming and resource adequac y at a particular manufacturing process is often con-nected with the sustainable development of society. Birciakova and Stavkova (2015) showed that there is a correlation between sustainable development and living standards. Sustainable development is also taken into consideration in the agricultural trade, and therefore the individual countries are always reforming and adapting to the standard market con-ditions (Svatos and Smutka 2014). Shrivastava et al. (2016) pointed that technological innovation can be served for achieving sustainable development.
Robust parameter design for the optimisation of
cutting conditions according to energy efficiency
criteria
Tomas MACAK,
Jan HRON
Faculty Economics and Management, Czech University of Life Sciences in Prague, Prague, Czech Republic
Abstract: An important objective in process design in the wood-processing industry is to make the system robust – or in-sensitive – to sources of variability that cannot be entirely controlled once the system is in use. Experimental designs can be used to solve some of these problems. Th e fi rst techniques were introduced in the 1980s by Genichi Taguchi, a Japanese engineer. Th e objective of this paper is to apply advanced methods for optimization of cutting conditions using a robust design in the wood-processing industry according to energy effi ciency criteria. By showing some numerical simulation re-sults, the eff ectiveness of the proposed model is illustrated.
Fargnoli et al. (2014) demonstrated that even though well-established tools have been developed to help designers in facing with environmental problems, a more user-centred approach which follows design for sustainability issues has not been proposed yet. Kapounek and Pomenkova (2013) proved that the non-sustainable use of resources leads to the global financial crisis which is not caused by economic cycles. Sustainable development approach can also bring a competitive advantage. Hynds et al. (2014) proposed a comprehensive framework which focused on collaborative new product development procuring a sustainable advantage.
The energy efficiency of manufacturing processes, both in the wood processing industry and in other sectors, is a key aspect for the future use of mod-ern technologies and from a strategic perspective guarantees the sustainable development of society. This paper describes the optimization of a critical component of energy consumption in woodwork-ing, namely the optimization of the cutting process.
METHODOLOGY AND DATA
A Taguchi design is the optimization method that allows the researcher select a product or process that works more consistently and more efficiently in the operating environment. Taguchi designs identify that not each factor causing variability can be handled. The so-called uncontrollable factors are considered as noise factors. Taguchi designs attempt to determine controllable factors, which minimize the effect of the noise factors. During experimentation, the researcher control noise factors which induce variability and then sets the optimal control factor regulation that makes the process (or product) resistant to varia-tion from the noise factors. A process designed with this goal will produce a more consistent output. Moreover, a product designed with this objective will deliver more consistent performance, regardless of the environment in which it is used.
The aim of a robust parameter design is usually to determine factor settings that will minimize the variability of the response to some ideal target value (or target function in the case of a dynamic response experiment). Taguchi methods do this through a two-step optimization process. The first step con-centrates on minimizing variability, while the second focuses on reaching the target, as follows: Fixed all factors that have a significant effect on the
signal-to-noise (S/N) ratio at the level where the S/N ratio is maximized; and Adjust the level of one or a set of factors that extensively affect the mean (but not the S/N ratio) to allow the response to the target value.
Some scientists have used different cutting measure-ment techniques to monitor machining conditions. Recently, extraordinary efforts have been made to develop reliable, powerful monitoring systems based on different types of sensors, such as cutting force and torque, motor current and sufficient power, vi-brations, acoustic emission or audible sound energy (Bagci 2011). Scholz and Hoffmann (1999) introduce specific research which investigates the applicabil-ity of several methods used for audio signals to set relationships between the signals (formed by ma-chining) and the surface roughness. Aguillera and Martin (2001) proved the influence of cutting forces to an estimation of the best cutting conditions. They invented that measuring the energy consumption for given cutting conditions is sufficient, as this permits to obtain a first evaluation of the cutting forces. Sometimes is useful to examine the effects of cutting forces during profile cutting process us-ing both experimental and analytical approaches (Porankiewisz et al. 2008).
To establish the relationship between the cutting performance and the cutting parameters, few sta-tistical models based on formal methods (optimal solutions) and non-conventional techniques (near-optimal solutions) have been designed (Mukherjee and Pradip 2006). In conventional methods, experimental method–based approaches, such as the response sur-face methodology and the Taguchi methodology, were widely and successfully used. For non-conventional techniques, genetic algorithm method–based ap-proaches can be mentioned. Yang and Tarng (1998) used the Taguchi method, a powerful tool to design optimization for quality, to determining the optimal cutting parameters for turning bars using tungsten carbide cutting tools. The experimental results are usually converted into a static S/N ratio. In contrast (Taguchi et al. 2005) suggested using a dynamic S/N ratio to reflect the temporal variability of noise fac-tors. Takahashi et al. (2000) evaluated the turning parameters of a stainless steel part by measuring the total energy consumption. The authors have used an orthogonal array) with the concept of a generic function and dynamic S/N ratios. They notified high reproducibility of the response S/N ratios calculated for electrical power consumed during machining.
(1) To identify the key milling process parameters that influence the quality of the surface (surface roughness, Ra) concerning the energy perfor-mance of the milling process;
(2) To identify the key milling process parameters (noise factor) that influence the variability in Ra; (3) To determine the optimal settings of the milling process parameters that can meet objectives (1) and (2).
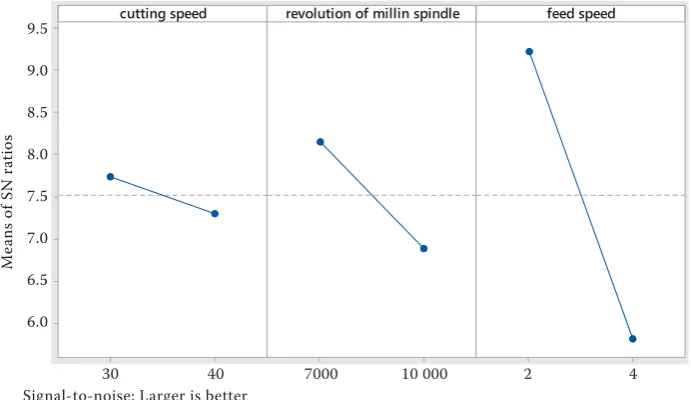
The goal of the analysis is to find factor settings that maximize both the mean and the signal-to-noise ratio. Regarding energy optimization, we have chosen an S/N ratio where ‘larger is better’ (see Figure 1 and Formula (1)).
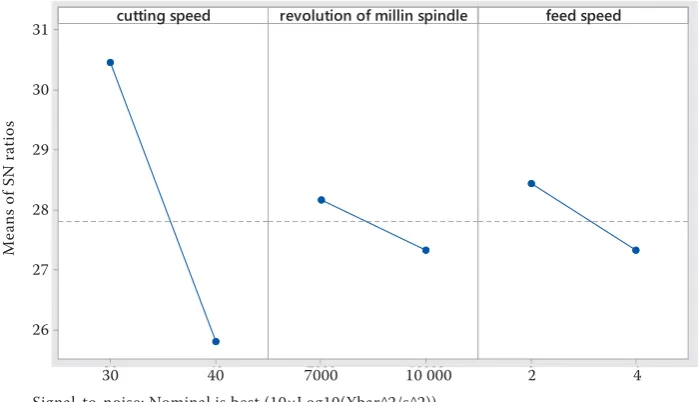
[image:3.595.60.537.115.189.2]From the perspective of robustness and stability of the solution, we have chosen “nominal is best” (see Figure 2 and Formula (3)).
Taguchi (2005) stated that ‘The larger-the-better characteristic should be nonnegative, and its most desirable value is infinity’. Moreover, as Joglekar (2003) argued, ‘Characteristics such as bond strength
also do not have negative values, but larger values are preferred.’
ܵ
ܰൌ െͳͲ݈݃ଵሺܯܵܦሻ ൌ ͳͲ݈݃ଵ൭ ͳ ݊
ͳ ݕଶ
ୀଵ
൱ (1)
The mean squared deviation (MSD) is used in the
formulation of the quality loss function. The term ((yi–m)2 ) is the MSD for a group of n products given
the performance readings of yi = y1, y2, y3,… , yn
and a target of m:
ܯܵܦ ൌͳ
݊ሺݕെ ݉ሻ ଶ
Àୀଵ
(2)
ܵ
ܰൌ െͳͲ݈݃ଵሺܯܵܦሻ (3)
Response R was measured using experiments with
two replications and two independent variables, namely the surface roughness Ra (μm) and current energy
consumption measured as power P (kW) of the drive
spindle. R was then determined by Relationship (4): Table 1. List of process parameters for the experiment
Process parameter Unit Low level setting High level setting Low level setting (coded units) High level setting(coded units)
Cutting speed m × s–1 30 40 –1 +1
Revolutions per minute
of milling spindle min–1 7000 10 000 –1 +1
Feed speed mm×min–1 2 4 –1 +1
Source: own design
Figure 1. Main effects for the signal-to-noise (S/N) ratio when larger is better
Source: own analysis
cutting speed revolution of millin spindle feed speed
Signal-to-noise: Larger is better 9.5
9.0
8.5
8.0
7.5
7.0
6.5
6.0
Me
ans of SN ra
tio
s
[image:3.595.125.471.517.717.2]ቂ P݉
ͳͲൈ ܹ݇ ൈ ݄ݑݎቃ ൌ
ሺࡾࢇࡹࢄെ ࡾࢇሻ
ൈ ࡼ ቂ
P݉
ͳͲൈ ܹ݇ ൈ ݄ݑݎቃ
ξࢂ
ࡼ ቂ
݉
ܹ݇ ൈ ݄ݑݎቃ (4)
where RaMAX is the maximum surface roughness
achieved with the chosen technology (in this case,
RaMAX = 32 μm). P is the power input of the machine multiplied by the duration of the power supply (i.e.
energy demands the machining process); V is the
volume of removed material during machining that fills cube having the side a3 = V.
Ra is the arithmetic mean deviation of the surface. The process of getting Ra values is performed in two phases. In the first phase, the value of the obtained roughness at several control points is converted to a group representing the arithmetic mean of absolute variations in the profile, in the original length Ra. Using a profilometer with the electromechanical transfer, a photographic record is gained; if the case may be, data on the discrete heights and hollows of the profile y (xi) are achieved. If the photographic record of a controlled area is accurate, then Ra ex-Figure 2. Main effects for signal to noise when nominal is the best
[image:4.595.116.466.97.298.2]Source: own analysis
Table 2. Results from the optimiser of response R (rate of Ra and P)
Taguchi Analysis Response 1 (Response 2 (versus cutting speed; revolution of spindle; feed speed)) S/N Ration: 31.6813
Level Cutting speed Revolution of spindle Feed rate
1 1 1
Response Table for Signal to Noise Ratios Nominal is best (10×Log10(Ybar^2/s^2))
Level Cutting speed Revolution of spindle Feed rate
1 30.46 28.16 28.43
2 25.81 27.32 27.33
Delta 4.65 0.84 1.10
Rank 1 3 2
Response Table for Means
Level Cutting speed Revolution of spindle Feed rate
1 2.513 2.625 2.913
2 2.362 2.250 1.962
Delta 0.150 0.375 0.950
Rank 3 2 1
Source: own calculation
40
30 7000 10000 2 4
cutting speed revolution of millin spindle feed speed
Signal-to-noise: Nominal is best (10×Log10(Ybar^2/s^2)) 31
30
29
28
27
26
Me
ans of SN ra
tio
s
[image:4.595.62.535.536.743.2]pressed by median arithmetic deviation of the profile is calculated according to Relation (5):
ܴܽ ൌ ȁݕሺݔሻȁ݀ݔ
݈ (5)
where l is the basic length. The geometric interpreta-tion of Ra according to Relation (5) is the representa-tion of the rectangle height create over the nominal dimensions of the workpiece. Its surface space is just equal to the area defined by the median line of the profile and the curve of the actual profile. If we have the discrete values related to the heights of inequali-ties in a controlled area, then we can determine the surface roughness according to (6):
ܴܽ ൌͳ
݊ൈ ȁݕሺݔሻȁ
ୀଵ
(6)
where n is the number of measured profile
in-equalities. Now, the calculated value of a particular
workpiece Ra can be performed to some preferred
numbers of roughness. For the assignment to a series of preferred numbers of roughness, we will again use the membership function.
The optimum response R provided by the response
optimizer and exactly expressed by Formula (6) is extremely close to what was determined by visual inspection of Figures 1 and 2. Table 2 shows that
responses of the surface (surface roughness, Ra),
concerning the energy performance of the milling process, have limitations when it comes to seeking the best possible result.
DISCUSSION AND CONCLUSIONS
Rising industrial and human activities and global warming issues across the world, environmental and ecosystem level sustainability concerns have become the central component of public policymak-ing. Along with the rapid economic growth of the industrial revolution and new capitalist understand-ing in theory and then application of economics, profit-based decision-making in the business world, an increase in product variety and complexity caused significant increases in the environmental impacts of industrial activities. And, manufacturing activities are primarily responsible for global carbon emissions and other environmental implications because of their machine intensive and non-renewable resource intensive nature. Therefore, sustainable production has become a topic of importance in the developed
economies and nowadays, in the developing ones as well with the continued awareness heightening policies of the Czech Republic and its industrial organizations. We used a particular design that can be employed to identify control factors that reduce variability in the wood-milling process by minimizing the effects of uncontrollable factors (in this case, the noise factor is Ra). Process parameters, in this case, cutting speed, revolutions of the milling spindle, and
feed rate is under control. Noise factors route Ra
cannot be controlled during production or product use but can be measured during experimentation. The main result of this designed experiment is the identification of optimal control factor settings that make the wood-milling process resistant to varia-tion from the noise factors from the perspective of energy consumption. Higher values of the S/N ratio indicate control factor settings that minimize the effects of the noise factors.
Acknowledgements
We would like to express our gratitude to Dr Blanka Steinmiler, quality manager of Mubea Ltd., for per-mitting the execution of the experiment. The authors also gratefully acknowledge the anonymous reviewers for carefully reading the manuscript and providing several useful suggestions.
REFERENCES
Aguillera A., Martin P. (2001): Machining qualification of solid wood of Fagus silvatica and Picea excelsa L.: Cut-ting forces power requirements and surface roughness. Holz als Roh- und Werkstoff, 59: 483–488.
Bagci E. (2011): Monitoring and analysis of MRR-based federate optimization approach and effects of cutting conditions using acoustic sound pressure level in free-form surface milling. Scientific Research and Essays, 6: 256–277.
Birciakova N., Stavkova J. (2015): Factors influencing liv-ing standards in EU. In: Proceedliv-ings of the 2015 In-ternational Conference “Economic Science for Rural Development” No. 40, Jelgava, LLU ESAF, Apr 23–24, 2015: 170–175.
Garetti M., Taisch M. (2012): Sustainable manufacturing: Trends and research challenges. Production Planning & Control, 23: 83–104.
Hynds E.J., Brandt V., Burek S., Jager W., Knox P., Parker J.P., Schwartz L., Taylor J., Zietlow M. (2014): A maturity model for sustainability in new product development. A new assessment tool allows companies to benchmark progress toward sustainability goals and drive NPD growth. Research-Technology Management, 57: 50–57. Joglekar A.M. (2003): Statistical Methods for Six Sigma. In: R & D and Manufacturing, Wiley-Interscience, John Wiley & Sons, Inc., Hoboken.
Kapounek S., Pomenkova J. (2013): The endogenity of optimum currency area criteria in the context of finan-cial crisis: Evidence from the time-frequency domain analysis. Agricultural Economics – Czech, 59: 389–395. Mukherjee I., Pradip K.R. (2006): A review of optimization techniques in metal cutting processes. Computers & Industrial Engineering, 50: 15–34.
Porankiewisz B., Dolata A., Wieloch G. (2008): Cutting force during the turning of wood from black locust. BioRessource, 3: 745–757.
Radgen P., Blaustein E. (2001): “Mit Druckluft sparen”, Compressed Air Systems in the European Union: En-ergy, Emissions. Savings Potential and Policy Actions, Stuttgart.
Scholz W., Hoffmann W. (1999): Cutting force measure-ment and practical applications. In: Proceedings of International Wood Machining Seminar (IWMS 14). Paris, Epinal, Cluny, 1: 241–248.
Shrivastava P., Ivanaj S. (2016): Strategic technological innovation for sustainable development. International Journal of Technology Management, 70: 76–107. Svatos M., Smutka L. (2012): Development of agricultural
trade and competitiveness of the commodity structures of individual countries of the Visegrad Group. Agricul-tural Economics – Czech, 58: 222–238.
Taguchi G., Chowdhury S., Wu Y. (2005): Taguchi’s Quality Engineering Handbook. John Wiley & Sons, Hoboken. Takahashi K., Kousaka S., Hoshiya K., Yano K., Nishiuchi
N., Yano H. (2000): Optimization of machining condition through observation of electric power consumption. Quality Engineering, 8: 24–30.
Yang W., Tarng Y. (1998): Design optimization of cutting parameters for turning operations based on the Taguchi method. Journal of Materials Processing Technology, 84: 122–129.
Received: 5th April 2016
Accepted: 21th June 2016
Contact address:
Tomas Macak, Faculty Economics and Management, Czech University of Life Sciences in Prague, Kamýcká 129, 165 21 Prague 6, Czech Republic