Phase-Field Simulation of Microstructure Changes in Ni
2MnGa Ferromagnetic Alloy
Under External Stress and Magnetic Fields
Toshiyuki Koyama
*and Hidehiro Onodera
Computational Materials Science Center Independent Administrative Institution National Institute for Materials Science Tsukuba 305-0047, Japan
Since the factors that influence microstructure formation are extensive (e.g., alloy composition, applied stress, external magnetic field, etc.), quite a lot of experimental trial-and-error is often necessary when searching for the best combination of desired microstructure and material properties, even when the basic mechanism of microstructure formation is understood. During the last decade, the phase-field method has emerged across many fields in materials science as a powerful tool to simulate and predict complex microstructure evolution. Since the phase-field methodology can model complex microstructure changes quantitatively, it is possible to search for the most desirable microstructure by using this method as a design simulation,i.e., through computer trial-and-error testing. In order to establish this methodology, first of all, quantitative modeling of complex microstructure changes using the phase-field method is required.
The objective of this study is to model the twin macrostructure developments in Ni2MnGa ferromagnetic alloy under external stress and magnetic field. This alloy has been actively investigated in the field of the magnetic induced shape memory effect, recently. Through the computer simulation, we show that it is possible to model the macrostructure changes in Ni2MnGa quantitatively using the phase-field method. This modeling method may also be applicable to another alloy systems that the magnetic shape memory effect will take place. The simulation result also suggests that the mobility of twin boundary motion is enhanced just below the Ms temperature. Using the phase-field method to model the microstructure evolutions is thought to be a very effective strategy in predicting and analyzing the complex microstructure formation where the magnetic and stress fields should be considered simultaneously.
(Received June 19, 2003; Accepted September 26, 2003)
Keywords: phase-field method, phase transformation, phase decomposition, martensitic transformation, shape memory effect, twin, evolution equation
1. Introduction
Since the factors that influence microstructure formation are extensive (e.g., alloy composition, applied stress, external magnetic field, etc.), quite a lot of experimental trial-and-error is often necessary when searching for the best combination of desired microstructure and material proper-ties, even when the basic mechanism of microstructure formation is understood. During the last decade, the phase-field method1–5)has emerged across many fields in materials science as a powerful tool to simulate and predict complex microstructure evolution. Since the phase-field methodology can model complex microstructure changes quantitatively, it is possible to search for the most desirable microstructure by using this method as a design simulation, i.e., through computer trial-and-error testing. In order to establish this methodology, first of all, quantitative modeling of complex microstructure changes using the phase-field method is required.
The objective of this study is to model the twin macro-structure developments in Ni2MnGa ferromagnetic alloy
under external stress and magnetic fields. Since Ullakko6)et al. found the magnetic shape memory effect in Ni2MnGa
alloy, the considerable attention has been focused on clarifying the nature of magnetic field induced gigantic strain and on searching similar ferromagnetic shape memory materials, because the response of magnetic shape memory effect is much faster than that of normal shape memory alloy with thermal treatment.7)For this reason, this alloy system has been actively investigated in the field of the magnetic induced shape memory effect.6–9) However, because the
microstructure changes are affected by various factors,e.g., external magnetic field, applied stress, internal stress, driving force for martensitic transformation, mobility of twin boundary motion, etc., the quantitative modeling of the complex microstructure development is required in order to understand the nature of magnetic induced shape memory effect. In this study, we try to show that it is possible to model the macrostructure changes in Ni2MnGa quantitatively using
the phase-field method, and discuss the relation between the mobility of twin boundary motion and the chemical driving force for martensitic transformation.
2. Calculation Method
It has already been known that the Ni2MnGa phase
exhibits a thermoelastic martensitic transformation from the L21-type (Heuslar) structure to a tetragonal structure
accom-panied by the formation of the twin microstructure during cooling.8) Henceforth, the L21-type cubic phase at high
temperature and the tetragonal phase at low temperature are, for simplicity, written as ‘‘c-phase’’ and ‘‘t-phase’’, respec-tively.
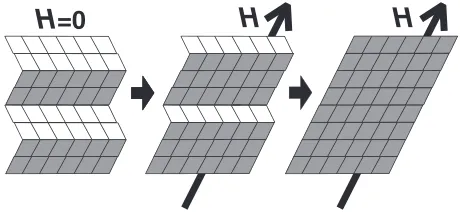
Figure 1 shows the schematic illustration to explain the mechanism6) of magnetic field induced gigantic strain by twin boundary motion, whereHis an external magnetic field. It is thought that the main driving force for twin boundary motion is the difference of the magnetocrystalline anisotropy energy between neighboring twin domains, i.e., the twin domains that the magnetization easy axis coincides with the direction of the external magnetic field are energetically stable, then twin boundary moves as this stable domain growing up. On the basis of this mechanism, the objective microstructure changes to simulate in this study are the
*Corresponding author, E-mail: [email protected]
Special Issue on Structural and Functional Control of Materials through Solid-Solid Phase Transformations in High Magnetic Field
cubic!tetragonal crystal structure transformation,i.e. mar-tensitic transformation, and the twin domain microstructure developments under external magnetic field. The twin
domain microstructure change induced by the applied stress is also simulated.
2.1 Total free energy of microstructure
In order to model these microstructure changes using phase-field method, we need the expression of the total free energy functional describing the complex microstructure changes reasonably. The total free energy1) of the micro-structure,Gsys, is defined as a sum of the chemical free energy
Gc, elastic strain energy Estr, gradient energy Esurf, and
magnetic energyEmag, so thatGsys is written as:
Gsys¼GcþEsurfþEstrþEmag: ð1Þ
For the cubic!tetragonal structural transformation, the function of chemical free energy can be presented in the Landau polynomial form:10)
Gc¼ Z
r
Gc!t A
2
X3
p¼1
s2pðr;tÞ B
3
X3
p¼1
s3pðr;tÞ þC
4
X3
p¼1
s2pðr;tÞ
( )2
2 4
3
5dr; ð2Þ
wherespðr;tÞis the order parameter (phase-field variable) describing thep-th orientation variant of t-phase, the range of which
is0sp 1. The condition ofspðr;tÞ ¼0corresponds to c-phase andspðr;tÞ ¼1is t-phase.spðr;tÞis the continuous field
variable which means the probability to find the t-phase withp-th orientation variant at positionrand timet. The subscript
p¼1, 2 and 3, that mean the c-axes directions of t-phase, correspond to the Cartesian coordinatesx,y, andz, respectively.
Gc!tis the chemical driving force for the cubic!tetragonal phase transition. The constantsA,BandCdetermine the shape
of chemical free energy curve,BandCare defined byB3Aþ12andC2Aþ12, respectively. Gradient energy,11,12)Esurf, originates from the spatial inhomogeneity of the order parameter, is given by
Esurf ¼ Z
r
s X3
p¼1
frspðr;tÞg2dr; ð3Þ
wheresis a gradient energy coefficient.
The elastic strain energy13,14)including the applied stress term is expressed as
Estr ¼
1
2
Z
r
Cijklf"cijðr;tÞ " 0 ijðr;tÞgf"
c
klðr;tÞ " 0
klðr;tÞgdr
A
ij""
c
ijðtÞ; ð4Þ
whereCijklis elastic constant15)andAijis applied stress. The stress free strain" 0
ijðr;tÞ, which is assumed to be a linear function
with respect to the order parametersp, is written as
"0ijðr;tÞ ¼X
3
p¼1
"00ijðpÞspðr;tÞ ¼"00ijð1Þs1ðr;tÞ þ"ij00ð2Þs2ðr;tÞ þ"ij00ð3Þs3ðr;tÞ: ð5Þ
In this study, as we employed two dimensional simulation, the lattice mismatch matrices"00
ijðpÞin eq. (5), are defined by
"00ijð1Þ ¼
t 0 0
0 t 0
0 0 0
0 B @
1 C
A; "00ijð2Þ ¼
t 0 0
0 t 0
0 0 0
0 B @
1 C
A; and "00ijð3Þ ¼
0 0 0
0 0 0
0 0 0
0 B @
1 C
A: ð6Þ
The tetragonal distortion,t, of Ni2MnGa t-phase is calculated byt¼ ðctNi2MnGaa t
Ni2MnGaÞ=a c
Ni2MnGa, wherec t
Ni2MnGaand
atNi
2MnGa are lattice parameters for Ni2MnGa t-phase along c and a axes, respectively.a c
Ni2MnGa is the lattice parameter for
Ni2MnGa c-phase. The constrained strain,"cijðr;tÞ, is defined by"
c
ijðr;tÞ ""
c
ijðtÞ þ"
c
ijðr;tÞ, and""
c
ijðtÞis the spatial average of "cijðr;tÞ."cijðr;tÞ, deviation from""cijðtÞ, is given by
"cijðr;tÞ ¼
Z
k X3
p¼1
1
2
nimjðnÞmnc ðpÞnn þnjmiðnÞmnc ðpÞnn
Spðk;tÞ
( )
expðikrÞ dk
ð2Þ3; ð7Þ
whereilðnÞis the inverse matrix ofil1ðnÞ Cijklnjnkand ijðpÞis defined byijðpÞ Cijkl"00klðpÞ.kis the reciprocal
space vector andnk=jkjis unit vector alongkdirection.
Spðk;tÞis the Fourier transform ofspðr;tÞ field. The spatial
average of constrained strain,""c
ijðtÞ, is given by
H
H
H
=0
[image:2.595.53.283.73.180.2]
"
"cijðtÞ ¼Cijkl1klAþX
3
p¼1
"00ijðpÞsspðtÞ; ð8Þ
where sspðtÞ is the spatial average of spðr;tÞ. In evaluating
elastic strain energy, the elastic isotropy is assumed, so that the elastic constant Cijkl is reduced to Cijkl¼ijklþ ðikjlþiljkÞ, where and are the Lame´’s elastic
coefficients andij is Kronecker’s delta.
According to the theory of micromagnetics,17) the total magnetic energy is expressed by a sum of the Zeeman energy, exchange energy, magnetocrystalline anisotropy energy, magnetostriction energy, and stray field energy. In this calculation, we consider only magnetocrystalline aniso-tropy energy, because this energy will affect mainly on the variant rearrangement in the twin microstructure under external magnetic field. Therefore, the magnetic energy,
Emag, is given by
Emag¼Emagan ¼Ku Z
r
½1 fmðr;tÞ euanðr;tÞg2dr; ð9Þ
whereKu is the magnetocrystalline anisotropy coefficient17)
of t-phase, andmðr;tÞis the magnetic moment vector, which is a coarse grained field variable and generally expressed as a function of positionrand timet. In this study, we assumed
mðr;tÞ ¼ ð1;0;0Þ,i.e., the external magnetic field is applied along x-axis and all magnetic moment are turned parallel to the direction of external magnetic field. Since the unit vector,
euanðr;tÞ, means the orientation of c-axis of t-phase at
position r and time t, the vector euanðr;tÞis approximately
expressed as euanðr;tÞ ¼ ðs1ðr;tÞ; s2ðr;tÞ; s3ðr;tÞÞ using
or-der parameterspðr;tÞ, so the eq. (9) is rewritten as
Emag¼Ku Z
r
½1 fmðr;tÞ euanðr;tÞg2dr
¼Ku Z
r
f1s21ðr;tÞgdr; ð10Þ
2.2 The stochastic phase-field kinetic equation
The temporal evolution of the phase-field spðr;tÞ is
described by the stochastic phase-field kinetic equation which is the Langevin equation based on the TDGL kinetic equation:
@spðr;tÞ @t ¼
Ls
RT Gsys
spðr;tÞ
þðr;tÞ; ð11Þ
whereLsis kinetic coefficient matrix,Ris gas constant, andT
is absolute temperature.Gsysis a total free energy functional
defined by eq. (1) andðr;tÞis the Gaussian noise term. We assumedLs¼0:2with no dimension in this study, so timet
becomes also dimensionless. The thermodynamic potential field,Gsys=spin eq. (11), is calculated analytically through
the variation of Gsys with respect to sp. Numerical values
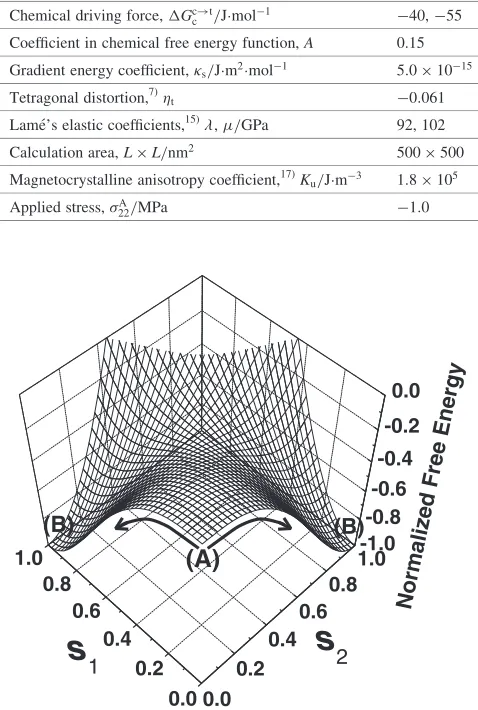
used for the calculation are summarized in Table 1.
Figure 2 shows the chemical free energy surface calculated using eq. (2), and the energy axis is normalized byGc!t. It is easy to visualize the phase transition path from c-phase to t-phase by using this free energy surface. The initial state of the single cubic phase corresponds to the energy level denoted by (A). The path of c!t phase transition is indicated
by the arrows pointing away from (A). From (A) to (B), there is very small energy barrier, therefore this phase transition is supposed as a weak first order structural phase transition. Since the value ofGc!tis assumed small in this study (see
Table 1), the calculation condition will correspond to the state where the supercooling from the martensitic trans-formation temperature is not so large.
3. Calculation Results and Discussion
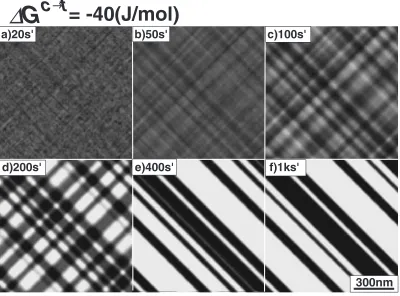
Figure 3 shows the calculated microstructure changes of the cubic!tetragonal structural phase transformation in Ni2MnGa during isothermal aging, where the final
equili-brium state is single t-phase and the chemical driving force for c!t phase transition is assumed to beGc!t¼ 40(J/
mol). This driving force seems to be relatively small compared to that for the normal martensitic transformation, because we supposed the calculation condition of aging temperature to be just below the c!t phase transition temperature. This calculation is performed on the 2-dimen-sional plane of (001). The initial condition of microstructure is a single c-phase and the brightness in the figure means the value of s21ðr;tÞ, so the white part is t1-phase (henceforth
[image:3.595.306.545.98.453.2]t-phase with variant number pis written as ‘‘tp-phase’’), and Table 1 Numerical values used for the calculation.
Temperature,T/K 200
Chemical driving force,Gc!t c /Jmol
1 40,55
Coefficient in chemical free energy function,A 0.15
Gradient energy coefficient,s/Jm2mol1 5:01015
Tetragonal distortion,7)t 0:061
Lame´’s elastic coefficients,15),/GPa 92, 102
Calculation area,LL/nm2 500500
Magnetocrystalline anisotropy coefficient,17)Ku/Jm3 1:8105
Applied stress,A
22/MPa 1:0
0.0 0.2
0.4 0.6
0.8 1.0
0.0 0.2 0.4 0.6 0.8
1.0 -1.0
-0.8 -0.6
-0.4 -0.2
0.0
s
1Normalized F
ree Energ
y
s
2(A)
(B)
(B)
black part corresponds to t2-phase. But only for Fig. 3(a),
c-phase is also included in the black part. Numerical values in the figure are dimension less aging time (time unit is described as s0 not s). At the initial stage of phase
trans-formation, the tweed like structure with h110i striation appears as shown in Figs. 3(a) and (b). From Figs. 3(c) to (e), t-phases domains grow gradually during aging, then lamellar shaped twin microstructure emerges (see Fig. 3(e)) and the straight twin domain with narrow width begins to shrink by twin boundary motion (see Fig. 3(f)). The morphological changes of the microstructure are in very good agreement with the martensitic transformation induced by weak first order structural phase transition that is observed, for instance, in Fe-Pd system18)experimentally.
Figure 4 shows the twin microstructure developments under external stress and magnetic fields. The microstructure of the Fig. 3(f) is employed as the initial condition for the simulation of Fig. 4, and the white and black parts in the figure correspond to t1-phase and t2-phase, respectively. The
microstructure changes from Figs. 4(a) to (c) demonstrate the twin domain growth with twin boundary motion under the condition of 1MPa compressive applied stress along vertical direction. It is recognized that the t2-phase (black part) is
preferentially growing up. Because the c-axis of the unit cell for t2-phase coincides with the direction along y-axis
(vertical direction) and the tetragonality of the t-phase, that is defined by ctNi
2MnGa=a t
Ni2MnGa, is less than unity, the
compressive force make t2-phase more stable. On the other
hand, the microstructure changes under external magnetic field along x-axis (horizontal direction) without applied stress are demonstrated from Figs. 4(c) to (f). In this case, the t1
-phase (white part) grows conversely. This is because t1-phase
has c-axis, that is the easy axis for magnetization, along the x-axis (horizontal direction), therefore, magnetic energy of the t1-phase is lower than that of t2-phase.
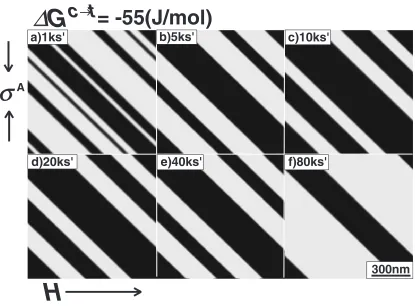
In comparison with the microstructure changes in Fig. 4 where the chemical driving force Gc!t
c ¼ 40 (J/mol),
Figure 5 shows the microstructure changes whenGc!t
c ¼
55 (J/mol). Other calculation conditions are the same as those of Fig. 4. The general feature of microstructure changes is similar to Fig. 4, however, the speed of twin boundary motion becomes slower. This phenomenon is explained energetically as follows:
Figure 6 is the same chemical free energy surface as Fig. 2. It is noted that there is energy barrier between the t1-phase
(s1¼1,s2¼0) and the t2-phase (s1¼0,s2¼1) as indicated
by arrow. When the twin boundary moves, the order parameter exchange, i.e., (s1¼1, s2¼0) $ (s1¼0,
s2¼1) should be accomplished. Therefore, during this
process, the t-phase has to overcome the chemical free energy barrier in Fig. 6. Since the height of energy barrier is proportional toGc!t, the larger the driving forceGc!t,
the smaller the mobility for twin boundary motion. Further-more, as the driving force for c!t phase transition,Gc!t
c ,
will be approximately proportional to the T that is the supercooling from c$t phase transition temperature (Ms), the twin boundary motion is thought to be restricted as the temperature decreases from the Ms point. The calculation results of Figs. 4 and 5 clearly indicate that the magnetically induced shape memory effect may easily occur when the experiment is performed just below the c$t phase transition temperature. This behavior agrees well with the experimental
a)20s'
b)50s'
c)100s'
300nm
e)400s'
f)1ks'
d)200s'
G
c t
∆
→= -40(J/mol)
[image:4.595.99.499.80.376.2]a)1ks'
b)5ks'
c)10ks'
300nm
e)40ks'
f)80ks'
d)20ks'
H
G
c t
∆
→
= -55(J/mol)
σ
A
Fig. 5 Twin microstructure changes under external stress and magnetic fields. In the case of the chemical driving forceGc!t c ¼ 55
(J/mol).
300nm
a)1ks'
b)5ks'
c)10ks'
e)40ks'
f)80ks'
d)20ks'
H
G
c t
→
∆
= -40(J/mol)
σ
A
Fig. 4 Twin microstructure changes under external stress and magnetic fields. In the case of the chemical driving forceGc!t c ¼ 40
[image:5.595.95.504.78.382.2] [image:5.595.93.508.451.757.2]results by Tsuchiya9)et al.
Finally we would like to emphasize that the calculation time required to finish the simulation took only a few minutes on a standard personal computer (1 GHz CPU or greater). Therefore, it is easy to carry out trial-and-error testing to understand the nature of microstructure developments on a personal computer by changing the boundary conditions such as applied stress, external magnetic field, tetragonal dis-tortion, chemical driving force. This method could be applicable to the modeling of microstructure changes for the same class of magnetically induced shape memory alloys.
4. Conclusions
We attempted to model the twin microstructure changes found in Ni2MnGa alloy under external stress and magnetic
fields using the phase-field method. The results obtained are as follows:
(1) We modeled the twin microstructure changes in Ni2
Mn-Ga using the phase-field method reasonably. It is quantita-tively proved that the twin boundary motion in Ni2MnGa is
sufficiently controlled by the applied stress and external magnetic field.
(2) This method could be applied to the modeling of microstructure changes for the same class of magnetically induced shape memory alloys.
(3) The mobility of twin boundary motion will be enhanced just below the c$t phase transition temperature.
Acknowledgements
This work was partly supported by a NEDO International Joint Research Grant on ‘‘Structuring Knowledge, Science and Technology for Nano Material Processing’’, and by the Special Coordination Funds for Promoting Science and Technology on ‘‘Nanohetero Metallic Materials’’ from the Ministry of Education, Culture, Sport, Science and Technol-ogy. This work was supported also by NAREGI Nanoscience Project, Ministry of Education, Culture, Sports, Science and Technology, Japan.
REFERENCES
1) T. Koyama: Materia Japan (Bull. of the Japan Inst. Metals)42(2003) 397-404.
2) T. Koyama, T. Kozakai and T. Miyazaki: Materia Japan (Bull. of the Japan Inst. Metals)38(1999) 624-628.
3) L.-Q. Chen: Annu. Rev. Mater. Res.32(2002) 113-140.
4) W. J. Boettinger, J. A. Warren, C. Beckermann, and A. Karma: Annu. Rev. Mater. Res.32(2002) 163-194.
5) M. Ode, S. G. Kim and T. Suzuki: ISIJ Int.41(2001) 1076-1082. 6) K. Ullakko, J. K. Huang, V. V. Kokorin and R. C. O’Handley: Scr.
Mater.36(1997) 1133-1138.
7) T. Kakeshita and K. Ullako: MRS Bull.27(2002) 105-109.
8) P. J. Webster, K. R. A. Ziebeck, S. L. Town and M. S. Peak: Philos.
Mag. B49(1984) 295-310.
9) K. Tsuchiya, A. Ohashi, D. Ohtoyo, H. Nakayama, M. Umemoto, and
P. McCormick: Mater. Trans., JIM41(2000) 938-942.
10) A. Artemev, Y. Wang and A. G. Khachaturyan: Acta Mater.48(2000)
2503-2518.
11) J. W. Cahn:The Selected Works of J. W. Cahn, ed. by W. C. Carter and W. C. Johnaon, (TMS, 1998) pp. 29-50.
12) J. E. Hilliard:Phase Transformation, ed. by H. I. Aaronson, (ASM,
Metals Park, Ohio, 1970) pp. 497-560.
13) A. G. Khachaturyan:Theory of Structural Transformations in Solis,
(Wiley and Sons, New York, 1983) pp. 198-212.
14) T. Mura:Micromechanics of Defects in Solids, 2nd Rev. Ed., (Kluwer Academic, 1991) pp. 204-218.
15) L. Manosa, A. G-Comas, E. Obrado, A. Planes, V. A. Chernenko, V. V. Kokorin and E. Cesari: Phys. Rev. B.55(1997) 11068-11071.
16) D. V. Berkov, K. Ramstock and A. Hubert: Phys. Status. Solidi.137
(1993) 207-225.
17) S. J. Murray, M. Marioni, S. M. Allen and R. C. O’Handly: Appl. Phys. Lett.77(2000) 886-888.
18) M. Sugiyama, R. Oshima and F. Fujita: Trans. JIM27(1986) 719-730. 0.0 0.2
0.40.6 0.81.0
0.0 0.2 0.4 0.6 0.8
1.0 -1.0
-0.8 -0.6 -0.4 -0.2 0.0
s
1
Normalized
Free Energy
s
2
[image:6.595.59.282.78.250.2]