The problem of non-uniform temperature distribution in microwave heated foods is known from practical use of microwave ovens and microwave technology applications and from the development of microwaveable food prod-ucts. The heating uniformity is important for reaching the desired quality of the food and also for controlling the safety of the heated product.
Many interacting factors influence the temperature dis-tribution in heated foods during microwave heating in-cluding the microwave heating mechanisms, the patterns of the microwave field created in the oven and the phys-ical parameters of heated food such as its thermo-physphys-ical and dielectric properties, its shape, volume, dimensions and its temperature. Because of complexity of their influence on the course of heating, the design of optimal process and
food parameters for microwave heating application presents a serious problem.
To understand the influence of each of the process or the product parameters on heating history and result of heating, many experiments and theoretical studies have been carried out until now and the related results can be found in many research reports, journals, conference pro-ceedings, etc.
In the experiments both the heating of different model foods or food analogues of certain chemical composition and the heating of multicomponent chilled or frozen food products were carried out at different specific process, product and equipment parameters (OHLSSON & BENGT
-SEN 1971; NYKVIST & DECAREAN 1976; TANG & LUNG
1989; BOWS & RICHARDSON 1990; BURFOOT et al. 1991;
This work was supported by the project of Ministry of Agriculture of the Czech Republic No. EP 6629 and No. EP 6260.
Temperature Profiles in Microwave Heated Solid Foods of Slab
Geometry: Influence of Process Parameters
JIØINA HOUOVÁ and KAREL HOKE
Food Research Institute Prague, Prague, Czech Republic
Abstract
HOUOVÁ J., HOKEK. (2001): Temperature profiles in microwave heated solid foods of slab geometry: Influence of process parameters. Czech J. Food Sci., 19: 111120.
A simple 1-D mathematical model for prediction of local temperatures in a layer of solid material during microwave heating (HOUŠOVÁ et al. 1998) and a sensitivity analysis were used to evaluate the influence of process and material parameters on vertical
temperature profiles in a layer of material during heating. The results of calculations are presented in graphs and discussed. The incident microwave power and heat capacity and density of heated material are parameters with great effect on all local and average temperatures and local and average heating rates. The shape of temperature profile is influenced only to a small extent by a change in the value of applied microwave power and also in the value of heat capacity or density of heated material. The whole profiles shift to higher or lower temperature values when the incident microwave power is changing. The distribution of applied micro-wave power between the upper and bottom layer surface very much influences the shape of the profile and the values and position of the highest and the lowest temperature in the layer. Depth of penetration and thermal conductivity of heated material influence on the shape of temperature profiles and the temperature spread in the layer (evenness of temperature distribution). Effect of penetration depth also depends on the relation to the layer thickness – its effect increases with the increasing layer thickness. At the low values of penetration depth relative to the layer thickness, an uneven temperature profile is to be expected. Effect of thermal conductivity value on temperature profile depends on the time of heating. Because of a short time of microwave heating, the effect of this parameter on temperature distribution is smaller compared to the conventional heating methods. At the beginning of heating its influence is quite negligible. Temperature of the air surrounding the layer and intensity of heat exchange between the air and layer surface are parameters with only small local effect on temperature distribution.
PROSETYA & DATTA 1991; RAMASWAMY & PILLET 1992, ANANTHESWARAN & LIN 1994; HOUŠOVÁ et al. 1994; HOUŠOVÁ & HOKE 1995; PONNE 1998). The local temper-atures in heated material or product were monitored in these studies to evaluate the influence of temperature dis-tribution and local heating rates on the final quality of heated food.
The mathematical simulation of a microwave heating process – as another way how to understand the interac-tion of microwave energy with the food – has been per-formed to predict the temperature distribution in a heated body of simple geometry (cylinder, sphere, slab) during heating. Different simple or more complex mathematical mod-els of microwave heating have been published until now. In each of these models different assumptions and simplifica-tions have been made for the process description and for solution of related energy equations. In the relatively sim-ple models, Lambert’s Law is used for description of micro-wave power attenuation in heated material. The more complex models are based on Maxwell’s wave equations and their numerical solution. The finite differences or the finite elements methods are used for numerical calculation of differential energy equations in the models. More de-tails see e.g. the review of AYAPP (1991).
The analytical solutions of equations, leading to de-scription of transient or spatial temperature profiles in the microwave heated bodies of simple geometry were also published (DOLANDE & DATTA l993; CHEN 1998). In these studies some assumptions and simplifications were made for the heating process description.
A relatively simple model for prediction of local temper-atures in the slab-shaped solids (layer of solid foods) during microwave heating has been developed in this in-stitute, too. At the heating of the layer of solid material, the knowledge of vertical temperature distribution – across
the layer – is important. The model based on Lambert’s Law was developed with the aim to better understand the influence of particular microwave heating parameters on the course and results of heating and to facilitate the mi-crowaveable food product design. Most food products for microwave heating (namely ready meals) are packed and reheated in flat trays. More detailed information on the model and related computer programme SLAB see HOUŠOVÁ et al. (1998).
A sensitivity analysis was used to evaluate the sensi-tivity of the model to a change in various input parame-ters and to estimate the level of care necessary for use of different input parameter values at model calculations. Sen-sitivity of the model was evaluated for the points of the layer that are important in view of quality or safety of heat-ed foods (centre of the layer and upper or bottom surfaces of the layer). Certain combinations of process and product parameters were supposed at these calculations. Results for the centre of the layer of two thicknesses are shown in Figs. 1 and 2. Both figures show how the percent change in the values of all main process and product parameters in-fluences the change in the centre temperature.
The microwave power (the value of power flux is used in the computer programme) as the main process parame-ter and heat capacity and density of heated maparame-terial are the parameters of large influence on the value of both the centre and surface temperatures. The air temperature near the surface of the layer and the value of heat transfer coefficient between air and layer’s surface are the pro-cess parameters with minor influence on temperature in the centre of the layer. The influence of others physical parameters of heated material – thermal conductivity and depth of microwave penetration – on changes in centre and surface temperatures depends on the layer thickness and it changes with the place (centre, surface).
-20 -15 -10 -5 0 5 10 15 20
50 60 70 80 90 100 110 120 130 140 [%] 150 [°C]
P Dp k ro,cp Tu Tb hu hb
Tnom 45.2°C Fig. 1. Effect of change in the
values of input parameters [%] for microwave heating model calculation on changes in the centre of layer temperature [°C] Layer of 10 mm, both-side heating, Dp of 12 mm, 2nd
min of heating
6500 W/m2
6500 W/m2
point 2
!
6500 W/m2
point 2 6500 W/m2
In this study, sensitivity analysis and computer pro-gramme SLAB have been used to estimate the influence of individual process and product parameters on the whole temperature profiles in the heated layer of solids. Results of these calculations are given in this paper.
METHODOLOGY
In the sensitivity analysis, the response of the change in one of the input parameters on the change in calculated values is estimated.
The set-up of all input parameters for a microwave heat-ing model usheat-ing computer programme SLAB is given in Table 1 together with their nominal values. Using this
pro-gramme, the values of local temperatures across the layer of heated material at different time of heating are calculat-ed. The calculations were made for 20 or more points in the layer. At the calculations, the values of individual parameters were varied at steps by 10% over the range of –50 to +50% of their nominal values. During variations of one parameter, the others were kept constant. The calcu-lations were provided for different combinations of pro-cess/product parameters.
The heating of the layer from both sides with the same or different surface power flux (W/m2) and the layer
thick-ness of 10, 20, 30, or 40 mm were supposed along with the depth of penetration of the heated layer 12 or 6 mm. A change in the temperature profile at heating of the layer
Table 1 Set-up of input parameters for microwave model calculations using computer programme SLAB. Nominal values of parameters for sensitivity analysis calculation
Parameter Symbol Dimension Nominal values used at calculation
MW power flux PW.m2 13 000 13 000
upper surface Pu W.m2 0, 3 250, 6 500, 9 750, 13 000 6 500
bottom surface Pb W.m2 13 000, 9 750, 65 00, 3 250, 0 6 500
Thickness of layer H mm 10, 20, 30, 40 20
Depth of penetration Dp mm 12 5
Density ro kg.m3 1035 1 020
Heat capacity cp J.kg1.°C1 3800 3 880
Thermal conductivity k W.m1.°C1 0.6 0.62
Air temperature at upper surface Tu °C 30 30
at bottom surface Tb °C 30 30
Surface heat transfer coefficient upper hu W.m2.°C1 20 20
bottom hb W.m2.°C1 20 20
Fig. 2. Effect of change in the values of input param-eters [%] for microwave heating model calculation on changes in the centre of layer temperature [°C]. Layer of 30 mm, both-side heating, Dp of 12 mm, 2nd
min of heating
-6 -4 -2 0 2 4 6
[%] [°C]
P Dp k ro,cp Tu Tb hu hb
Tnom 16.0°C
50 60 70 80 90 100 110 120 130 140 150
6500 W/m2
6500 W/m2
point 2
!
6500 W/m2
point 2 6500 W/m2
only from its upper surface was also calculated. Most calculations were provided for the second minute of heat-ing, but the change in the temperature profiles with time of heating was followed, too.
RESULTS AND DISCUSSION
The influence of change in the value of individual pro-cess and product parameters on changes in the vertical temperature profile in the layer is shown in Figs. 3–13.
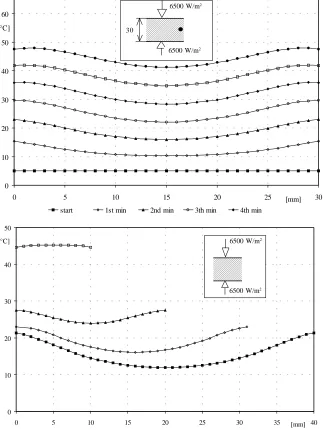
[image:4.595.60.383.318.748.2]Temperature Profile and Time of Heating
Fig. 3 shows the change of temperature profile in the layer of material of 30 mm thickness with the time of heat-ing. The both-side heating of the layer, the same values of power flux on both surfaces and material of 12 mm Dp are supposed. The graph illustratues, that not only the
aver-age temperature of the layer but also the unevenness of the temperature profile increases with the time of heating. As a result of heating conditions, the temperature pro-files are symmetrical with the lowest temperature (Tmin) at the centre of the slab and the highest temperature (Tmax) on the surfaces (at the beginning of heating) or at the same distance under the surface. As a result of surface cooling (convective heat exchange between the air and the surfaces of the layer or evaporative cooling) the tem-perature peak occurs near the surface and migrates in-ward as the heating continues.
Similar changes in the type of temperature profile in a layer of solid during microwave heating were identified using an analytical solution to the energy equation (DO
-LANDE & DATTA 1993). Three distinct types of profiles for different heating periods were described in this paper: initially – the concave up profile without visible peak, for
0 10 20 30 40 50 60
0 5 10 15 20 25 [mm] 30
[°C]
start 1st min 2nd min 3th min 4th min
Fig. 3. Changes in temperature pro-file in a layer of 30 mm during mi-crowave heating. Both-side heating, Dp of 12 mm
Fig. 4. Temperature profile in a layer of different thickness. Both-side heating, Dp of 12 mm, 2nd min
of heating 0
10 20 30 40 50
0 5 10 15 20 25 30 35 [mm] 40
[°C]
layer 40 mm layer 30 mm layer 20 mm layer 10 mm 6500 W/m2
6500 W/m2 6500 W/m2
6500 W/m2 6500
6500
30
6500 W/m2
10 15 20 25 30 35 40 45
0 5 10 15 [mm] 20
[°C]
50% 60% 70% 80% 90% 100% 110% 120% 130% 140% 150%
the intermediate heating period – the profile with internal-ly developed temperature peak, and for a very long time of heating – the concave down profile. The influence of the penetration depth relative to the dimension of the lay-er on the type of profile is discussed, too.
Temperature Profile and Layer Thickness
The influence of layer thickness on vertical tempera-ture distribution is shown in Fig. 4. The temperatempera-ture pro-file was calculated for material with depth of penetration 12 mm and the second minute of both-side heating with the same surface power flux 6500 W/m2. It is evident from
this figure that the shape of the profiles and local values of temperatures in the layer are very much influenced by
the thickness of the layer compared to the value of pene-tration depth.
For the small layer thickness or similar values of thick-ness and penetration depth, the temperature profile is flat or nearly flat (without temperature peak) and the rate of heating is high. As the thickness of the layer is increas-ing, the local rates of heatincreas-ing, and the maximal, minimal and average temperatures of the layer are decreasing, but the spread of local temperature values increases.
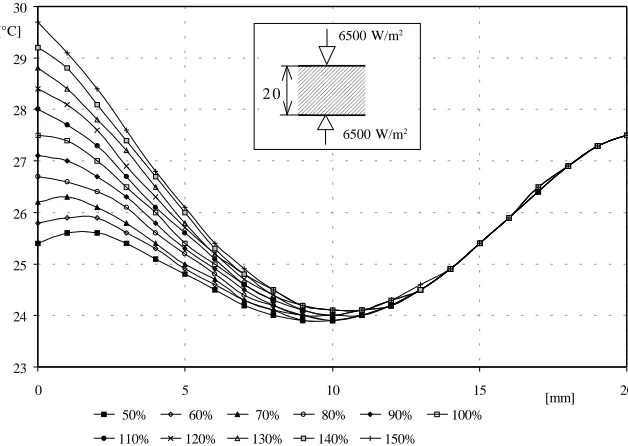
Applied Microwave Power and Temperature Profile in the Layer
The influence of microwave power on the temperature profile in the layer of different depths of penetration is
10 20 30 40 50
0 5 10 15 [mm] 20
[°C]
50% 60% 70% 80% 90% 100% 110% 120% 130% 140% 150%
Fig. 5. Changes in temperature profile in a layer of 20mm thickness at per-cent change in MW power flux value. Both-side heating, Dp of 12 mm, 2nd
min of heating. Nominal value of power flux on (upper as well as bottom) sur-faces 6500 W/m2
Fig. 6. Changes in temperature pro-file in a layer of 20mm thickness at percent change in MW power flux value. Both-side heating, Dp of 5 mm, 2nd min of heating. Nominal value of
power flux on (upper as well as bot-tom) surfaces 6500 W/m2
6500 W/m2
6500 W/m2
6500 W/m2
6500 W/m2
2 0
6500 W/m2
6500 W/m2
6500 W/m2
6500 W/m2
shown in Fig. 5 (penetration depth of 12 mm) and Fig. 6 (penetration depth of 6 mm).
It is obvious from these graphs that an increase and/or a decrease in the microwave power value shifts the whole profile to higher and/or lower temperature values, but it has only a small influence on the shape of the profile. As the microwave power increases, the local temperatures and the average temperature in the layer also increase and the layer reaches the higher average temperature in a shorter time period. The increase in the rate of heating in all spatial locations of the layer was evaluated from the analytical solution by DOLANDE and DATTA (1993).
A minor deformation of temperature profile with change in the microwave power value is seen in Fig. 6. At the
heating of the material with low value of the depth of penetration relative to the thickness of layer, the surface overheating of the layer (at the depth of penetration) oc-curs. With increase in the microwave power, this over-heating on the layer surface is more intensive.
Influence of Physical Properties of Heated Material
The large effect on temperature distribution in the layer is also exerted by a change in material density and heat capacity values (Fig. 7) (layer of 30 mm and depth of pen-etration 12 mm).
The change in both material properties shifts the whole temperature profile to higher (decrease in density and heat capacity) or to lower values (increase in density and heat
Fig. 7. Effect of changes in heat capa-city and density values on changes in temperature profile in a layer of 30 mm. Both-side heating, Dp of 12 mm, 2nd min of heating. Nominal
values of heat capacity and density: 3800 J.kg1.°C1, 1035 kg.m3
10 15 20 25 30 35
0 5 10 15 20 25 [mm] 30
[°C]
70% 80% 90% 100% 110% 120% 130% 140% 150%
44.2 44.7 45.2 45.7 46.2
0 2 4 6 8 [mm] 10
[°C]
50% 60% 70% 80% 90% 100%
110% 120% 130% 140% 150%
Fig. 8. Effect of changes in depth of penetration (nominal value of 12 mm) on changes in temperature profile. Layer of 10 mm, both-side heating, 2nd
min of heating
6500
6500
30
6500 W/m2
6500 W/m2
6500
6500 1 0
6500 W/m2
12 14 16 18 20 22 24 26 28
0 5 10 15 20 25 [mm] 30
[°C]
50% 60% 70% 80% 90% 100% 110% 120% 130% 140% 150%
capacity) and influences the average temperature of the layer. The shape of the profiles is deformed only to a small extent by the change in values of these parameters of heated material.
The influence of the value of penetration depth on tem-perature profiles in the layer depends on layer thickness (Figs. 8 and 9). If the layer thickness is high relative to the depth of penetration, a very uneven profile is developing with the highest temperature at or near the surface. The effect of the depth of penetration change on the tempera-ture distribution is large. The change in the depth of pen-etration value (decrease or increase) influences in these cases the shape of the profile and the values of the high-est and lowhigh-est temperatures and their difference. The av-erage temperature of the layer is influenced by the change
in the depth of penetration only a little. When the depth of penetration is decreasing, the highest local tempera-ture (at or near the surface layer) is increasing but the lowest temperature (at the centre of the layer) decreases and vice versa. A decrease in the depth of penetration value has a larger effect on the change in temperature profiles than an increase in this value.
The proper balance of the material layer thickness com-pared to its dielectric properties is of large importance to avoid uneven heating of the layer.
The same influence of the penetration depth values on the type of profiles is reported by DOLANDE and DATTA
(1993).
The influence of a change in material thermal conduc-tivity on the temperature profile in the layer is shown in
Fig. 9. Effect of changes in depth of penetration (nominal value of 12 mm) on changes in tempera-ture profile. Layer of 30 mm, both-side heating, 2nd min of
heating
Fig. 10. Effect of changes in ther-mal conductivity (nominal value of 0.6 W.m1.°C1) on changes in
tem-perature profile. Layer of 30 mm, Dp of 12 mm, both-side heating, 2nd min of heating
23 24 25 26 27 28 29
0 5 10 15 [mm] 20
[°C]
50% 60% 70% 80% 90% 100% 110% 120% 130% 140% 150%
6500 W/m2
6500 W/m2
6500 W/m2
6500 W/m2
2 0
6500
6500 W
30
6500 W/m2
Fig. 10. The effect of this parameter is relatively small because of a short time of heating. By any change in the value of thermal conductivity, the shape of the whole pro-file and the temperature distribution in the layer are al-tered only a little. When thermal conductivity is increasing, the temperature profiles are a little flatter, and the differ-ence between the highest and the lowest temperatures in the layer is becoming lower. For a long time of heating the influence of the thermal conductivity value on tempera-ture distribution in the layer is a little more pronounced. At the beginning of heating, the influence of this material property on temperature distribution is negligible.
23 24 25 26 27 28 29 30
0 5 10 15 20
[mm] [°C]
50% 60% 70% 80% 90% 100% 110% 120% 130% 140% 150%
Fig.11. Effect of change in air tem-perature at upper surface of layer (nominal value of 30°C) on change in temperature profile. Layer of 20 mm, Dp of 12 mm, both-side heating, 2nd min of heating
Fig. 12. Effect of changes in heat transfer coefficients at the upper surface of layer (nominal value of 20 W.m2.°C1) on temperature
profile. Layer of 20 mm, Dp of 12 mm, 2nd min of heating,
both-side heating 23
24 25 26 27 28 29
0 5 10 15 [mm] 20
[°C]
50% 60% 70% 80% 90% 100% 110% 120% 130% 140% 150%
Surface Heat Exchange and the Temperature Profile
In Fig. 11, the influence of the temperature of the air surrounding the heated layer on the temperature profile is shown. It is evident from the graph that a change in the air temperature influences only local temperatures near the related surface of layer. At the beginning of heating, the air temperature is a little higher compared to the tempera-ture of heated material and surface heating occurs. As the heating continues, the air temperature is lower relative to the temperature of the surface layer. The surface cooling occurs and the temperature peak in the profile (several mm under surface layer) is visible.
6500 W/m2
6500 W/m2
6500 W/m2
6500 W/m2
2 0
6500 W/m2
6500 W/m2
6500 W/m2
6500 W/m2
The change in air temperature in the oven has a very small influence on the centre and average layer tempera-ture.
The value of surface heat transfer coefficient (SHTC) influences slightly only local temperatures near the layer surface (Fig. 12.) but this effect also depends on the air temperature (on the period of heating). If the air tempera-ture in the oven is higher than the temperatempera-ture of heated material (initial period of heating), the temperature of the layer surface increases with the increasing of SHTC value. As the heating continues, the effect of the change in SHTC value is reverse, but the influence of SHTC value on the centre and on the average temperatures is negligible.
CONCLUSION
1. Temperature distribution in a layer of microwave heat-ed material (temperature profile) is influencheat-ed by a num-ber of interacting process and materials parameters. The temperature profile is changing also with the time of heat-ing.
2. Applied microwave power and density and heat ca-pacity of heated material are parameters with the greatest influence on the average rate of heating and average tem-perature of layers. The change in values of these parame-ters affects the values of all local temperatures and shifts the whole profiles to higher or lower temperature values. Influence of these parameters on a change in the shape of profiles is relative small.
3. The temperature profile in the layer is influenced to a great extent by the distribution of incident microwave power between a upper and bottom surfaces of the layer. At uneven distribution of microwave power, the symme-try of the temperature profile is missing (Fig. 13). The position of the lowest local temperature in the layer
(im-Fig. 13. Effect of distribution of ap-plied microwave power between up-per and bottom surfaces on vertical temperature distribution in a layer. Layer of 30 mm, Dp of 12 mm, 2nd
min of heating. Both-side heating at uniform (50%/50%) and non-uni-form (75%/25% and 25%/75%) power flux distribution between upper and bottom surfaces. One-side heating from upper surface (100%/ 0%) or bottom surface (0%/100%)
10 15 20 25 30 35
0 5 10 15 20 25 [mm] 30
[°C]
100/0 75/25 50/50 25/75 0/100
portant for food safety controlling) is moving in the direc-tion of the surface with lower power flux value.
4. Depth of penetration into the material has the influ-ence on the shape of the temperature profile but the ex-tent of this influence depends on its relation to the layer thickness. The change in Dp value influences the temper-ature spread and difference in the layer and therefore the evenness of the profile (evenness of heating).
5. In microwave heating, the influence of thermal con-ductivity of heated material is smaller in comparison to the conventional heating methods because of a short time of heating. Positive influence on the flattening of the tem-perature profile in the layer can be supposed only at a long time of heating. At the beginning of heating, the influence of this parameter on heating mechanisms is in-significant.
6. Parameters influencing the heat exchange between the surrounding air and the layer surface (air temperature, coefficient of convection heat transfer) have only a small local effect on the profile. Their influence on average tem-perature of the layer and heating rate is quite insignifi-cant.
7. For evenness of heating of slab-shaped solid foods, a proper balance between the values of applied micro-wave power, material properties and the layer thickness is of great importance.
R e f e r e n c e s
ANANTHESWAREN R.C., LIN L. (1994): Effect of viscosity and salt concentration on microwave heating of model non-newtonian liquid foods in a cylindrical container. Int. Micro-wave Power Inst., 29: 119126.
AYAPP K.G., DAVIS H.T., CRAPISTEE G., DAVIS A.E., GOR
-DON J. (1991): Microwave heating: An evaluation of power formulation. Chem. Eng. Sci., 46: 10051016.
6500 W/m2
6500 W/m2
A W/m2
B W/m2
BOWS J.R., RICHARDSON P.S. (1990): Effect of component configuration and packaging materials on microwave reheat-ing a frozen three-component meal. Int. J. Food. Sci. Technol.,
25: 538550.
BURFOOT D., JAMES S.J., FOSTER A.M., SELF K.P., WILKINS T.J., PHILIPS I. (1991): Temperature uniformity after reheating in domestic microwave ovens. In: Proc. Proc-ess Engineering in the Food Industry Conf., Elsevier Appl. Sci.
DOLANDE J., DATTA A. (1993): Temperatures profiles in microwave heating of solids: a systematic study. J. Micro-wave Power Elgm. Energy, 28: 5866.
CHEN X.D. (1998): Microwave heating of an infinite slab and its thermal stability analysis. J. Food Eng, 35: 339349. HOUOVÁ J., HOKE K., TOPINKA P. (1994): Distribution
and profiles of local temperatures in homogeneous materials during microwave heating. Potrav. Vìdy, 12: 393406. HOUOVÁ J., HOKE K. (1995): Microwave heating of
hetero-geneous food product heating rate and temperature uni-formity. Potrav. Vìdy, 13: 111129.
Souhrn
HOUOVÁJ., HOKEK. (2001): Telotní profily ve vrstvì tuhých potravin pøi mikrovlnném ohøevu: Vliv parametrù ohøevu.
Czech J. Food Sci., 19: 111120.
Analýza citlivosti a 1-D matematický model pro teoretickou predikci lokálních teplot ve vrstvì tuhého materiálu bìhem mikrovlnného ohøevu (HOUOVÁ et al. 1998) byly pouity pro ilustrativní testování úèinku jednotlivých procesních a materiálových parametrù
na vertikální rozloení teplot ve vrstvì. Pouitý matematický model je zaloen na Lambertovì zákonì popisujícím lokální útlum výkonu mikrovln pøi prùchodu vrstvou. Nominální hodnoty testovaných parametrù odpovídají modelovým experimentùm s mikrovlnným ohøevem bramborové kae a masové ávy. Modelovými výpoèty byl testován vliv aplikovaného mikrovlnného výkonu pøipadajícího na jednotku horního i spodního povrchu vrstvy, dále tepelnì-fyzikálních a dielektrických vlastností materiálu, tlouky vrstvy a parametrù ovlivòujících výmìnu tepla mezi povrchem vrstvy a okolím. Byl sledován i èasový vývoj teplotního profilu. Výsledky výpoètù jsou prezentovány graficky. Vliv sledovaných parametrù na teplotní profil ve vrstvì materiálu je rozdílný, u nìkterých parametrù se projevila vzájemná závislost. Mikrovlnný výkon, hustota a mìrná tepelná kapacita materiálu jsou parametry s nejvìtím vlivem na vechny lokální teploty, prùmìrnou teplotu a prùmìrnou rychlost ohøevu. Vliv penetraèní hloubky (dielektrických vlastností) je vázán na její vztah k tlouce vrstvy. Pøi velkém pomìru tlouky vrstvy a penetraèní hloubky je teplotní profil velmi nerovnomìrný s velkým rozpìtím maximální a minimální teploty (výrazné pøehøívání povrchové vrstvy, velmi pomalé prohøívání blízko støedu). Vliv tepelné vodivosti materiálu na teplotní profil ve vrstvì je pøi mikrovlnném ohøevu velmi malý vzhledem k jeho krátké dobì. Teplota okolního vzduchu a intenzita vnìjí výmìny tepla mají v podstatì nevýznamný vliv na teplotní profil, jejich zmìna se v malé míøe projeví pouze bezprostøednì u povrchu vrstvy. Teplotní profil je výraznì ovlivnìn hodnotami mikrovlnného výkonu pro horní a spodní povrch vrstvy, tedy vertikálním rozloením intenzity mikrovlnného pole v dutinì zaøízení, pøípadnì odstínìním nìkterého z povrchù vrstvy.
Klíèová slova: mikrovlnný ohøev; rozloení teplot; teplotní profil
Corresponding author:
Ing. JIØINA HOUOVÁ, CSc., Výzkumný ústav potravináøský Praha, Radiová 7, 102 31 Praha 10-Hostivaø, Èeská republika, tel.: + 420 2 72 70 23 31, fax: + 420 2 72 70 19 83, e-mail: [email protected]
HOUOVÁ J., HOKE J., TOPINKA P. (1998): Temperature distribution in layer of food heated by microwaves. Czech J. Food Sci., 16: 179188.
NYKVIST W.E., DECAREAU R.V. (1976): Microwave meat roasting. J. Microwave Power, 11: 324.
OHLSSON T., BENGTSSON N. (1971): Microwave heating pro-files in foods. Microwave Energy Appl. Newsl., 4: 18. PONNE C.T. (1996): Interaction of electromagnetic energy with
vegetable food constituents. [Dissertation.] Eindhoven Uni-versity of Technology, Eindhoven.
PROSETYA H., DATTA A. (1991): Batch microwave heat-ing: an experimental study. Int. Microwave Power Inst., 26: 2l5226.
RAMASWAMY H.S., PILLET-WILL T. (1992): Temperature distribution in microwave heated food models. J. Food Quality, 15: 445438.
TONG C.H., LUND D.B. (1989): Modelling thermal and mois-ture profiles in foods during microwave heating. In: Proc. MW Foods 89 Conf., Chicago.