The supplementing of wheat flour with enzyme preparations containing amylases, proteinases and lipoxygenase has been widely adopted in mills and bakeries. While the three enzymes are present in sound wheat, they normally occur in levels insuf-ficient to produce optimal technological effects. In milling sound, mature wheat these enzyme are retained in low levels and the flour is fortified with controlled amounts of enzyme (R��� 1975).
Since wheat flour contains an adequate amount of native β-amylase, the supplementation of flour with amylase aims at an increase in α-amylase activity. Originally, malted barley flour was used to this aim, than it was replaced by malted wheat flour and recently by fungal α-amylase.
Malt flours are relatively rich sources of mal-tose, minerals, soluble proteins, amylolytic and
proteolytic enzymes, and flavour substances, which promote vigorous yeast activity, accelerate dough conditioning and contribute a distinctive flavour and aroma to the baked product (F����� 1985). The principal functional benefits of the malt addition include an increased gas production in the dough, an improved crust colour formation, a better crumb moisture retention, and an enhanced flavour development.
Malt α-amylases acting on damaged starch gran-ules rectify the deficiency of fermentable sugar which is necessary for optimal yeast growth and gas production (P���� et al. 1994).
According to P���� (1988), malt syrup used at a level of 0.5%, can provide the following benefits: – supply preformed sugars, soluble proteins and
mineral salts, promote yeast activity,
Effect of Malt Flour Addition on the Rheological Properties
of Wheat Fermented Dough
M���� HRUŠKOVÁ, I��� ŠVEC and I�� KUČEROVÁ
Department of Carbohydrate Chemistry and Technology, Institute of Chemical Technology, Prague, Czech Republic
Abstract
H������� M., Š��� I., K������� I. (2003): Effect of malt flour addition on the rheological properties of wheat fermented dough. Czech J. Food Sci., 21: 210–218.
The bread-making quality of forty three wheat flour samples, divided into two groups according to the ash content (up to 0.6% and 0.7%), and its changes by fortification with malt flour were studied in the form of fer-mented dough. Standard analytical measurements (ash and protein contents, wet gluten, falling number, Zeleny sedimentation value), rheological investigations (amylograph, maturograph, oven rise recorder), and laboratory baking test were used for the characterisation of flour and dough. The influence of the malt flour addition on the fermented dough behaviour depends on the flour composition and was found more significant in flours with a lower ash content (“bright” type). Amylograph characteristics of flour-water suspensions were affected in the same extent by the malt addition. Maturograph behaviour changed significantly only in proofing stability (without influence by the flour type) and dough firmness was affected by malt only in the case of flours with lower ash contents. Oven rise characteristics of dough and the specific bread volume showed important changes in both sets of samples with significant differences between flours with lower and higher ash contents. A strong correlation (r = 0.62–0.75) significant at 0.01 level exists between the specific bread volume and all oven rise parameters of dough from both sets of samples.
– adds moderate proteolytic activity to the dough that assists in dough conditioning and gluten development during fermentation,
– insure maltose formation from susceptible starch after heat inactivation of the yeast in the oven, thus improving the loaf of bread, grain and tex-ture, and crust colour,
– increase the moisture-retaining properties of the finished product, thus enhancing freshness and keeping quality,
– compensate the inhibitory effect of milk solids which retards the amylolytic action and increases the dough fermentation requirements when added at the 6% level,
– reduce the potential for buckiness, wildness or sticki-ness in dough without lowering absorption. The influence of malt flour (addition 0.2–0.5%) on the rheological characteristics depends on its diastatic power and flour quality. Effects were usu-ally found (S����� & T����� 2000; P���� 1988; P������� 1971) in:
– changes of water absorption and dough consist-ence during farinograph kneading,
– increase of dough stickiness and decrease of tolerance against overmixing in farinograph, – decrease of amylograph maximum and
tempera-ture of the beginning of gelatinisation,
– decrease of elasticity and increase of extensibility in extensigraph or alveograph,
– increase of dough stability and elasticity in maturograph,
– increase of dough volume in oven spring ap-paratus,
– increase of bread volume,
– changes of bread shape and sensorical charac-teristics,
– increase of bread freshness during storage test. The objective of this study was to describe the improving effect of malt flour on the rheological properties of full dough system during the proof-ing, the oven spring and the baking process.
MATERIALS AND METHODS
Forty three samples of wheat flour divided into two groups according to the ash contents were taken from a commercial mill during five month (harvest 2001). The first set contained twenty flour samples with maximum 0.60% ash content, and the second set with maximum 0.70% ash content. The effect of the malted wheat flour (with diastatic power 223 U) was evaluated by the addition of 0.5% per the flour weight.
The analytical flour quality was determined ac-cording to the Czech standard methods (ash con-tent, wet gluten, protein content – ČSN 560512, Falling Number – ČSN ISO 3093 and Zeleny value – ČSN ISO 5529).
The rheological properties of flour were evalu-ated by means of amylograph according ICC 126 (Brabender, Germany), maturograph (Brabender, Germany), and oven rise recorder (Brabender, Germany) according to the producer recommen-dations.
[image:2.595.62.538.594.752.2]The baking test was performed according to the Czech method and the protocol used was: flour 100%, compressed yeast 4%, salt 1.7%, sugar 1.5%, fat 1%, and water necessary for optimal consistency 600 BU (Brabender unit). The dough from 300 g of flour was prepared in farinograph (Brabender, Germany). Dough dividing and roll shaping were made by hand and after the standard proofing
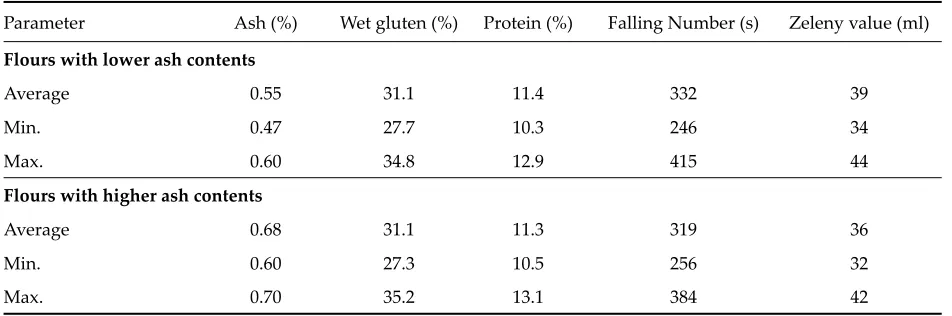
Table 1. Average values of flour analytical parameters
Parameter Ash (%) Wet gluten (%) Protein (%) Falling Number (s) Zeleny value (ml)
Flours with lower ash contents
Average 0.55 31.1 11.4 332 39
Min. 0.47 27.7 10.3 246 34
Max. 0.60 34.8 12.9 415 44
Flours with higher ash contents
Average 0.68 31.1 11.3 319 36
Min. 0.60 27.3 10.5 256 32
time, the pieces of dough were baked at 240°C for 14 min. Bread volume was determined after two hours of cooling by means of rape seeds.
The parameters of wheat flour quality and the results of amylograph, maturograph, oven rise recorder, and the baking test evaluation for each set without and with fortification with malt flour are presented by average, minimum, and maxi-mum values. The dependence between rheological parameters of dough (according to maturograph and oven rise recorder results) and the results of the baking test were evaluated using correlation analysis.
RESULTS AND DISCUSSION
Flour quality parameters as determined by the standard methods are shown in Table 1. Analytical characteristics of both sample sets are very similar except for the ash content and Zeleny sedimentation value. For the production of rolls and buns, flours with lower ash contents (Czech name “bright sort”) and higher protein quality are usually used, while for bread products flours with higher ash contents (Czech name “semi-bright sort”) are more suitable. Average values of flour analytical parameters were typical for the Czech wheat production environment (protein 10.3–13.1%, FN 246–415 s, Zeleny value 32–44 ml). The flour samples tested appeared to be suitable for the standard manufacture of yeast leavened dough in an industrial bakery accord-ing to these characteristics, but the specific bread volume and shape ratio (Table 4) were found only on the average. A conditioning agent such as malt
flour can improve both dough technological char-acteristics and final products.
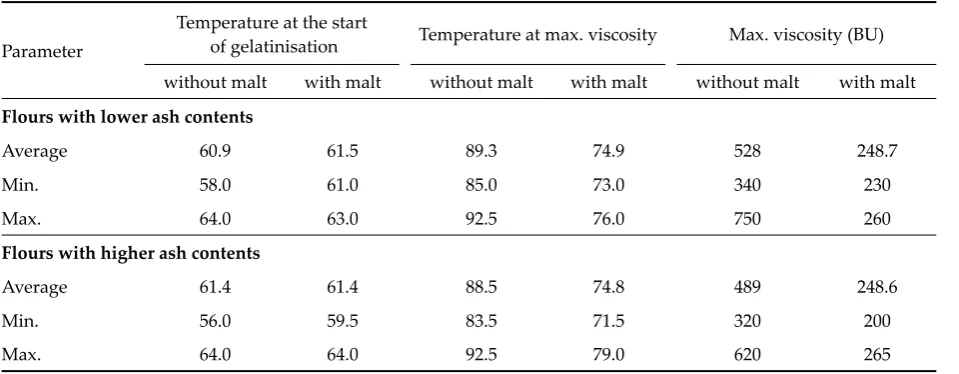
The amylograph records the gelatinisation proper-ties of flour–water suspension during heating and the maximum viscosity attained during the test is the results of both the α-amylase activity and the gelatinisation behaviour of flour. The evaluation of amylogram which expresses the flour suspen-sion behaviour without and with malt addition is given in Table 2. Amylograph quality of different flour sets was indicated by the maximum viscosity which is significantly higher in the case of samples with lower ash contents. Malt addition caused in both sets of flour a decrease of maximum viscosity and temperature at this stage in nearly the same extent.
[image:3.595.63.543.565.752.2]The maturograph records the fermentation behaviour of the dough after the proofing time by means of a sensing probe which touches the dough surface. With the help of an additional load-ing on this probe, which occurs periodically, the elasticity of the fermented dough is recorded. This cycle is repeated every 2 min which produces the typical zigzag form of the maturogram. The curve rises until maximum dough maturity is reached and drops thereafter. This action is recorded in maturograph units (MU) on the strip-chart. The evaluation of maturograms which express dough behaviour without and with malt addition dur-ing the proof period is given in Table 3. Proofdur-ing time was found to be in a similar range for both sets (range 36–48 min and 32–44 min), and after malt addition unimportant changes occurred in both sets of flours. The dough level describing the
Table 2. Average values of amylograph evaluation
Parameter
Temperature at the start
of gelatinisation Temperature at max. viscosity Max. viscosity (BU) without malt with malt without malt with malt without malt with malt
Flours with lower ash contents
Average 60.9 61.5 89.3 74.9 528 248.7
Min. 58.0 61.0 85.0 73.0 340 230
Max. 64.0 63.0 92.5 76.0 750 260
Flours with higher ash contents
Average 61.4 61.4 88.5 74.8 489 248.6
Min. 56.0 59.5 83.5 71.5 320 200
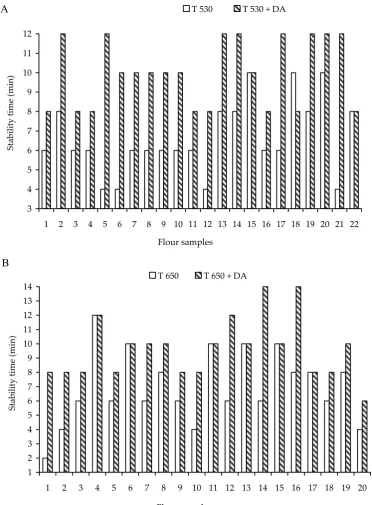
dough resistance against mechanical stress was slightly higher in the case of flours with lower ash contents and with malt fortification it increased significantly in both sets (about 18 MU or 21 MU). The dough firmness (expressed as elasticity) of fermented dough from both sets of flour was similar and was increased by malt addition, in the same range (approximately about 2%). Proof-ing stability which reflects the time tolerance of optimal proofing ensuring the highest volume of the final product changed in same range (6–8 min). The increase caused by malt was more significant in the dough samples with a very low value of proofing stability (from 4 to 6 min) in both sets as described in Figure 1.
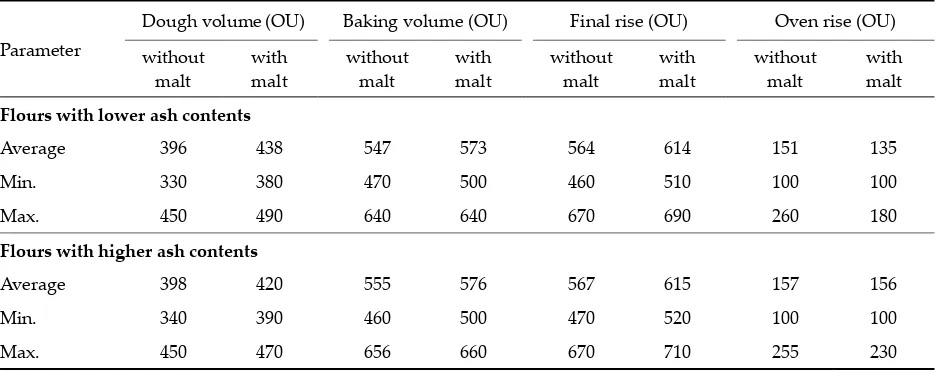
The oven rise recorder describes the change in the volume of dough (at the point of maximum
[image:4.595.64.540.102.288.2]maturity) during baking in the oil bath. Due to the exact heat transfer, the temperature and the dough volume can be determined at any point of the process. The volume of the dough increases as does the oil temperature (from 30°C to 100°C) and the piece ascends in the bath. The action is recorded in oven rise units (OU) on the strip-chart. The evaluation of the oven rise diagrams of the dough without and with malt addition is shown in Table 4. The dough volume, which is indicated as the volume of the dough at the start of the baking period, was found similar in both sets of sample. After malt addition, the dough volume changed in a wider range for flours with lower ash contents (380–490 OU against 390–470 OU). The baking volume (indicating the final volume of the baked goods) and its changes after malt addition was Table 3. Average values of maturograph evaluation
Parameter
Final proof time (min) Dough level (MU) Dough elasticity (MU) Proofing stability (min) without
malt with malt without malt with malt without malt with malt without malt with malt
Flours with lower ash contents
Average 42 42 669 691 194 198 7 10
Min. 36 38 480 630 160 170 4 8
Max. 48 46 770 800 220 230 10 12
Flours with higher ash contents
Average 39 40 673 701 196 204 7 10
Min. 32 34 580 650 180 190 2 8
[image:4.595.64.538.330.516.2]Max. 44 46 780 780 220 230 12 14
Table 4. Average value of OTG evaluation
Parameter
Dough volume(OU) Baking volume (OU) Final rise (OU) Oven rise (OU) without
malt with malt without malt with malt without malt with malt without malt with malt
Flours with lower ash contents
Average 396 438 547 573 564 614 151 135
Min. 330 380 470 500 460 510 100 100
Max. 450 490 640 640 670 690 260 180
Flours with higher ash contents
Average 398 420 555 576 567 615 157 156
Min. 340 390 460 500 470 520 100 100
1 2 3 4 5 6 7 8 9 10 11 12 13 14
1 2 3 4 5 6 7 8 9 10 11 12 13 14 15 16 17 18 19 20 Flour samples
St
ab
ili
ty
ti
m
e
(m
in
)
T 650 T 650 + DA
3 4 5 6 7 8 9 10 11 12
1 2 3 4 5 6 7 8 9 10 11 12 13 14 15 16 17 18 19 20 21 22 Flour samples
St
ab
ili
ty
ti
m
e
(m
in
)
[image:5.595.101.474.85.591.2]T 530 T 530 + DA
Figure 1. Influence of malt flour on proofing stability – flour with lower (A) and higher (B) ash contents B
A
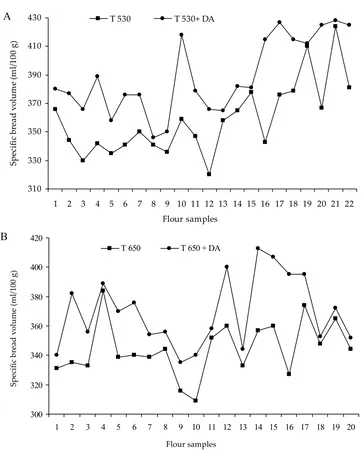
slightly higher with flour samples with higher ash contents. The effect of malt showed only, with the samples with small original volumes (increase about 10%). From these results, it is apparent that, the oven rise (the difference between the final bread and the dough volumes) was lower in the set with lower ash contents and, after the malt addition, the average value was significantly lower in this set of
flour only. The final rise (represents the volume of the baked goods after 11 min from the test begin-ning) described the shrinkage of volume mostly by the malt action (about 8%).
com-Table 5. Average values of baking test evaluation
Parameter Specific bread volume (ml/100 g) Bread shape ratio without malt with malt without malt with malt
Flours with lower ash content
Average 359 389 0.61 0.62
Min. 320 346 0.57 0.57
Max. 424 428 0.66 0.66
Flours with higher ash content
Average 345 369 0.61 0.62
Min. 309 335 0.58 0.59
[image:6.595.63.531.102.267.2]Max. 384 413 0.68 0.66
Figure 2. Influence of malt flour on specific bread volume – flour with lower (A) and higher (B) ash contents 310
330 350 370 390 410 430
1 2 3 4 5 6 7 8 9 10 11 12 13 14 15 16 17 18 19 20 21 22 Flour samples
Sp
ec
ifi
c
br
ea
d
vo
lu
m
e
(m
l/1
00
g
)
T 530 T 530+ DA
300 320 340 360 380 400 420
1 2 3 4 5 6 7 8 9 10 11 12 13 14 15 16 17 18 19 20
Flour samples
T 650 T 650 + DA
Sp
ec
ifi
c
br
ea
d
vo
lu
m
e
(m
l/1
00
g
)
B A
[image:6.595.102.466.285.736.2]Ta bl e 6. D ou gh c ha ra ct er is tic s co rr el at io n
Final proof Dough lev
el
Dough elasticity Dough stability Dough volume Baking volume Final rise
Ov en rise Specific bread volume Shape ratio
Flour with ash content lower than 0.6%
( r0.01 = 0.536) Final proof 1 Dough lev el –0.0711 1 Dough elasticity –0.1497 0.6047 1
Dough stability
0.0000 0.0941 –0.1638 1 Dough v olume 0.2820 0.5611 0.6141 –0.1666 1 Baking v olume –0.0452 0.7201 0.7389 –0.1423 0.7935 1 Final rise –0.2279 0.6424 0.7647 –0.1674 0.7730 0.8277 1 Ov en rise –0.4677 0.3937 0.3505 0.0000 –0.0992 0.5269 0.2736 1
Specific bread v
olume 0.0763 0.5612 0.6357 0.0796 0.7109 0.7516 0.7108 0.2361 1 Shape ratio 0.2862 0.5449 0.0896 0.0645 0.2885 0.3271 –0.0013 0.1320 0.2183 1
Flour with ash content lower than 0.7%
( r0.01 = 0.5614) Final proof 1 Dough lev el 0.3261 1 Dough elasticity 0.2365 0.8334 1 Dough stability 0.1757 –0.3342 –0.4000 1 Dough v olume 0.2299 –0.0594 –0.0506 0.2275 1 Baking v olume 0.5650 0.5416 0.5103 –0.0093 0.5474 1 Final rise 0.6718 0.1749 0.1106 0.2671 0.6457 0.7015 1 Ov en rise 0.2937 0.6884 0.6448 –0.1742 –0.0644 0.7999 0.3734 1
Specific bread v
[image:7.595.75.521.88.759.2]parable average increases of volume were found (about 10%), but as for separate samples, individual values of increase were detected (Figure 2). The bread shape ratio increased insignificantly in both sets. As it is known, the influence of malt was as-sessed to be more important for flours with a lower α-amylase activity.
The correlation between the fermented dough characteristics as measured by the maturograph and the oven rise recorder, and the bread characteristics evaluated by a laboratory baking test (Table 6) de-pends on the flour quality. In both sets of flour, a significant correlation between the specific bread volume and all oven spring parameters was found. The relationship between the baking volume and the dough level and elasticity was proved with the set of flour with lower ash contents, but its relation to the proofing stability was statistically important only with flours with higher ash contents. It con-firmed, the baking characteristics relation to the maturograph parameters were highly influenced by both the ash content and the protein quality.
Conclusion
Technological quality of two sorts of white wheat flours with different protein and ash contents were described by means of rheological methods (using the amylograph, the maturograph and the oven rise recorder) including a laboratory baking test. The influence of small amounts of malt flour on the proofing stability was significant. The increase was about 40% for both sets of flour. The proof-ing time was not prolonged as significantly as the dough elasticity in all samples. The dough behav-iour during oil baking in the oven rise tests was
influenced by the addition of malt at an important level, similarly as the specific bread volume in the baking test, but individual differences were found between separate flour samples in accordance with D���� (2003). The bread shape ratio increased in-significantly by the malt fortification. A significant correlation was obtained between the oven spring parameters and the baking test results, but as far as the maturograph characteristics are concerned, their relationships to the bread volume depends on flour quality.
References
D���� I.S. (2003): Effect of Alpha-amylases on dough properties during turkish hearth bread production. Int. J. Food Sci. Technol., 38: 209–216.
F����� P.L. (1985): Effect of wheat variety on the relati-onship between Falling Number and alpha-amylase activity. Cereal Chem., 62: 258–262.
P������� Y. (1971): Wheat Chemistry and Technology. AACC, II. Ed. St. Paul, Minnesota: 561–600. P���� J., P������� A., D������ R. (1994): Influence
of dough-making condition on the concentration of individual sugars and their utilization during fermentation. Cereal Chem., 71: 505–508.
P���� E.J. (1988): Baking Science and Technology. Sosland Publ. Comp., Kansas City: 256–265. R��� G. (1975): Enzymes in Food Processing, II Ed.
Academic Press, New York.
S����� P.R., T����� A.S. (2000): Wheat Gluten, The Royal Society of Chemistry. Cambridge: 271–282.
Received for publication October 23, 2003 Accepted a�er corrections December 20, 2003
Souhrn
H������� M., Š��� I., K������� I. (2003): Vliv přídavků sladové mouky na reologické vlastnosti fermentovaného těsta. Czech J. Food Sci., 21: 210–218.
významně prodloužila ve vzorcích obou souborů, avšak pružnost těsta při maturogafické zkoušce se změnila pouze u světlých mouk. Charakteristiky OTG a měrný objem pečiva vykázaly výrazné změny s individuálním rozdílem pro jednotlivé mouky obou souborů. Významné korelace (99 %) byly zjištěny mezi měrným objemem výrobků a parametry při zapékání, zjištěnými na OTG přístroji.
Klíčová slova: pšeničné mouky; sladová mouka; fermentované těsto; maturograf; OTG; měrný objem pečiva
Corresponding author:
Ing. M���� H�������, CSc., Vysoká škola chemicko-technologická, Ústav chemie a technologie sacharidů, Technická 5, 166 28 Praha 6, Česká republika