271
©IJRASET: All Rights are Reserved
Experimental Investigation on Surface Roughness
and Chip Morphology during CNC Turning of
Aluminium (6063-T6)
Rajani Gadhiya1, Ankit Darji2
1
PG Student, Mechanical Engineering Department, LDRP-ITR, Kadi Sarva Vishwavidyalaya, Gandhinagar
2
Assistant Professor, Mechanical Engineering Department, LDRP-ITR, Kadi Sarva Vishwavidyalaya, Gandhinagar
Abstract: The surface roughness is an important measure of product quality since it greatly affects the performance of mechanical parts as well as production cost. In this research work numbers of the experiment are carried out to investigate the evolution of chip morphology and its effect on surface roughness during CNC turning of aluminium 6063-T6 using different cutting tool inserts. Further, it is also present an effect of various cutting parameters and cutting tool geometry on surface roughness. After conducting experiment various chips are examined under a microscope for chip morphology and the effect of various types of chips on the surface finish is studied.
Keywords: CNC Turning, surface roughness, chip morphology, Taguchi, ANOVA
I. INTRODUCTION
In modern machining industry, product quality is an important factor to keep in mind in order to achieve higher productivity. The turning process on a CNC is programmed by speed, feed rate, and cutting depth according to job characteristics which are frequently determined based on the job shop experiences. However, these cutting conditions are not guaranteed to be acceptable. Therefore, the optimum turning conditions have to be accomplished. This paper investigates the cutting parameters of Aluminum alloy 6063 in CNC turning machine and optimize these cutting parameters like depth of cut, speed, and feed. The cutting inserts used are CNMG, DNMG, and TNMG with appropriate shim material. After measuring surface roughness of machined part these results are related with chip morphology study. From an experimental result, an optimum cutting condition is being obtained.
A. Turning Process
[image:1.612.227.392.559.706.2]Turning is the most common machining operation carried out in any machine shop. Turning is a form of metal removal process which is used to modify the shape, dimension, and surface roughness of a workpiece by removing the unwanted material in the form of chips. Turning is largely used to mate one part with other parts in the die, aerospace, automotive and machinery design also in manufacturing industries. To perform turning operation, relative motion is achieved between primary motion, called the cutting speed, and the secondary motion, called the cutting feed. In turning operation primary motion is provided to the workpiece while secondary motion is provided to the cutting tool. By using a combination of these motions, the desired shape of the machined surface can be obtained.
272
©IJRASET: All Rights are Reserved
B. What is Surface Roughness?
Surface roughness is a component of surface texture. It is quantified by the deviations in the direction of the normal vector of a real surface from its ideal form. If these deviations are large, the surface is rough; if they are small, the surface is smooth. Quantitatively, surface roughness is evaluated by means of one or more of the following main parameters: the arithmetical average deviation of the surface profile (Ra), the height of irregularities at ten points (Rz), the maximum height of irregularities (Rmax), the average spacing of irregularities (Sm), the average peak spacing of irregularities (S), and the sampling length of the profile (tp).
.
Fig.2 Factors affecting surface finish
II. LITERATUREREVIEW
Daochun Xu et al. (2014) [1] had investigated the chip formation process of aluminium alloy 6061-T6 by performing a series of operation on a wide range of cutting speed and feed. By doing so, there are seven types of chips were obtained in the operation. In this experiment, the chips mainly appear to be a continuous chip, discontinuous chip, and curling chip. By increasing cutting speed, friction angle, chip thickness, length and width of the first shear zone decreases and there is an increase in shear slide distance and shear angle by increasing cutting speed.
Fuda Ning et al. (2014) [2] studied chip morphology and its effect on surface roughness during milling of Inconel 718 alloy. They found that when cutting speed increases from 25 to 200 m/min, the chip burrs value decreases first and then increases. Both height and pitch of chip burrs reach the lowest value at a cutting speed of 75 m/min and serrated chip begin to appears. That cutting speed is called critical cutting speed and the surface roughness Ra is also minimum at that point.
Vickey Nandal et al. (2015) [3] concluded that during machining of AISI 4140 (410 HV) steel, the formation of Continuous and saw tooth chips take place at relatively low cutting speeds and different feed rate has been examined. All cutting tests were performed by using Cubic boron nitride (CBN) tool inserts on specific cutting speeds from 75 m/min to 150 m/mi. This study investigated that both cutting speed and feed rate are found to have an influence on the chip thickness.
Basim A. Khidhir et al. (2010) [4] has done a study on turning operation of nickel-based Hastelloy C-276 using different types of inserts using CNC machine at different stages of cutting speed. By using different types of inserts chip transition is taking place from thick continuous chip to wider discontinuous chip. The burrs disappear for the coated insert tips when the speed changed to 150m/min and also surface roughness is improved.
Mohamed Baccar Mhamdi et al. (2013) [5] has performed an operation on AISI-D2 steel at different cutting conditions and observed their chip formation mechanism to obtain optimum cutting condition. During machining, process chips are collected for microscope examination and from the study of chip morphology it is found that the chip formation mechanism is affected by cutting conditions.
Walid Mahmoud Shewakh (2013) [6] investigated the influence of shim materials on the surface quality during hard turning of bearing steel. Using shims made of natural and composite materials to enhance the damping properties of the ceramic inserts holding systems, the surface roughness is being evaluated. The experimental results show that the chlorites and sandstones have the minimal acoustic activity, the sandstones shim has the minimal vibration within high frequencies: within the low frequencies, the chlorites shims have shown advanced priority against the other shims.
273
©IJRASET: All Rights are Reserved
design of the experiment to reduce numbers of the experiment. In this analysis, they concluded that speed is the most influencing parameter followed by the depth of cut and feed.
Nachimuthu A. K. (2013) [8] Taguchi method for minimization of surface roughness in turning operation. During operation, we have to select various cutting parameter combinations of speed, feed, and depth of cut which is always not acceptable. So, by using Taguchi method these parameters combination can be predicted and according to control level numbers of experiments are carried out. At a speed of 4000rpm, the feed of 0.2m/min, and using aluminium shim material, surface roughness reduced to its minimum value. ANOVA analysis is used to find cutting parameters effect on surface roughness.
III.EXPERIMENTALSETUP
A. Material
The material studied here is aluminium 6063-T6. The length and diameter of the workpiece are 100mm and 50mm respectively.
TABLE I
Chemical composition of aisi d2 steel, WT %.
Component Al Cr Cu Fe Mg Mn Si Ti Zn Other
Wt. % Max
97.5
0.0-0.10 0.0-0.10 0.0-0.35 0.45-0.90
0.0-0.10 0.20-0.60
0.0-0.10 0.0-0.10 0.0-0.05
B. Test conditions
[image:3.612.37.575.245.741.2]1) CNC Machine: The turn master GF 165-A CNC lathe machine is used for performing experiments.
[image:3.612.190.432.338.567.2]Fig. 3 CNC Machine
TABLE II Machine Specifications
Sr. No. Specifications Units
1 Maximum Turning Diameter 200mm
2 Maximum Turning length 300mm
3 Distance between center 550mm
4 Spindle motor 5HP
5 Chuck Size 165mm
6 Positioning Accuracy 0.008mm
274
©IJRASET: All Rights are Reserved
[image:4.612.214.403.118.212.2]2) Surface Roughness Tester: The Mitutoyo Sj-210 surface roughness tester used for measuring surface roughness of workpiece after machining
Fig.4 Surface roughness tester
3) Tool Material: Tool Holder: DCLNR 20412CQ
Cutting insert: (Nose radius=0.81, Grade = CA 225)
1) CNMG-12 04 08 2) DNMG-15 04 08 3) TNMG -22 04 08
IV.RESULTANDDISCUSSION
A. Selection Of Parameters And Levels
[image:4.612.72.534.489.547.2]The process parameters which are to be optimized were set in levels in the machine range. Each parameter had 3 levels. The effects of these parameters were considered for evaluation of effective response. The process parameters with their respective level are shown in table 3.
TABLE III Parameters And Levels
No. Parameters Level 1 Level 2 Level 3
1 Speed(m/min) 200 250 300
2 Depth of cut(mm) 0.5 1 2
3 Cutting Insert CNMG TNMG DNMG
B. Selection of Orthogonal Array
Experiments were planned according to Taguchi’s L27 orthogonal array, which has 27 rows corresponding to the number of experiments (27degrees of freedom) with 3 columns at three different levels as shown in table 3
C. Experiment Procedure
Taguchi analysis is performed according to the selected design of the experiment table. The minimum surface roughness developed in each set of the combination is noted and tabulated in the table. For each experiment, the orthogonal array, signal to noise ratio(S/N) are calculated. The quality response is mainly divided into three categories; the smaller is better, larger is better and nominal is better.
Smaller-the-better’ S/N = -10*log (Σ (Y2)/n) (1)
Larger-the-better’ S/N = -10*log (Σ (1/Y2)/n) (2)
275
©IJRASET: All Rights are Reserved
Where y is the measured data y is the average data s is the variance of y and n is the number of samples. For each type of the characteristic with the above S/N ratio transformation the higher the S/N ratio the better is the result. Minitab 18 statistical software used to calculate S/N ratios for each factor are shown in table 4.
D. Surface Roughness Measurement
TABLE IV
Experiment Results For Surface Roughness Corresponding S/N Ratio Of Cutting Parameters
No. Cutting Insert Speed(m/min) Depth of
Cut(mm)
Surface Roughness(μm) S/N
Ratio 1
CNMG
200 2 0.438 7.1705
2 200 1 0.371 8.6125
3 200 0.5 0.292 10.6923
4 250 2 0.572 4.8520
5 250 1 0.475 6.4661
6 250 05 0.275 11.2133
7 300 2 0.395 8.0680
8 300 1 0.272 11.3086
9 300 0.5 0.257 11.8013
10
DNMG
200 2 0.995 0.0435
11 200 1 0.907 0.8478
12 200 0.5 0.884 1.0709
13 250 2 0.813 1.7981
14 250 1 0.793 2.0145
15 250 0.5 0.768 2.2927
16 300 2 0.785 2.1026
17 300 1 0.765 2.3267
18 300 0.5 0.743 2.5802
19
TNMG
200 2 1.423 -3.0641
20 200 1 1.085 -0.7085
21 200 0.5 0.952 0.4272
22 250 2 1.110 -0.9064
23 250 1 1.061 -0.5143
24 250 0.5 0.982 0.1577
25 300 2 0.915 0.7715
26 300 1 0.985 0.1312
[image:5.612.79.535.166.581.2]27 300 0.5 0.951 0.4363
TABLE V
Response Table For Signal To Noise Ratio (Smaller Is Better)
Level Cutting Insert Cutting Speed Depth of Cut
1 8.9094 2.7880 4.5192
2 1.6753 3.0416 3.3872
3 -0.3632 4.3919 2.3151
Delta 9.2727 1.6038 2.2040
Rank 1 3 2
276
©IJRASET: All Rights are Reserved
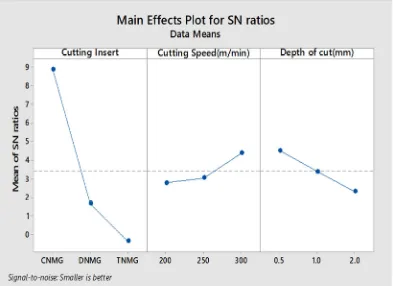
[image:6.612.110.503.91.377.2]The influence of control factor can be more clearly presented with the response graph as shown in figure 5
Fig.5 Main effect plots for S/N ratio for surface roughness
From the above graph, the optimum values for the surface roughness are (a) Cutting insert= CNMG (b) Spindle speed =300 m/min (c) Depth of cut = 0.5 mm.
E. Analysis of variance (ANOVA) for Surface Roughness
Minitab 18 statistical software used to obtain ANOVA table for surface roughness. In ANOVA table P value is set in terms of (Alpha = 0.05). If the P value is below 0.05 then parameters are significant level and ANOVA also define as contribution factor for each parameter. It is clear from table 6 that cutting insert is the most significant parameter for surface roughness with a contribution of 88.27% followed by the depth of cut (4.46%) and cutting speed (2.68).
TABLE VI
Analysis Of Variance For Transformed Response
Source DF Seq SS Contribution Adj SS Adj MS F-Value P-Value
Cutting insert 2 0.85912 88.27% 0.85912 0.429561 192.14 0.000
Cutting Speed(m/min)
2 0.02605 2.68% 0.02605 0.013025 5.83 0.010
Depth of cut(mm) 2 0.04345 4.46% 0.04345 0.021727 9.72 0.001
Error 20 0.04471 4.59% 0.04471 0.002236
Total 26 0.97334 100.00%
F. Chip morphology
Chip morphology is a study of chip geometry which is produced during various operation like turning, milling etc. An
[image:6.612.48.560.541.646.2]277
©IJRASET: All Rights are Reserved
1. Cutting insert: CNMG Speed: 200m/min Depth of cut: 1mm Chip type: Long tubular helical
2. Cutting insert: CNMG Speed: 300m/min Depth of cut: 2mm Chip type: long tubular
3. Cutting insert: CNMG Speed: 250m/min Depth of cut: 0.5mm Chip type: washer type helical
4. Cutting insert: DNMG Speed: 300m/min Depth of cut: 1mm Chip type: loose arc chip
5. Cutting insert: DNMG Speed: 200m/min Depth of cut: 2mm Chip type: short washer helical
278
©IJRASET: All Rights are Reserved
V. CONCLUSIONS The following conclusions are drawn based on the experimental results of this study:
A. The experimental results show that Cutting insert is the major influencing parameters among the three controllable factors (Spindle speed, depth of cut) on surface roughness.
B. Minimum surface roughness obtained at an optimum level cutting speed 300 m/min, feed 0.15 mm/rev and depth of cut 0.5mm using CNMG insert.
C. Whenever increases in speed it reduces the surface roughness and increase in depth of cut, increases the surface roughness.
D. CNMG gives the least surface roughness compares to TNMG and TNMG.
E. By studying chip formation characteristics, we can get information about a cutting condition which is helpful in improving product quality
REFERENCES
[1] D. Xu, P. Feng, W. Li, Y. Ma and B. Liu, “Research on chip formation parameters of aluminium alloy 6061-T6 based on the high-speed orthogonal cutting
model”, International Journal of Advanced Manufacturing Technology, 72:955–962, March-2014
[2] F. Ning, F. Wang, Z. Jia, and J. Ma, “Chip morphology and surface roughness in high-speed milling of nickel-based superalloy Inconel 718”, Int. J.
Machining and Machinability of Materials, Vol. 15, Nos. 3/4, pp.285–299, January-2104
[3] V. nandal, V. singh, “Experimental investigation on the chip morphology during the machining of Aisi 4140 hardened steel by using cbn tool insert”
Proceedings of IRF International Conference, March-2015
[4] B. A. Khidhir, B. Mohamed “Study of cutting speed on surface roughness and chip formation when machining nickel-based alloy” Journal of Mechanical
Science and Technology 24 (5) (2010) 1053-1059, February-2010
[5] M. B. Mhamdil, S. B. Salem, M. Boujelbene and E. Bayraktar “Experimental study of the chip morphology in turning hardened AISI D2 steel” Journal
of Mechanical Science and Technology 27 (11) (2013) 3451-3461, April-2013
[6] W. M. Shewakh “Influences of shim materials on the surface quality during the hard turning”International Journal of Mechanical Engineering (IJME),
Vol. 2, Issue 3, 21-26, July-2013
[7] B. M. Eldhose, Cijo mathew, Dr Binu markose “Optimization of the Cutting Parameters of SS 304 for CNC Turning Operation” International Journal of
Innovative Research in Advanced Engineering (IJIRAE), Volume 1 Issue 8, September-2014
[8] A. K. Nachimuthu “Minimization of surface roughness in cnc turning using taguchi method” IOSR Journal of Mechanical and Civil Engineering (IOSR-
JMCE), Volume 8, Issue 1, PP 47-49, Aug. 2013 [9] https://www.custompartnet.com/wu/turning
[10] https://www.researchgate.net/figure/Fishbone-diagram-of-the-parameters-that-affect-surface-roughness-3_fig1_299356060
[11] http://www.transcat.com/catalog/product/gallery/id/202995/image/268543/
[12] Machine Tools for Machining - Scientific Figure on ResearchGate. Available from: