Abstract—Smartphones are quickly being adopted and used nearly for every aspects of our lives, such as business activities, social activities, at home by the family, just to name a few. While smartphones provide an unprecedented level of access to information and facilitate communication anytime, anywhere, it also creates negative impacts on the way society integrates with itself. Smartphones would enable instructors and students to create more interactive learning environment than ever before, yet it might get some people stressed out to the extent that they refuse to adopt smartphones. Therefore it is critical to address the negative side of smartphones to realize its potential in communication and productivity in education as well as in the workplace. The current research focuses on the technostress and antismart, or the resistance to smartphones, as emerging key factors that influence continuous use of smartphones in the educational environment. To examine the relationships among these factors, a research model and hypotheses were presented and tested using survey data. Findings indicate that continuous use of smartphones is influenced by technostress, which is then influenced by innovativeness and antismart. The result suggests that the product and service strategy should be prepared to reflect the learner's sensitivity in the educational environment using smartphones in order to overcome technostress and antismart tendencies.
Index Terms—antismart, continuous use, smartphone, technostress
I. INTRODUCTION
ITHIN five years, every child in every K-12 classroom in America will be using a mobile learning device (MLD), 24/7 [1]. Student achievement will increase significantly, since time-on-task increases significantly when students use MLDs such as smartphones inside the classroom for academic purposes. Educational environments, as well as the history of humans, will undergo a paradigm shift through several key factors, such as advances in technology and changes in social values. This paradigm shift of the history of civilization into smart society is taking place by the utilization of information technology (IT). IT can create new values, change our standard of life, and recreate societal structure.
Smart products can lead this era, and function as the new buzzword. The market share of smartphones, which is representative of the smart products, is increasing. According to a survey by market research firm Nielsen, a majority
Manuscript received July 15, 2012; revised August 15, 2012.
Sang-Joon Lee is with the School of Business Administration, Chonnam National University, Yongbong-dong, Buk-gu Gwangju, Korea (phone: 62-530-1447; fax 62-530-1449; e-mail: s-lee@ chonnam.ac.kr).
Soo-Hyang Jin is with the Gwangju Institute of Science and Technology(e-mail: [email protected]).
Beom-Jin Choi is with the College of Business Administration, California State University, Sacramento, USA(e-mail: [email protected]).
(50.4%) of U.S. mobile subscribers owned smartphones in March 2012, up from 47.8 percent in December 2011. Consumers purchasing new phones are selecting smartphones more often [2].
The use of smartphones has brought many changes in society. Due to the increased use of personalized content, people can easily obtain their information that they need in real time. Smartphones that use real-time media such as Facebook, Twitter, and others help create online communities. People in the future will be able to exert more power in a way that they could not have imagined before, by using mobile devices like smartphones [3]. However, the evolution of these technologies can lead to increased technostress. In addition, the term antismart, which is a conscious resistance to the smartization, is emerging by a result of experiencing smart devices such as smartphones, smartpads, and smart TVs.
In this paper, we define the concept of antismart, and examine the influence of technostress and antismart on continuous use of the smartphones in an educational context.
It is necessary to be aware of the antismart trend and technostress in the field of education, which is now quickly adopting mobile devices, particularly smart devices. And it is also important to realize and overcome any obstacles of using smart devices in learning environment. To have the intention for continuous use of smartphones is critical as it means that smartphone-based education can be more broadly applied to allow practitioners to better implement smart devices in learning environment.
II. THEORETICAL FRAMEWORK AND RELATED WORKS
A. Theoretical Framework
Expectation-Confirmation Theory
Expectation-confirmation theory (ECT) is widely used in the consumer behavior literature to study consumer satisfaction, post-purchase behavior, and service marketing in general [4]. The process by which consumers reach repurchase intentions in an ECT framework is as follows.
First, consumers form an initial expectation of a specific product or service prior to purchase. Second, they accept and use that product or service. Following a period of initial consumption, they form perceptions about its performance. Third, they assess its perceived performance vis-à-vis their original expectation and determine the extent to which their expectation is confirmed. Fourth, they form a satisfaction judgment, or affect, based on their confirmation level and expectation on which that confirmation was based. Finally, satisfied consumers form a repurchase intention, while dissatisfied users discontinue its subsequent use [5].
The Influence of Technostress and Antismart on
Continuous Use of Smartphones
Sang-Joon Lee, Soo-Hyang Jin and Beom-Jin Choi
Post-Acceptance Model of IS Continuance
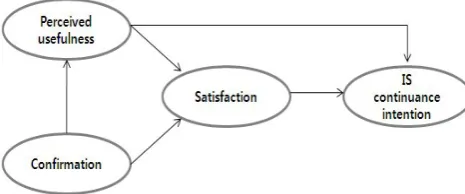
User's continuance intention to use is determined by their satisfaction with IS use and perceived usefulness of continued IS use. User satisfaction, in turn, is influenced by their confirmation of expectation from prior IS use and perceived usefulness. Post-acceptance perceived usefulness is influenced by users’ confirmation level [6].
[image:2.595.48.281.257.354.2]In Fig. 1, this model indicates that while post-acceptance usefulness perception continues to influence users' continuance intention, user satisfaction with prior use has a significant effect on the dependent variable. User satisfaction is determined primarily by users' confirmation of expectation from prior use and secondarily by perceived usefulness. Further, confirmation also has a significant influence on post-acceptance perceived usefulness.
Fig. 1. Post-acceptance model of IS continuance.
B. Related Works
Technostress
The neologism, Technostress (Technology and Stress) was originated from the title of a book written by Crigs Brod. Technostress is defined as a modern disease of adaptation caused by an inability to cope with the new computer technologies in a healthy manner. This disease may manifest itself in the struggle to accept computer technology, and by overidentification with computer technology [7].
Those who struggle to accept smart technology often feel pressured to accept and use smart devices. This pressure may cause headaches, nightmares, or resistance to learning about the new technology. Moreover, people who intensely and constantly spend long hours with the smart device begin to unwittingly internalize the characteristics of the smart device and are transformed into a machine like state.
Symptoms of this state include a high degree of factual thinking, poor access to feelings, an insistence on efficiency and speed, and a lack of empathy for others. These people are known as techno centered; their desire to conquer the system becomes greater than the desire for human relationships and human pleasures.
Although the stress research area is broad, technostress has not been extensively studied. Two recent studies have examined the impact of technostress and as such, emphasized the importance of studying technostress [8,9]. These studies have found that individuals experiencing technostress have lower productivity and job satisfaction, and decreased commitment to the organization.
More recently, there has been research for analyzing technostress as technological antecedents [10]. This research
identified characteristics of technology, and has three sets of variables: technology characteristics, stressors, and the ultimate manifestation of stress (strain). Stressors include work-home conflict, invasion of privacy, work overload, role ambiguity and job insecurity.
Antismart
There are various concepts related to the resistance to advanced technologies, such as information systems. Neo-Luddism argues that the computer destroyed people's feelings, and that advanced technology and various media of information suppressed human freedom. This is an anti-technology movement to pull people out of the online world and from their computers, and encourage them to refuse advanced technology [11].
Digilog is a compound word formed of digital and analog. It blends analog, which is associated with warmth and anthropocentricity, as well as the cold associated with digital through only having "0’s" and "1’s". Anadigi people is a compound word of ana (analog people) and digi (digital people). They are the people who live a digital life by controlling and combining the world of analog and digital appropriately [12].
In this study, we define antismart as a conscious resistance to the smartization, through the experience of using smart devices, such as smartphones, smartpads, and smart TVs before and after they are introduced.
Innovativeness
Everett Rogers, a professor of rural sociology, popularized the theory in his 1962 book, Diffusion of Innovations. Rogers defines innovation as "an idea, practice, or object that is perceived as new by an individual or other unit of adoption." Diffusion of Innovations is a theory that seeks to explain how, why, and at what rate new ideas and technology spread through cultures. Rogers defines five intrinsic characteristics (relative advantage, compatibility, complexity or simplicity, trialability, observability) of innovations that influence an individual’s decision to adopt or reject an innovation. Diffusion is the process by which an innovation is communicated through certain channels over time among the members of a social system [13].
IT had a big role in information revolution and business innovation. Nowadays, smart innovations are being made through IT. The degree of acceptance of smartphones may be different depending on the user's innovativeness as smartphones are applied to real life managing software platforms and installing applications.
Innovativeness is the degree to which an individual is relatively earlier in adopting an innovation than other members of his system [14].
Accordingly, Goldsmith and Hofacker (1991) defined ‘domain’ or ‘product specific innovativeness’ as a tendency to learn about and to adopt innovations within a specific domain of interest. They figured out innovativeness as a characteristics related with personality which has a degree of innovation for all consumers [15].
Experience
knowledge of IT utilization and the experience of IT knowledge [16].
The individual ability of ICT capability can be expected to affect utilization of smartphones. To measure the degree of experience, Bassellier et al. (2001) study was derived to measure the ability of the individual IT capability.
III. RESEARCH MODEL AND HYPOTHESES
A. Research Model
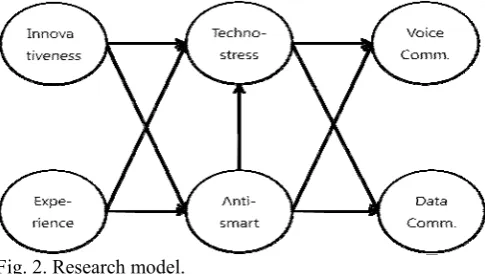
[image:3.595.49.292.263.400.2]As shown in Figure 2, a research model was developed upon review of the previous studies, where innovative inclination of smartphone users and experience, coupled with prior knowledge of IT, will have an impact on technostress and antismart.
Fig. 2. Research model.
We propose antismart will have an influence on technostress. Furthermore, technostress and antismart will have an influence on the continuous use of smartphones, with voice communication and data communication, depending on the preferences.
B. Hypotheses
This section presents the hypotheses for the study. The first hypothesis is about the relationship between personal characteristics of the smartphone user and technostress. The second hypothesis is about the relationship between personal characteristics of the smartphone user and antismart. The third hypothesis is about the relationship between technostress and antismart. The fourth and fifth hypotheses are about the influence of technostress and antismart on the continuous use of smartphone. The hypotheses are shown below:
H1. Individual characteristics of smartphone user will have influence on technostress.
H1-1 : Innovativeness of user will have influence on technostress.
H1-2 : User’s Experience of ICT will have influence on technostress.
H2. Individual characteristics of smartphone user will have influence on antismart.
H2-1 : Innovativeness of user will have influence on antismart.
H2-2 : Experience about IT will have influence on antismart.
H3. Antismart will have influence on technostress. H4. Technostress will have influence on the continuous
use of smartphone
H4-1 : Technostress will have influence on preference of voice communication of smartphone H4-2 : Technostress will have influence on preference
of data communication of smartphone. H5. Antismart will have influence on the continuous use of
smartphone
H5-1 : Antismart will have influence on preference of voice communication of smartphone
H5-2 : Antismart will have influence on preference of data communication of smartphone.
IV. RESEARCH METHODOLOGY
A. Questionnaire Development
We conducted a survey of smartphone users to test the hypotheses presented above. Measurement instruments were derived from previous studies, modified to fit the research environment, and verified for reliability and validity. All the variables were measured using the Likert five-point scale. Operational definitions of variables used in this article are as follows:
Innovativeness : Characteristics of intentions to utilize the
new IT, ahead of the other members of the society
① I love to have first-hand experience in new information technologies.
② I start using new information technologies faster than others.
③ I know new information technologies better than others.
④ I am keen in innovative products and try to purchase one as soon as possible.
⑤ I can cope with new social changes and know new information well.
Experience : Prior knowledge or experience in IT
① I have had an experience in using a smart phone application (e.g., Twitter, Facebook and any other mobile apps).
② I know social network services (SNS) such as Twitter and Facebook well.
③ I have knowledge on IT trends (e.g., smart phones, mobile devices and ubiquitous).
④ I know what a computer, smartphone and tablet is and how to use it.
Technostress : Stress that occurs while using smart phones
① I have more business (in work/study) than before using a smart phone.
② I suffer from stress owing to continuously increasing of new functions on the smart phone.
④ I am afraid that I may not be able to learn new technologies added to the smart phone.
Antismart : Conscious resistance to the smartization, through
the utilization of smart devices
① I think cutting-edge technologies such as smart phones affect the quality of mental life.
② I hanker after the analogue way of life.
③ Sometimes I feel comfortable in a place without smart phones and cutting-edge devices (e.g., countryside, backwoods)
③ I would like to set and keep a "digital sabbath" to make me separated from IT devices once a week. ④ I would like to have an IT-free time during the day.
Preferences of data communications : Intentions of
continuous use of smartphones, according to preferences of data communication through the use of smartphone applications
① I will use the smart phone mainly for data communication (including applications).
② I will continue communicating with people mainly through data communication (e.g., messenger apps). ③ I would like to use more applications.
Preferences of voice communications : Intentions of
continuous use of smartphones according to preferences of function of voice communication
① The most frequently used function on my smart phone is voice communication.
② I am willing to pay for voice communication services. ③ I will continue communicating with people mainly
through voice communication.
B. Data Collection
We collected questionnaire responses from 268 respondents in the spring of 2012 in Korea. The characteristics of this sample data are as follows. The gender composition was 124 male (46.3%) and 144 female (53.7%). The age composition was teens and under 3 (1.9%), twenties 91 (34.0%), thirties 97 (36.2%), forties 47 (17.5%), fifties 25 (9.3%), and over sixties 3 (1.1%). In occupation, composition was company worker 88 (32.8%), office staff/ technical staff 60 (22.4%), student 57 (21.3%), housekeeper 17 (6.3%), professional 14 (5.2%), other 13 (4.9%), independent businessman 8 (3.0%), government officer 7 (2.6%), and educator 4 (1.5%). In level of education, composition was college degree 151 (56.3%), post-graduate degree 89 (33.2%), high school 17 (6.3%), in college 11 (4.1%).
V. ANALYSIS AND RESULTS
A. Data Analysis
We carried out exploratory factor analysis with principal component analysis and orthogonal varimax procedure, in order to verify the construct validity of the factors.
As shown in Table I, most factor loadings are more than 0.5. The commonality estimates are more than 0.5 and all the variables can be verified that they are loaded appropriately by six factors. Therefore, these factors have confirmed construct validity.
TABLE I
THE RESULT OF FACTOR ANALYSIS
Item Fac1 Fac2 Fac3 Fac4 Fac5 Fac6
Inno._2 .853 -.092 .236 .112 .038 -.056
Inno._3 .845 -.128 .130 .155 -.101 .029
Inno._4 .790 -.093 .257 .133 -.028 .008
Inno._1 .709 -.093 .294 .292 -.056 -.075
Inno._5 .691 -.127 .160 .353 -.044 -.008
Antis._4 .075 .832 -.159 -.099 .125 .001
Antis._5 -.040 .823 -.123 -.124 .134 -.052
Antis._3 -.123 .774 -.097 .095 .063 .136
Antis._2 -.201 .738 .048 .137 -.033 .215
Antis._1 -.239 .570 -.018 -.171 .057 .016
DaCom._3 .179 -.108 .804 .239 .047 .034
DaCom._1 .248 -.075 .784 .253 -.020 -.012
DaCom._4 .251 -.140 .741 .202 -.016 -.059
DaCom._2 .388 -.106 .673 .034 -.085 .073
Expe._2 .249 -.044 .260 .788 -.016 -.146
Expe._3 .420 -.035 .229 .722 -.048 -.098
Expe._4 .436 -.030 .120 .721 -.059 -.003
Expe._1 .040 .001 .483 .667 .085 -.139
Tech._4 -.091 .094 -.029 -.150 .878 .045
Tech._3 -.040 .079 .082 .070 .868 .016
Tech._2 -.188 .480 -.119 -.046 .490 .079
Tech._1 .144 .441 -.085 .118 .458 -.033
VoCom_3 -.029 .139 .023 -.046 .083 .779
VoCom_2 .043 .022 .084 -.076 -.029 .748
VoCom_1 -.114 .083 -.472 -.177 .034 .622
Reliability refers to the consistency of a measure. A measure is said to have a high reliability if it produces consistent results under consistent conditions. Cronbach alpha for each factors were assessed from 0.90 to 0.605 as shown in Table Ⅱ. Therefore, these factors have internal consistency, and this survey data can be judged as useful information.
TABLE Ⅱ
THE RESULT OF RELIABILITY ANALYSIS
Research Variable Initial Items Removed Items Items Final (Cronbach's Reliability alpha)
Innovativeness 5 0 5 0.905
Experience 4 0 4 0.859
Antismart 5 0 5 0.835
Technostress 4 0 4 0.735
Voice Preference 3 0 3 0.605
Data Preference 4 0 4 0.862
convergent validity and the discriminant validity. The structural equation modeling through AMOS was used. Table
Ⅲ is the result of the analysis of the structural model. Standardized loading is above 0.7, the construct reliability is above 0.6, AVE (average variance extracted) is almost above 0.5, so we can get construct validity.
TABLE Ⅲ
THE RESULT OF STRUCTURAL EQUATION MODELING
Construct Items Standardized Regression Weights Error
construct reliability AVE
Innovativeness
Inno_5 0.761 0.339
0.916 0.685 Inno_4 0.805 0.352
Inno_3 0.833 0.263 Inno_2 0.862 0.245 Inno_1 0.800 0.322
Experience
Expe_2 0.795 0.318
0.870 0.629 Expe_3 0.869 0.203
Expe_4 0.797 0.347 Expe_1 0.663 0.587
Technostress
Tech_4 0.83 0.326
0.746 0.436 Tech_3 0.725 0.527
Tech_2 0.562 0.632 Tech_1 0.456 0.766
Antismart
Anti_4 0.818 0.434
0.817 0.478 Anti_5 0.829 0.422
Anti_3 0.713 0.589 Anti_2 0.629 0.699 Anti_1 0.524 0.627
Voice Preference
Voic_3 0.814 0.348
0.614 0.377 Voic_2 0.337 0.667
Voic_1 0.454 0.606
Data Preference
Data_3 0.853 0.209
0.886 0.662 Data_1 0.652 0.478
Data_4 0.831 0.265 Data_2 0.802 0.317
The goodness of fit of a statistical model describes how well it fits a set of observations. Measures of goodness of fit typically summarize the discrepancies between observed values and the values expected under the model in question. We conducted goodness of fit tests to evaluate fitness of the model. When we consider fit index, χ²/df, RMSEA, RMR, GFI, etc. of the structural equation model in Table Ⅳ, the model is appropriate because the values meet the criteria.
TABLE Ⅳ
THE RESULT OF GOODNESS OF FIT TEST goodness of fit test Value Criteria
χ² 783.982(p=.000) p>.05
χ²/df 2.958 1.0<=χ²/df<=2.0~3.0 RMSEA 0.079 <=0.08
RMR 0.139 <=0.08 GFI 0.803 >=0.80 TLI 0.825 >=0.80 CFI 0.845 >=0.80 IFI 0.847 >=0.80
The results of discriminant analysis are Table Ⅴ. The square root of average variance extracted for each latent variable, are above 0.6. In addition, these square root values are more than the value of estimated correlation coefficient with other latent variables. So, we can assert that our data has discriminant validity.
TABLE Ⅴ
INTERNAL CONSISTENCY AND CORRELATION COEFFICIENTS Construct Inno Expe Tech Anti Voic Data
Innovation 0.827
Experience .566 0.793
Technostress -.262 -.147 0.660
Antismart -.146 -.074 -.427 0.691 Voice
Preference -.169 -.292 .209 1.09 0.614 Data
Preference .562 .586 -.263 -.119 -.216 0.813
In this paper, there is no correlation greater than 0.7 as shown in Table Ⅵ, so we can assert that there is no problem in multicollinearity.
TABLE Ⅵ CORRELATION ANALYSIS
Construct Inno Expe Tech Anti Voic Data
Innovation 1.00
Experience .566** 1.00
Techno
stress -.262** -.147* 1.00
Antismart -.146*
-.074 -.427**
1.00 Voice
Preference -.169
**
-.292**
.209**
1.09 1.00
Data
Preference .562** .586** -.263** -.119 -.216** 1.00 ** Correlation coefficient is significant in 0.01 level
* Correlation coefficient is significant in 0.05 level
B. Path Analysis and Hypothesis Testing
The evaluation of the structural equation model puts the focus on the relationship between latent variables. Table Ⅶ
shows the result of the structural equation model, standardized factor loading, standard errors, and t-value. The results of this structure equation model are reliable because most of the standard errors are less than 0.1. The four paths are significant and the four hypotheses (H1-1, H3, H4-1, H4-2) are accepted.
TABLE Ⅶ
FACTOR LOADINGS OF STRUCTURAL EQUATION MODELS AND THE RESULTS OF HYPOTHESIS TESTING
Path Unstd.Fator Load.
Std. Fator Load.
Std.
Dev. t-val p Result?
Inno →Tech -0.253 -0.347 0.132 -2.628 *** Accept
Expe →Tech 0.029 0.036 0.118 0.307 0.759 Reject
Inno→Anti -0.154 -0.19 0.13 -1.459 0.144 Reject
Anti→Tech 0.368 0.41 0.083 4.954 *** Accept
Tech→Voic 0.222 0.107 0.046 2.317 0.02 Accept
Anti→Voic 0.067 0.036 0.049 0.745 0.457 Reject
Tech→Data -0.322 -0.254 0.062 -4.079 *** Accept
Anti→Data 0.007 0.006 0.07 0.088 0.93 Reject
Technostress's R² =.182, Antismart's R² =.210, Voice Communication's R² =.070, Data Communication's R² =.044 p<0.001***, p<0.01**, p<0.05*
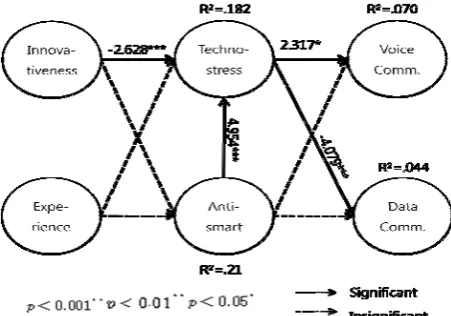
[image:6.595.48.274.209.367.2]The final structural equation model modified by the above results is shown in Figure 3.
Fig. 3. The result of structural equation model.
C. Results
In this paper, the following significant results were derived from the research.
First, the innovativeness, which is the tendency for the active utilization of innovative technologies, has a negative influence on techno-stress. This finding means that individuals with strong innovativeness or are adventurous to new IT and innovative technologies get less technostress. Second, the individual's experiences in smartphones do not have a significant influence on technostress. We expected that prior knowledge of IT, the use and experience of smart devices like smartphones, and experience of various applications on smart devices may reduce technostress. However, these experiences do not have an influence on technostress.
Third, innovativeness and experiences have shown that they don't have significant effects on antismart. Fourth, anti-smart has a positive effect on technostress. Those who refuse new technologies get a lot of technostress. Fifth, technostress has a significant (negative) influence on data communication preferences, and has a significant (positive) influence on voice communication preferences. This finding means that technostress sensitive users mainly use their phone for call features regardless of other smartphone applications. Sixth, antismart did not influence voice communication or data communication preferences. This means that antismart tendencies do not have any impact on usage patterns of smartphones.
VI. IMPLICATIONS AND CONCLUSION
In this paper, the relationships of the factors affecting continuous use of smartphones were empirically analyzed with social science research methodology. The use of smart devices such as smart phones has become increasingly important in today’s educational environment. The use of smart devices efficiently and effectively facilitates classroom collaboration among students and instructors both in voice and data communications. Failure to engage students in today’s “smart” learning environment will result in lost productivity for both students and instructors. Findings of the current study suggest that strategies be developed to address the learner's sensitivity in the educational environment using smartphones so as to reduce technostress and antismart tendencies. For example, advanced user interface, content, and instructional strategies should be utilized to reduce technostress in using smart device in learning environment.
REFERENCES
[1] C. Norris, A. Hossain, E. Soloway, “Using Smartphones as Essential Tools for Learning”, Educational Technology, May-June, 2011, pp. 18-25
[2] Available: http://blog.nielsen.com/nielsenwire/?p=31688
[3] F. Cairncross, The Death of Distance: How the. Communications
Revolution Will Change Our Lives, Boston, MA: Harvard Business
School Press, 1997.
[4] R. A. Spreng, S.B. MacKenzie and R.W. Olshavsky, "A reexamination of the determinants of consumer satisfaction," Journal of Marketing, 60(3), 1966, pp.15-32.
[5] R. L. Oliver, "A Cognitive Model of the Antecedents and Consequences of Satisfaction Decisions," Journal of Marketing
Research, 17(4), 1980, pp. 460-468.
[6] A. Bhattacherjee, “Understanding Information Systems Continuance: An Expectation-Confirmation Model”, MIS Quarterly, 25(3), 2001, pp.
351-370.
[7] C. Brod, Technostress: The Human Cost of the Computer Revolution, Addison-Wesley, 1984
[8] T. S. Ragu-Nathan, Monideepa Tarafdar, Bhanu S. Ragu-Nathan, “The Consequences of Technostress for End Users in Organizations: Conceptual Development and Empirical Validation”, Information
Systems Research, Vol. 19, No. 4, December 2008, pp. 417–433
[9] S. Thau, R. J. Bennett, M.S. Mitchell and M. B. Marrs, “How Management Style Moderates the Relationship between Abusive Supervision and Workplace Deviance: An Uncertainty Management Theory Perspective,” Organizational Behavior and Human Decision
Processes (108:1), 2009, pp. 79-92.
[10] R. Ayyagari, V. Grover, & R. Purvis, “Technostress:technological antecedents and implication”, MIS Quarterly, 35(4), pp. 831-858, 2011.
[11] Steven E. Jones, Against Technology: From the Luddites to
Neo-Luddism, Routledge, 2006
[12] E. Lee, Digilog, Tree of Though Publishing, Seoul, 2006.
[13] E. M. Rogers, Diffusion of innovations (5th ed.). New York, NY: Free
Press, 2003
[14] E. M. Rogers, F.F. Shoemaker, Communication of Innovations:A
Cross-Cultural Appoach, NewYork:The Free Press,1971.
[15] R. E. Goldsmith and C. F. Hofacker, “Measuring Consumer Innovativeness,” Journal of the Academy of Marketing Science, 19(3),
1991, pp. 209-221.