Comparative Seismic Analysis of G+13 Storey RC
Building Frame Structure
Mayank Kushwaha Sharma1, Rahul Kumar Thakur2, Vikrant Sharma3, Prof. Rajkumar Vishwakarma4
1, 2, 3
BE Students, 4Assistant Professor, Department of Civil Engineering, Takshshila Institute of Engineering & Technology, Jabalpur M. P. (India)
Abstract: In this Research project, we analyzed the G+13, RC Building Frame structure with seismic Zone III and Zone V with considered soft, Medium and Hard soils by using Linear Static method in a Staad Pro V8i civil software as per IS 1893 (Part I). In this work we adopted various parameters like plan of building 24.02mX24.02m symmetrical along to X and Z direction respectively, Damping ratio 5 percent, importance factor 1.5 for important structure, Special RC Moment Resisting Frame as 5. The comparative analysis of this frame structure in the term of maximum displacement, maximum shear forces, maximum bending moment, maximum storey-wise displacement. Comparative results found that, the seismic zone III and V the maximum support reaction and axial force is achieved in zone V with soft soil while zone III and Zone V with medium and hard soils support reaction and axial force are same. As comparing the bending moment, shear force and node displacement are observed as maximum in zone V with soft soil but minimum in zone III with hard soil. It means that decreased the seismic zones and change the soft to hard soil, the seismic effect is also decreased. Story-wise displacement, observed that maximum at Zone V with soft soil and minimum at zone III with hard and also founded that story is increased , story-wise node displacement id also increased that mean number storey is proportional to the displacement.
Keywords: Staad Pro, Seismic Zone, Soil Condition, Seismic analysis etc.
I. INTRODUCTION
Today’s time Structural Engineers appreciable challenge in today’s structure is constructing earthquake resistant structure. The challenge further increases due to increased eye pleasant high rise structures with architectural trouble. These architecturally pleasant structures with formation deformity, when subjected to destructive earthquake are a matter of concern. The bearing of a building during earthquakes depends reproving on its overall shape, size and geometry, in addition to how the seismic forces are carried to the ground. Sahyadri Engineering college building is used for the case study. A detailed study of this building for gravity loads and seismic loads are investigation and outcome like shear, moment carrying capacity and reinforcements required are differentiate. For the gravity load case a suitable method of retrofitting is approved if it is below production quantity. With better understanding of earthquake demand on structures and with our current experiences with large seismic zone near city centers, the need of earthquake retrofitting is well allow.
Dr. Syed Aqueel Ahmad, Rajiv Banarjee et.al. (2018) , studied that Seismic Analysis &Desiging of G+10 Storied Building by Strut &Staad pro Software with different loading conditions and compared the results. He observed that shear wall should be placed at a point by coinciding the center of gravity and centroid of the building.
Amit Kumar, Krishna Murari et.al. (2014) , Studied that the Seismic analysis & Capacity based resistant design of Multi-storey rigid joint Building Frame in a Staad Pro. He analyzed the 3D RC Frame building (G+6) structure in seismic zone II (Ranchi City) considered the medium soil conditions. He compared and found that the conventional design methods for earthquake resisting structures although this method is little costlier but more effective in resisting the earthquake forces.
Sumit Sharma et.al.( Feb-2018) , Studied that the seismic analysis of G+12 SMRF building by using Staad and Etabs Civil software. He analyzed the structure in the seismic zone IV and the building is tested for the base shear, lateral forces at each storey. He observed that the base shear obtained for the models varies a little and design horizontal seismic coefficient by Staad Pro and Etabs software matched with code.
A Primary Objective of this research works
1) To performed the Seismic Analysis of RC building framed structure by using Staad Prof. software.
2) To comparative Study of Seismic Analysis of Building Frame Structure considered with different zone.
II. MATHEDOLOGY
In the recent time, Civil & Structural software’s analysis is more effectively used in analysis and design of different civil engineering structures. In this work, we using Staad pro software and analyzed the structure as per IS 1893:2002. The following steps are adopted:
[image:2.612.56.532.148.413.2]1) Step-1 Modeling of building frame in Node & Transitional repeat with different type of soils, symmetrical (24.02mX24.02m)G+13 story of 3D frame. Fig. 2.1
Fig. 2.1 Plan of Building
2) Step-2 Selection of Building Geometry: Plan of Building 24.02mX24.02m , Size of Columns 450mmX450mm, Size of Beam
230mm X 450mm, Thickness of Slab 150mm; Height of each floor 3.0m, Unit weight of RCC 25KN/m3, Unit weight of bricks
20KN/m3 and Fixed supports.
3) Step-3 selection of Seismic Zone and soil conditions As per IS Code.
4) Step-4 Load combinations.
Load case no. Load cases
1 DL
2 LL
3 EQ,X+
4 EQ,X-
5 E.Q,Z+
6 E.Q,Z-
7 1.5(DL+LL)
8 1.5(DL+E.Q.,X)
9 1.5(DL-E.Q.,X)
10 1.5(DL+E.Q.,Z)
11 1.5 (DL-E.Q.,Z)
12 1.2( DL+LL+E.Q.,X)
13 1.2 (D.L+L.L-E.Q.,X)
14 1.2 (DL+LL+E.Q.,Z)
5) Step-5 Designing of building frames using STAAD.Pro v8i software in 3D rendered view.
6) Step-6 Analysis considering different types of soil condition providing different seismic zones.
7) Step-7 Comparative the results in the term of storey-wise displacement, shear force, bending moment, node displacement etc.
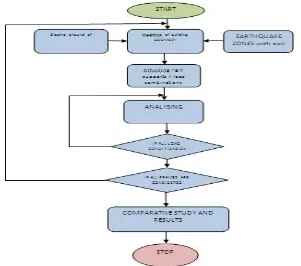
A. Flow Chart Diagram
[image:3.612.167.468.442.708.2]For this Project Work, Flow chart of proposed method of this analysis.
III.RESULTSANDANALYSIS A. Support Reaction:
SUPPORT REACTION IN KN
ZONE SOIL CONDITIONS
SOFT MEDIUM HARD
III 5177.04 5177.04 5177.04
V 5439.906 5177.04 5177.04
B. Maximum Bending Moment
Maximum Bending Moment IN KN-m
ZONE SOIL CONDITIONS
SOFT MEDIUM HARD
III 257.581 222.921 183.667
V 509.944 420.81 323.889
C. Axial Forces
Maximum Axial Force in KN
ZONE SOIL CONDITIONS
SOFT MEDIUM HARD
III 5177.04 5177.04 5177.04
D. Maximum Displacement
Maximum Displacement IN mm
ZONE
SOIL CONDITIONS
SOFT MEDIUM HARD
III 144.852 118.008 86.834
V 325.618 265.218 195.077
E. Shear Forces
Maximum Shear Force in KN
ZONE
SOIL CONDITIONS
SOFT MEDIUM HARD
III 204.076 176.714 148.738
F. Story-wise Node Displacement
Story-Wise Node Displacement in Zone III (mm)
STOREY ZONE-III
SOFT MEDIUM HARD
13th Floor 144.852 118.008 86.834
12th Floor 141.583 115.305 84.789
11th Floor 136.522 111.181 81.752
10th Floor 129.442 105.415 77.512
9th Floor 120.649 98.254 72.247
8th Floor 110.45 89.948 66.14
7th Floor 99.149 80.745 59.374
6th Floor 86.98 70.835 52.087
5th Floor 74.175 60.408 44.421
4th Floor 60.94 49.63 36.496
3rd Floor 47.454 38.648 28.421
2nd Floor 33.88 27.594 20.294
1st Floor 20.434 16.644 12.242
GF 7.85 6.393 4.702
Story-Wise Node Displacement in Zone V (mm)
STOREY ZONE-V
SOFT MEDIUM HARD
13th Floor 325.618 265.218 195.077
12th Floor 318.538 259.411 190.748
11th Floor 307.167 250.149 183.935
10th Floor 291.241 237.179 174.397
9th Floor 271.454 221.065 162.549
8th Floor 248.504 202.376 148.807
7th Floor 223.075 181.667 133.581
6th Floor 195.693 159.368 117.185
5th Floor 166.881 135.905 117.185
4th Floor 137.1 111.653 82.101
3rd Floor 106.754 86.94 63.93
2nd Floor 76.211 62.067 45.641
1st Floor 45.965 37.434 27.527
GF 17.659 14.382 10.575
BASE 0 0 0
IV.CONCLUSIONS
We observed that, the seismic zone III and V the maximum support reaction and axial force is achieved in zone V with soft soil while zone III and Zone V with medium and hard soils support reaction and axial force are same. As comparing the bending moment, shear force and node displacement are observed as maximum in zone V with soft soil but minimum in zone III with hard soil. It means that decreased the seismic zones and change the soft to hard soil, the seismic effect is also decreased. Story-wise displacement, observed that maximum at Zone V with soft soil and minimum at zone III with hard and also founded that story is increased , story-wise node displacement id also increased that mean number storey is proportional to the displacement.
REFERENCES
[1] Vikas Mehta1 , Kanchan Rana2, A Time History Analysis Method for Studying the Multi-storeyed Building Using STAAD Pro International Journal of Civil and Structural Engineering Research ISSN 2348-7607 (Online) Vol. 5, Issue 1, pp: (57-64), Month: April - September 2017
[2] Md. Arman1 Mr. Anwar Ahmad2 Dr. Syed Aqueel Ahmad3 Mr. Rajiv Banarjee4 Analysis & Designing G+10 Storied Building by Struds & STAAD Pro Software & Comparing the Design Results.
[3] Umakant Arya, Aslam Hussain, Waseem Khan, “Wind Analysis of Building Frames on Sloping Ground”. International Journal of Scientific and Research Publications,Issn 2250-3153 Volume 4, Issue 5, May 2014.
[4] B. Gireesh Babu Seismic Analysis and Design of G+7 Residential Building Using STAADPRO,IJRRIIT (Volume3, Issue3)
[5] Vrushali S. Kalsait 1, Valsson Varghese, “Design of Earthquake Resistant Multistoried Building On A Sloping Ground”. IJISET - International Journal of Innovative Science, Engineering & Technology,ISSN 2348 – 7968. Vol. 2 Issue 7, July 2015
[6] Paul D.K. and Kumar S. Stability Analysis of Slope with Building Loads. Soil Dynamics and Earthquake Engineering, 16, 395-405,(1997).
[7] Vijaya Narayanan,et. al, “Performance of RC Buildings along Hill Slope of Himalaya during 2011 Sikkim Earthquake”, EERI Newsletter, EERI Special Earthquake Report,1-14, February 2012.