“What makes you happy?” Evaluating an intervention aimed at promoting social participation of lonely people: Identifying concepts that can serve as building blocks of self-chosen activities and developing and testing a questionnaire to measure the success of these activities.
Sarah Kedzia, s0129577
University of Twente, Enschede, the Netherlands Master thesis, Health and Risk Psychology
Docents:
Acknowledgements
First of all I want to thank Marcel Pieterse and Stans Drossart for the great supervision of this article and for spending so much time with consultation with me.
I also have to thank the organisation Arcon, especially Nicole Schrijver and Aad Francissen, for giving me the chance to evaluate this project and helping me to solve with every problem that arised during the course of this study. I had a real good time while working in the organisation, and I thank all employees for being so friendly to me. Big thanks also go to Gerard Nordkamp en Leni Claessens from the municipality Almelo for recruiting most participants of this study and letting me get information of the dossiers.
Last but not least my greatest thanks goes to my incredible family. I would never be able to write these words, if they had not continiously belived in me and supported me.
Abstract:
Background: Loneliness is a highly prevalent problem related to various consequences for physical and mental health. This problems needs to be addressed as loneliness is increasing.
Objectives: This paper evaluates the “happiness-budget” that aims at reducing loneliness in a sample of chronically physically and mentally ill. This budget is used to execute self-chosen activities. Additionally a questionnaire intended for longitudinal research within this project was presented, tested for its suitability and used to describe the study group.
Methods: Two studies were executed; the first was descriptive in nature and took the form of a dossier analysis in order to describe the population and executed activities. The second study was an extended pre-test of a questionnaire developed to measure effects of the programme within the sample of lonely people. Aims of this study were to describe the population regarding to the concepts assessed with the questionnaire and to test whether the questionnaire could be filled in by all participants.
Results: Executing activities that enabled people to make new contacts and new experiences were most popular. The high occurrence of disease and socially related activities showed the will to fight disease as well as loneliness. Neurological and orthopaedic diseases were the most prominent disorder for the somatic population; the psychiatrics all suffered from psychological problems with some somatic co morbidities. The sample was found to be severe isolated, but on average mentally quite healthy. The questionnaire could be filled in by nearly all participants within a reasonable amount of time.
Conclusion: The happiness budget was used in a highly functional, curative way.
Table of contents
1. INTRODUCTION 6
1.1. Factors associated with loneliness 7
1.2. Overview over interventions to reduce loneliness 10
1.3. A new approach: the happiness budget 12
1.4. Theoretical framework for the happiness budget: Positive psychology 14
1.5. Research Questions 16
2. METHODS 17
2.1. Study one: Dossier analysis 17
2.1.1 Procedure 17
2.1.2 Coded Variables 17
Demographic variables 17
Disorders 17
Functional disabilities 19
Chosen activities 19
2.1.3 Data Analysis 21
2.2. Study Two: the Questionnaire 22
3. RESULTS 25
3.1. Study one: Dossier analysis 25
3.1.1 The dossiers 25
Coded Variables 26
Disorders 26
Overview over diagnosed disorder of 80 profiles 27
Functional disabilities 27
Overview over functional disabilities of 80 profiles 28 3.1.2 Relations between disorders and functional disabilities 28
3.1.3 Activities 29
3.1.4 Relations between activities and diseases / functional disabilities 32
3.1.5 Conclusion 34
3.2. Study two: the Questionnaire 35
3.2.2 Loneliness 35
3.2.3 Mental Health 36
3.2.4 Participation and autonomy 37
3.2.5 Purpose in Life 38
3.2.6 Self rated health 39
3.2.7 Internal properties of the questionnaire 39
3.2.8 Disorders and Functional Disabilities 43
3.2.9 Activities chosen 44
3.2.10 Conclusion 46
4. CONCLUSION 47
5. DISCUSSION AND IMPLICATIONS FOR FURTHER RESEARCH 50
6. LITERATURE 52
7. APPENDIX I: THE QUESTIONNAIRE 58
1. Introduction
Loneliness is a problem that is highly prevalent in many countries, as for example in the Netherlands. Research done by Machielse (2006) revealed that 8 per cent have only a minimum of social contacts and 22 per cent are lonely. Moreover 6 per cent of the Dutch adults are socially isolated.
Loneliness was formulated by Perlman and Peplau (1981) as “the unpleasant experience that occurs when a person’s network of social relationships is deficient in some important way, either quantitatively or qualitatively” (p. 31). Forbes (1996) described loneliness as an unwelcome feeling of lack or loss of companionship. It is a feeling of being alone and not liking it. Loneliness is the situation that occurs from a lack of quality relationships and can be divided in two subsets, emotional loneliness, stemming from the absence of an intimate relationship or a close emotional attachment (e.g., a partner or good friend), and social loneliness, resulting from the absence of a broader group of contacts or an engaging social network (e.g., friends, people in the neighbourhood) (Weiss, 1973). People can have social relationships, but when they are deficient in their quality, they will experience loneliness. The opposite of loneliness is embedded ness (de Jong Gierveld & van Tilburg, 2006). Loneliness is related to social isolation that refers to an objective situation that can be characterized through the absence of any social relationships to other people. It is one extreme of a continuum that puts social isolation on the one end and social participation on the other (de Jong Gierveld & van Tilburg, 2006). The concept of social isolation is a very complex one and up to now only little investigated. It can have a variety of reasons (psychological, physiological and economical) and apply to the whole population. However, with growing age or chronic disease the risk to become enduring lonely also grows, and indeed 12 per cent of people older than 65 is social isolation (Hortulanus, Machielse & Meeuwesen, 2003). With the main part of the society becoming older and more often sick the health costs will rise dramatically over the next years. Whereas in the Netherlands the percentage of people older than 65 now is about 14.5% it is expected to rise up to 20% by 2020 and 25% by 2040 (Centraal Bureau Statistiek, 2007). Worldwide the trend is that people are getting older and live longer. As will be shown in the next section, being extreme lonely has serious consequences for health and can aggravate existing disorders. Thus, even though this paper focuses on people suffering from chronic disease, the need to address loneliness is evident with respect to the demographic change in our society. This study specifically concentrates on chronically ill people who acquired chronic diseases that contributed to the status of loneliness.
social isolation and loneliness. But in the following chapters it both concepts will be referred to as “loneliness” to avoid confusion for the reader.
There is evidence that loneliness is a risk factor for enhanced morbidity and mortality. Therefore it is important to investigate the causes and consequences of loneliness and to develop programmes to overcome loneliness.
Hence, in the first part of this thesis the known causes and consequences of loneliness as well as existing interventions will be described and debated. A new programme to reduce loneliness, the happiness budget, will be introduced and evaluated in this thesis and its underlying theoretical assumptions will be explained in detail.
In the second part the methodological design of the study and the results will be presented and discussed. The programme will be evaluated and a questionnaire that is intended to measure psychological effects of the “happiness budget” is going to be introduced and tested in study two. Recommendations for the further development of the programme will be given.
1.1. Factors associated with loneliness
In this part, first the disorders that contribute to loneliness will be explained, then a general overview over factors associated with loneliness will be given, because it is not always clear which factors can be seen as risk factors for or consequences of loneliness. This study focuses on people who suffer from a chronic disease (or psychological disorders) and in consequence have only a minimum of social contacts: although a special focus lies on neurological disorders, nearly all kinds of chronic diseases can lead to loneliness. People who suffer from acquired neurological disorders or other chronic diseases have to face a lot of problems, as for example bad movement and neurological problems. Research had proven that physical disabilities often lead to loneliness (Rokach, Lechcier-Kimel, Safarov, 2006).
Also mental illness can lead to a lot of problems, including loneliness (SANE Research Report, 2005). People with mental illness report that although social relationships are very important to managing one’s illness (62% ‘very important’, 26% ‘important’) they find it much harder to maintain close relationships (55% ‘much harder’, 30% ‘a bit harder’). They frequently attribute it to stigma and misunderstanding in their environment. As a consequence over two-thirds of people affected by mental illness reported to be lonely ‘often’ or ‘all the time’ (SANE Research Report, 2005).
per cent were defined as mentally unhealthy or languishing. These 17 per cent frequently reported to have various mental disorders, as for example a major depressive episode (28%), a panic disorder (16 %) or generalized anxiety disorder (10 %). By combining these two groups, 7 per cent (N = 214) were categorized as ‘mental illness and languishing’ and 16 per cent (N = 484) as ‘pure mental illness’. Both groups reported to be strongly limited in activities of daily living, and work, in setting goals and in looking out for the future. People who were categorized as having a mental illness and being languishing reported to have more and severe problems than the pure mental illness group. More than twice as many people of the first group felt helplessness in dealing with daily problems and felt that they could not change things in life (Keyes, 2005).
Other risk factors of getting lonely are age, being male and living in a nursing home or living without a partner and feeling unhealthy (Tijhuis, de Jong Gierveld, Feskens & Kromhout, 1999). The effect from gender on loneliness is not clear, because different studies report different gender as risk factor for loneliness. Whereas Tijhuis et al. (1999) points out that being male is associated with loneliness, Savikko, Routasalo, Tilvis, Strandberg and Pitkala (2005) reports that being female was more related to loneliness. In their study Savikko et al. (2005) collected data from 6786 elderly people in Finland. Loneliness was measured by one item (do you feel lonely?) and 5 per cent of the population characterized themselves as being often or always lonely. Factors that were significantly related to report being lonely were being female, widowed, having a poor income, living at residential homes and in rural areas. They also suffered from bad health, had a high need for daily help with domestic activities and did not do daily outdoor activities. Participants were asked about the causes for their loneliness. Own sickness, absence of friends and relatives as well as a meaningless life were the main causes attributed to loneliness (Savikko et al., 2005).
Having a heart disease could also contribute to loneliness. In one study by Sorkin, Rook and Lu (2002), participants were examined by a physician and were asked to answer a questionnaire that measured loneliness. Those who reported to feel lonely or to be lonely frequently showed to have a heart condition. The relation was so strong that increasing loneliness was linked to a heightened chance of having a heart condition. Self reported health status was a possible explanation for this link, because those who rated themselves as having a serious heart condition were found to be lonely (Sorkin et al., 2002). Maybe protective behaviours, such as staying at home and not doing too many things reduce contacts and promote loneliness.
(Becker, 1976) they found out that providing support to family members was significantly related to lower loneliness scores.
So, being physically or mentally disabled, living without a partner or in residential homes, and living in an insecure neighbourhood are all factors that contribute to becoming lonely or lonely. One of the most prominent concepts associated with loneliness is depression. The direction of this effect is not yet clear, but Cacioppo, Hughes, Waite, Hawkley and Thisted (2006) described loneliness as risk factor for depression, and suggested that although depression and loneliness are two separate constructs they can exert synergistic effects on mental well-being. Vandervoort (1999) found that depression is strongly related to loneliness. Loneliness also increases the mortality risk associated with depression. When depressive people perceive themselves as being lonely the mortality risk is 2 times higher than normal (Stek et al., 2004). This shows that the two concepts are not only related to each other, moreover, their effects on mortality seem to compound. Another factor that contributes to loneliness also is associated with depression: medical co morbid functional disability. Disability was most strongly associated with depression (McDougall et al., 2007). Being lonely or severe lonely has a strong impact on health: it can aggravate existing disorders and seem to contribute to the emerge of new ones. For example, loneliness turned out to be a predictor for differences in systolic blood pressure (Hawkley, Masi, Berry & Cacioppo, 2006). Loneliness, depressive symptoms, perceived stress and hostility were all significantly related to systolic blood pressure. The effect of loneliness on blood pressure became stronger with age; so that age and loneliness combined were the most significant predictors of heightened systolic blood pressure.
physical disease and loneliness (Rijken & Groenwegen 2006; Routasalo, 2006). De Jong Gieverld and Scharf (2008) conducted a study to test whether the direct environment, thus the neighbourhood contributed to loneliness. They found that objective neighbourhood characteristics exert a significant influence on participation. A neighbourhood high in urbanisation and low in financial status was positively related to the intensity of isolation. They also found out that a cognitive process of subjective elaboration mediates the relationship between loneliness and neighbourhood. Thus if inhabitants feel that their neighbourhood is not secure they wont go out as much as they would do if they had the feeling that their neighbourhood was safe. As chronically ill frequently can not do paid work they are more likely to live in neighbourhoods that can be characterized as being low in financial status, which would enhance the level of loneliness even more.
It was already concluded that older or chronically disabled people have a higher risk of becoming isolated, as they frequently live without a spouse, in residential homes and are more often physically or mentally disabled. On average their socio-economical status is low, due to old age pension or restricted capability to do paid work. Bad health inevitably contributes to loneliness and surely someone disabled and lonely has a heightened chance of getting depressed.
Being extreme lonely or lonely has a variety of consequences which become more and more important in the light of the growing number of people, who have a high risk to become lonely (Hortulanus et al. 2003). The older people get the more diseases they acquire, and the more diseases they have, the greater the chance of getting depressed or feeling languished (Keyes, 2007).
Moreover, the consequences of loneliness, such as heart problems or heightened blood pressure will affect older or chronically ill people more strongly than younger or healthy ones. These findings together with the elevated risk on depression and suicide strengthen the problems that loneliness poses to a society that is steadily growing older and more anonymous.
The conclusion that can be made here is that it is of high importance to find means to address this problem and to bring lonely people back into a fulfilled social life. Interventions have to be addressed to the sample of chronically disabled people, as they can not help themselves. The following paragraph will give an overview over existing interventions.
1.2. Overview over interventions to reduce loneliness
indicated that involving older women in a friendship program led to a moderate improvement in self-esteem, life satisfaction and positive mood. The programme consisted of 12 lessons including theory about and practice in skills needed for making friendships (self esteem, improving existing friendships), role playing of difficult situations and homework. Six month later 63% of the participants in the friendship programme reported that they had made new friends, 55% still had contact to other women of the programme. Also existing friendships were improved. The most significant effect after 6 month was an improvement in mood and positive affect. Also the decline in loneliness scores and negative affect was significantly, which suggests that involving women in a friendship program was successful in reducing loneliness (Martina & Stevens, 2006).
Fokkema and Knipscheer (2007) tested in their study whether the use of the internet could reduce feelings of loneliness. They gave their sample of 15 Dutch seniors free access to the internet for three years, training in how to use the PC, offering a volunteer that could be reached anytime when problems would arise. Volunteer visits were kept at a strict scheme in order to avoid the Hawthorne effect (loneliness would have decreased because of visits not because of cyberspace use). Though loneliness decreased the effect was only significant for the better educated, and 7 of 15 people dropped out of the study. From some qualitative analysis it could be concluded that the internet is an opportunity for disabled to get and stay in contact with others. Most participants stayed in contact with their family and friends. However, the internet gave them a way to cope with their loneliness by distracting them. Once the participants mastered using a PC and the internet they felt confident about and satisfied with the medium. They also used the internet to play games, search for information or write emails. So while internet did not succeed in making social contacts it did succeed in distracting people and giving them new means to spend time (Fokkema and Knipscheer, 2007).
In total, not much literature could be found. Of the programmes found, virtually no intervention specifically targeted loneliness in the group of chronically ill or has the goal to enhance happiness of these people. The literature that was found indicates that the internet is not a good mean to reduce isolation. Also one-to-one interventions that take place in the lonely people’s homes do not enable people to take control over their problems do not seem to work. Apparently factors such as teaching people how to get back into social participation without doing all the work for them seems to be more successful (Martina & Stevens, 2005; Cattan et al., 2005). Targeting the group of chronically disabled, lonely people, helping them to overcome the first barriers, without taking all control and autonomy away seems to play a crucial role. This is still missing in most programmes and a main reason why this study will evaluate a new programme, the happiness budget.
1.3. A new approach: the happiness budget
In the Netherlands a project started that aims at reintegrating lonely people to the society or at least promote social participation, called the “Geluksbudget”, which means: happiness budget. This project is under the guidance of different communal instances and the organization ARCON, which organizes the training of the involved persons and supervises the project. The implementation of the intervention is done by the communities themselves (see Toolkit Geluksbudget, 2008). The communities work with an individual budget of maximal 450 Euro that is given to people who have fulfilled the criterion of being in enduring loneliness. With this budget individual, self-chosen activities can be executed, which will be explained below in more detail.
Because of their physical condition participants got medical treatment for a certain period, and the doctors and nurses, as well as municipality workers can decide to suggest these people as candidates for the project. If they do so, the isolated person is enlisted in its municipality and a trained consultant makes an appointment for an interview. To assess wishes, needs and problems of the isolated person a consultant comes home to the people and interviews them. Above it was stated that one-to-one interventions that take place in people’s homes were found to be generally ineffective in reducing loneliness (Cattan et al., 2005), so the reader should keep in mind, that this is not the whole intervention but only the intake procedure. Afterwards the consultant makes up a dossier of this person (which gives information about the disorder, functional disabilities and chosen activities for the budget) and then decides whether they get the budget or not. Until today only one candidate was rejected after the first interview. In consultation with the isolated person the consultant assesses the evident problems of that person and asks whether the client has a wish for an activity that could help bringing him or her back to social participation. Examples for activities are theatre cards, or a membership in a dance club. One man wished to have a second hand moped so that he could be more independent and decide when and where he wanted to drive.
The approach is demand-driven, that means participants decide which activities they want to use the budget. The intent is that if people can think of something they really like to do, than they could be helped realizing their dream. If this succeeds, than they would feel better about themselves and their lives and get back something they can look out for. Until today, no research has been conducted that asked whether it is crucial for the success of this kind of intervention which activities people chose, or if it is enough that they have the mere ability to chose and decide something on their own. Maybe this is already enough to enhance self esteem and activate people to actively seek for social contacts. This is an interesting question, because the ultimate goal is to enable people to participate in social life, enhance happiness and minimize health costs. As mentioned above, research has proven the link between being lonely and visiting the doctor, or a specialist. Moreover the intervention should lead to positive emotions, which in turn are connected to a higher quality of life and lower mortality rates. It is also a significant predictor against institutional care (Pitkala, Laakonen, Strandberg & Tilvis, 2003).
Additionally, this papers aims at identifying and exploring the concepts of activities that could explain eventual effects of the intervention.
1.4. Theoretical framework for the happiness budget: Positive psychology
The project is based on the notion of positive psychology, and assumes that lonely people do know for themselves what needs to be done to get them back into social life. The following paragraph will briefly present this theoretic framework.
The field of positive psychology concerns three levels: the subjective level, characterized by valued subjective experience (well-being, hope and optimism), the individual level that is about positive individual traits (capacity for love, courage forgiveness) and the social level relating to civic virtues (responsibility, altruism, nurturance) (Seligmann & Csikszentmihalyi, 2000).
One question that is central to positive psychology is: What is happiness? Seligmann, Parks and Steen (2004) tried to define concepts that could be empirically measured and arrived at three components of or “routes to” happiness, which are based on the factors mentioned above: (1) pleasure or positive emotion, (2) engagement; and (3) meaning (Seligmann et al., 2004; Peterson, Park & Seligmann, 2005).
The first factor, pleasure is hedonic, increasing positive emotion. It is concerned with positive affectivity and how people interpret and react to events. In the introduction it was noted that people can feel lonely even with many people being around. This highlights the impact of positive emotion in the interpretation of a situation and its contribution to the negative consequences that loneliness has.
The second factor, engagement involves the pursuit of gratification. By completely committing ourselves to a job or activity we become fully absorbed in this activity and find gratification. Pursuit of gratification may not be accomplished by positive emotions (executing a physically straining activity), but that reaching our goals (complete the activity) makes us feel satisfied and fulfilled.
Whereas the first two routes do not imply more than the self the third route to happiness comes from using these strengths (positive emotion and engagement) to belong to something larger than one individual person, such as: religion, politics, family or friends. These higher instances give our life meaning as it satisfies our longing for purpose in life and belonging to something or someone (Seligmann et al., 2004, Peterson et al., 2005), which is one core ingredient lonely people are missing.
Moreover, research by Seligman et al., 2005 has proven that it is possible to enhance happiness by simple interventions. For example, they delivered small interventions via the internet. Participants were asked to write down three good things that went well each day and were asked to provide causal explanations for these events. A second intervention asked participants to identify their most prominent character strength via a test on the internet site and were then asked to use this top strength in a new and different way each day of the week. Participants had to complete happiness and depression tests 6 times, the first before making the internet test, the last after 6 month. Results revealed that these 2 exercises enhance happiness significantly and that this effect even rises over a period of 6 month. Depression was significantly decreased, and here too, the effect grew stronger with time (Seligman et al., 2005). By simply asking people to become aware of good things and personal strength they succeeded in making people happier. This shows that people can be made happier with quite small interventions.
What are the factors that could make the happiness budget effective?
Using the paradigm of the three concepts of happiness (Seligmann, 2004; Peterson et al., 2005) the following points are assumed:
1.5. Research Questions
So following research questions remain:
(1) What types of activities did candidates chose in the last years? a) Can valid concepts be established to describe the activities? b) Can these concepts be related to disorder?
(2) How can the people participating in this programme be described concerning disorder, functional disabilities and outcomes of the questionnaire?
(3) Is the questionnaire suitable for longitudinal use in this population? Are all participants able to understand and answer all questions?
The study is set up to answer these questions, and will employ the design of a dossier analysis in study one and an extended pre test to test the developed questionnaire in study two. Until now no instrument to measure effects that the happiness budget has are available and this is why this study introduces a questionnaire that can be used for long term research. In the form of an extended pre test the questionnaires suitability for the use within the population of lonely and chronic disabled was tested.
2. Methods
2.1. Study one: Dossier analysis
2.1.1 Procedure
The Dutch municipality Almelo had started in 2000 with the “happiness budget”. In 2009 other municipalities in the Netherlands also started to implement the project, but still Almelo had the most people enlisted for the budget, so data gathering took place in Almelo.
80 dossiers were analyzed, though 94 people had received the happiness budget in the last years, only these dossiers were available for the investigator. The information that was taken out of the dossiers was sensitive, as it involved the kind of disorder, functional disabilities, address and demographic variables of the candidates.
The researcher was supervised by someone working at the municipality in order to ensure that private data was kept anonymous and not taken pout of the office.
A code scheme was used to extract a person's age, gender, disorder, the problems associated with this disorder in daily life (functional disabilities), the activity chosen and the amount of money that was spent. Only 47 dossiers contained information about age, and one was missing information about gender, as well as the budget spent. Two populations that had received the budget in the last years were identified: people suffering from pure physical illness and a psychiatric group that were identified by psychological disorder. Both populations differ on some important points (disorders and the related problem) they will be analyzed separately concerning these points. On the other hand, because both groups form the “lonely”, they can be analyzed together in order to describe the population. Whenever groups will split up for analysis this will be noted.
2.1.2 Coded Variables Demographic variables
First age and gender were taken out of the profiles. Gender was coded into 1 = male and 2 = female.
Disorders
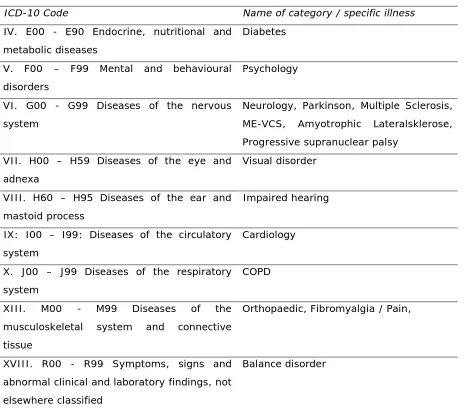
used to establish valid categories. Taking the Internal Classification of Diseases version 10 as a guideline the great variety of diseases was reduced to eight general categories and four for specific diseases that were occurring frequently within the population.
[image:18.595.69.536.212.624.2]For an exact overview of the categories see table 1.
Table 1
Overview over classification of disease categories
ICD-10 Code Name of category / specific illness IV. E00 - E90 Endocrine, nutritional and
metabolic diseases
Diabetes
V. F00 – F99 Mental and behavioural disorders
Psychology
VI. G00 - G99 Diseases of the nervous system
Neurology, Parkinson, Multiple Sclerosis, ME-VCS, Amyotrophic Lateralsklerose, Progressive supranuclear palsy
VII. H00 – H59 Diseases of the eye and adnexa
Visual disorder
VIII. H60 – H95 Diseases of the ear and mastoid process
Impaired hearing
IX: I00 – I99: Diseases of the circulatory system
Cardiology
X. J00 – J99 Diseases of the respiratory system
COPD
XIII. M00 - M99 Diseases of the musculoskeletal system and connective tissue
Orthopaedic, Fibromyalgia / Pain,
XVIII. R00 - R99 Symptoms, signs and abnormal clinical and laboratory findings, not elsewhere classified
Balance disorder
Diseases were coded 1-14, because some disorders were not only allocated to the whole chapter (Muskoskeletal system) but also on the subparagraphs (fibromyalgia, M79).
Functional disabilities
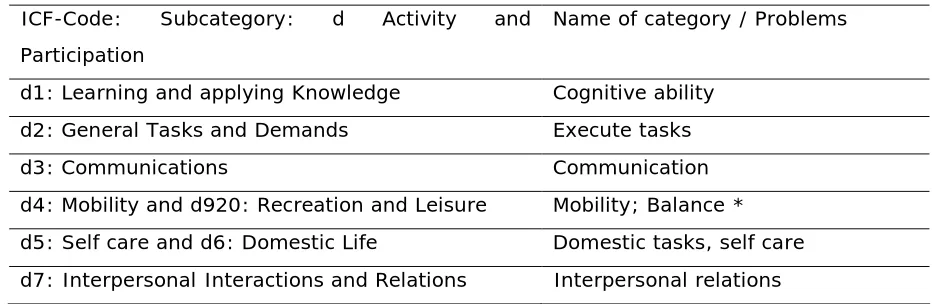
[image:19.595.62.530.335.487.2]For quantifying the specific problems that clients had with their disorder seven categories were established using the online version of the International Classification of Functions by the World Health Organisation based on their relationship to the disorders and frequency of occurrence. For example, having problems with the cognitive ability should be related to suffering from neurological diseases and summarizes all the abilities like learning, thinking, or planning. Moreover it was frequently mentioned by the clients. Having problems in fulfilling domestic tasks can relate to a variety of disorders, but was so frequently used, that it was included in the list. See also table 2 for an exact overview over the categories.
Table 2
Overview over classification of functional disabilities ICF-Code: Subcategory: d Activity and Participation
Name of category / Problems
d1: Learning and applying Knowledge Cognitive ability d2: General Tasks and Demands Execute tasks
d3: Communications Communication
d4: Mobility and d920: Recreation and Leisure Mobility; Balance * d5: Self care and d6: Domestic Life Domestic tasks, self care d7: Interpersonal Interactions and Relations Interpersonal relations * was employed as extra category because of frequent occurrence
Chosen activities
Quantifying the activities was more difficult, because people could choose specific ones like going swimming join a dance club and visit a museum with the family. Or doing art work, buy a second hand scooter and have a volunteer that helps doing shopping. The main problem was: how can categories be established that are important for this study and that are vital to determine the effectiveness of the budget?
describe the underlying phenomena. Next step was assigning dimensions (more or less present, location of property on a continuum) to these concepts.
Using the approach of grounded theory by Strauss and Corbin (1998) 10 different concepts underlying the activities were identified with respect to the background of chronic disease and loneliness. These were respectively:
Social Participation: Is social participation promoted? Is the action done solitary (low), with someone (medium) or does the candidate join a network (high). Someone who goes swimming on one’s own is doing something different than someone who does this with a friend or volunteer.
Making new contacts: Does the activity promote making new contacts? Or has someone chosen for doing something with the family (low), with friends and neighbours (medium), or with totally unknown people (high). This dimension taps the presence of other people.
Being physically active: was the candidate physically active? Did they do sitting activities (low), activities that forced them to move, walk around (medium), or did they do sports (high)?
Differences here may be obviously between doing a computer curse, going to the zoo or joining a fitness club.
Making new experiences: Did the activity leave a “picture in mind”? What kind of experiences did people make (new-but-not-rare, or new and rare). All activities do leave some new impressions in the candidates mind, here intensity was concerned. For example, participating in a patchwork-curse is a new but not rare experience, whereas visiting the museum or theatre would leave a bigger “picture in mind”. Here only two dimensions were established: medium (new but not rare) and strong (new and rare). Going out: Where did the activity take place? Was the candidate staying home (low), was he going to known places (medium) or was he visiting a new, unknown place (high). Becoming mobile: Did the activity explicitly concern statements about mobility? Did the candidate get a driver service (low) or did he buy a motor in order to become mobile on long term (high)? Again only these two dimensions were used and unfortunately many dossiers did not contain that information.
Learning / improving cognitive ability: How much did the activity play on cognitive ability? Was someone more passively participating in an activity (walking with a volunteer) (low), was someone watching a theatre play (medium) or was he learning a new language (high)? Of course this dimension can also be characterized as being “disease related” for someone with neurological disorder, but for this is not true for someone with an orthopaedic disorder.
orthopaedic disorder wished to have a season-card for his favourite football-club), was it indirectly related or was it directly related (someone with orthopaedic disorder does medical fitness).
Doing it autonomous: how much help did someone need in order to realize the activity? Did he need help with planning and realization (low), did he need help with realization (medium) or was the whole activity realized on someone’s own (high) ?
Duration of the activity: How long could the activity be done? Once (low), up to 6 month (medium) or longer than 6 month? Did someone go away for a weekend (once), did they participate in any kind of course (medium), or did they buy a bicycle (long).
160 Activities could be identified during the dossier analysis. 2 dossiers were missing information about the activities, so that on average every one chose for 2 activities, range was between 1 and 4. They were coded into the 10 categories and degrees of presence (0-3), 0 = information was not available, 1 = weak presence of the concept, 2 = medium presence of the concept, 3 = strong presence. The coding was done manually by the author. In order to ensure reliability of the categories 10 dossiers (in anonymous form) were later given to two social researchers who were made familiar with the topic and the coding scheme. Interrater reliability turned out to be 0.68 and 0.72.
2.1.3 Data Analysis
Results were analyzed using the Statistical Package for the Social Sciences 16.0 (SPSS). Diseases and functional problems were coded following the Classification of diseases and functional disabilities. The average of presence of the different concepts was calculated for all 160 activities and for each dossier (N = 80). As said above, in order to ensure reliability of the categories, two social researchers later scored 10 dossiers to make statements about interrater reliability.
2.2. Study Two: the Questionnaire
2.2.1. Participants and Procedure
Data gathering took place between April 2009 and July 2009. Consultants were instructed to tell all new candidates during the intake interview that a new measurement was available and to ask whether they wanted to participate in a study testing it´s suitability. In case they agreed the consultants sent dossier to the researcher, where disorders, functional disabilities and wishes concerning activities were mentioned. The content of the dossiers is identical to the ones used in the first study. Special envelopes that were explitely addressed to the researcher were used to be able to ensure privacy of the documents. 120 envelopes were sent to 6 Dutch communities that were participating in this study. Response rate was 10 %. This was mainly due to the procedure of enrolment for the study and kind of population, because the participant self had to agree to take part in this study and the consultant had to decide whether participants could handle the extra stress of having someone visiting them. Possible problems associated with such a selective sample will be discussed later in more detail. Additionally, most municipalities had just started with implementing the happiness budget and did not have had many participants. Only 2 participants in this study came from new starting municipalities and 10 from the only one that had started earlier (Almelo).
After receiving these dossiers the researcher called the candidates to make an appointment and then visited them home. They first got information about the content and aim of the study and had to sign an informed consent. Researcher and candidate sat in a one-to-one situation at a table and filled in the questionnaire together. The general procedure was that the candidate read the questions aloud and indicated his or her agreement with it on the scale, but for some candidates the procedure had to be altered a little. For example some candidates had problems with writing, for example due to arthritis. Then they verbally stated their answer and the researcher marked it.
2.2.1. The Questionnaire
This questionnaire was invented to be an instrument for longitudinal research to be able to detect effects of the happiness budget. Of course loneliness had to be employed in the study, so that a decrease in loneliness could be measured. Because loneliness exerts strong effects on general mental health (Depression, low life satisfaction, higher suicide rate) it was decided to take this construct in the questionnaire, so that improvements in the mental state could be discovered. Another question of interest was, whether the life of chronic disabled lonely people has any meaning to them, and whether this could be changed through the project. Of course the ability to move around in and outdoors is important, so this was employed too. Last, a self rating of health was taken into the questionnaire.
The measures for all these concepts are explained below, the final version of the Questionnaire is attached in Appendix I.
Social and emotional loneliness was measured by the 11 item scale for overall social and emotional loneliness by De Jong Gierveld and van Tilburg (1999). The list consists of 2 subscales that calculate social (5 items) and emotional (6 items) loneliness. In this study internal reliability of the scale was found to be satisfying: .76
Van Tilburg and de Jong Gierveld (1999_2) gave the following instructions to interpret the results of the loneliness scale: Scores between 0-2 distinguished lonely from not lonely people (68% elderly Dutch people), scores between 3-8 indicate mediocre loneliness (28%), between 9-10 they indicate severe loneliness (3%) and scores higher than 11 meant that a person is extremely lonely or lonely (1%).
Mental Health was measured with the Dutch version of the Mental health Continuum Short Form (MHC-SF), which consists of 14 items (Westerhof & Keyes, 2008). The mental health continuum short form identifies three broad factors underlying mental well being, as there are: emotional (items 1-3), social (items 4-8) and psychological (items 9-14) well being. It views mental health as a syndrome of symptoms of positive feelings and positive functioning in life (Keyes, 2002).
Mean scores of each subscale are given by Westerhof and Keyes (2008), for the subscale emotional well being they give 4.7 (SD = 0.9), for the subscale social well being Westerhof and Keyes (2008) gave 3.3 (SD = 1.0); on subscale psychological well being they give 4.2 (1.0).
Physical health and mobility: was measured with the three items of the subscale “autonomy outdoors” and two items of the subscale “autonomy indoors” of the Impact on Autonomy and Participation Questionnaire (IPA) by Cardol, de Haan, van den Bos, de Jong, de Groot (1999; Cardol de Haan, van den Bos, de Jong, de Groot, 2002). The items concern the capability to move indoors and outdoors where and when one wants and was of special interest for communities guiding the project. Because this measure will be used to track changes over time, so no norm values were taken. Scale reliability in this study turned out to be .693, which can be attributed to the fact, that items from two different scales were used.
Meaning in ones life: was assessed using the Purpose in Life Index by Crumbaugh and Maholick's (1964; Crumbaugh, 1968) Purpose in Life (PIL) test is designed to measure an individual's experience of meaning and purpose in life. Each of the twenty items is rated on a 7-point scale and total scores therefore range from 20 (low purpose) to 140 (high purpose) (Seeman, 1991). Examples of the 20 items include: "I am usually: completely bored (1) --- enthusiastic (7)”. Seemann (1991) stated that a score of 20 (scoring 1 on every question) indicates a low purpose in life whereas 140 (scoring the full 7 points on every question) represented having found a full purpose in life. It differed from the proposed mean value given by Ebersole and DePaola for active married elderly people (1989) respectively 117.6. Internal reliability turned out to be high: .92.
Subjective Health: Was measured by one extra Item: which mark do you give your health? The item could be scored on a scale from 1-10, 1 indicating poor health and 10 indicating best health.
A questionnaire assessing depression could not be employed in this study due to practical considerations: the questionnaire had to be kept short and manageable even for the most impaired participants but still had to assess a wide spectrum of variables.
2.2.2. Data Analysis
Results were analyzed using the Statistical Package for the Social Sciences 16.0 (SPSS).
classification of diseases and functional disabilities. Then activities were coded into the 10 categories into degrees of presence (0-3).
Cross tabs were computed for the most dominant diseases and functional disabilities, in order to detect significant correlations.
Special attention was paid to the results of the think-aloud procedure, where participants were asked to voice out any thought they had concerning the questionnaire. The results were analyzed qualitatively.
3. Results
3.1. Study one: Dossier analysis 3.1.1 The dossiers
First gender and age were assessed, information about gender, disorder and functional disabilities was available in every dossier, 78 contained information about the executed activities and 47 of 80 dossiers about age. Two different populations were involved, 70 dossiers came from the chronic disabled, and 10 from the psychiatric population.
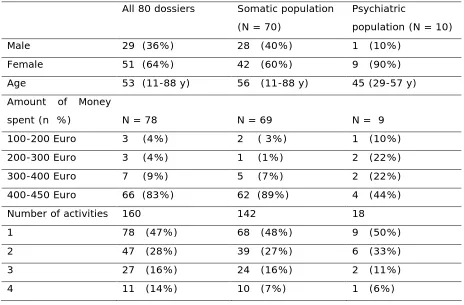
The population is mainly female; in the psychiatric population even 90 per cent are female. The chronic disabled display a higher variation in age than the psychiatric population. Table 3 shows that most people used the full amount of money (450 Euro) and more than half of all participants executed at least 2 activities. Psychiatric participants more frequently stayed under 400 Euro and on average they chose for a smaller number of activities per person.
Table 3
Demographic information of the dossiers
All 80 dossiers Somatic population (N = 70)
Psychiatric
population (N = 10)
Male 29 (36%) 28 (40%) 1 (10%)
Female 51 (64%) 42 (60%) 9 (90%)
Age 53 (11-88 y) 56 (11-88 y) 45 (29-57 y)
Amount of Money
spent (n %) N = 78 N = 69 N = 9
100-200 Euro 3 (4%) 2 ( 3%) 1 (10%)
200-300 Euro 3 (4%) 1 (1%) 2 (22%)
300-400 Euro 7 (9%) 5 (7%) 2 (22%)
400-450 Euro 66 (83%) 62 (89%) 4 (44%)
Number of activities 160 142 18
1 78 (47%) 68 (48%) 9 (50%)
2 47 (28%) 39 (27%) 6 (33%)
3 27 (16%) 24 (16%) 2 (11%)
4 11 (14%) 10 (7%) 1 (6%)
Coded Variables
Coded variables in this study were: Disorders, functional disabilities and the activities chosen.
Disorders
As in many dossiers more than one disorder (1.9 on average) was present, the total number of all disorders adds up to 153.
The population shows a high degree of orthopedic, neurological and cardiologic
disorders. More than a half of the dossiers mentioned neurological disorder, and about 40 per cent orthopedic.
Table 4
Overview over diagnosed disorder of 80 profiles
Disorder All dossiers
(% total disorder) (% total dossiers)
Somatic
(% total dossiers)
Psychiatrics (% total disorder)
Neurological Orthopaedic Cardiologic Diabetes Psychological Pain / Fibromyalgia Balance COPD Visual disability Impaired hearing Parkinson Multiple Sclerosis Total amount
43 (28%) (53%) 31 (20%) (38%) 14 (9%) (17%) 13 (8%) (16%) 13 (8%) (16%) 11 (7%) (13%) 10 (6%) (12%) 7 (4%) (9%) 5 (3%) (6%) 2 (1%) (2%) 2 (1%) (2%) 2 (1%) (2%)
153
40 (57%) 29 (41%) 14 (20%) 13 (18%) 3 (4%) 10 (14%) 10 (14%) 7 (10%) 5 (7%) 2 (2%) 2 (2%) 2 (2%)
137
3 (3%) 2 (2%)
10 (100%) 1 (1%)
16
Functional disabilities
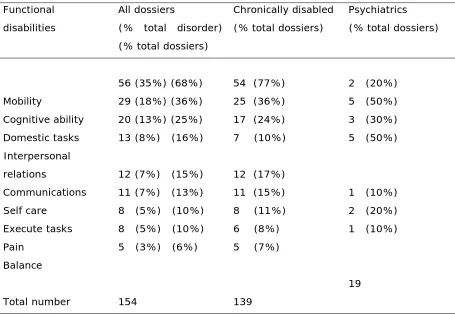
In table 5 functional disabilities are displayed. The total number of all disabilities adds up to 153, as many dossiers contained multiple functional disabilities.
Mobility, cognitive ability and problems with fulfilling domestic tasks are the most prominent problems, with one exception in the psychiatric group, where interpersonal relations pose the biggest problem. Mobility seems to be the problem that contributes most to loneliness, as it is frequently occurring in the sample of chronically disabled. Of course the psychiatric population mostly suffered from interpersonal problems, which surely contributes heavily to loneliness, but as much participants also reported problems with cognitive ability.
Table 5
Overview over functional disabilities of 80 profiles Functional
disabilities
All dossiers
(% total disorder) (% total dossiers)
Chronically disabled (% total dossiers)
Psychiatrics (% total dossiers)
Mobility Cognitive ability Domestic tasks Interpersonal relations Communications Self care Execute tasks Pain Balance Total number
56 (35%) (68%) 29 (18%) (36%) 20 (13%) (25%) 13 (8%) (16%)
12 (7%) (15%) 11 (7%) (13%) 8 (5%) (10%) 8 (5%) (10%) 5 (3%) (6%)
154
54 (77%) 25 (36%) 17 (24%) 7 (10%)
12 (17%) 11 (15%) 8 (11%) 6 (8%) 5 (7%)
139
2 (20%) 5 (50%) 3 (30%) 5 (50%)
1 (10%) 2 (20%) 1 (10%)
19
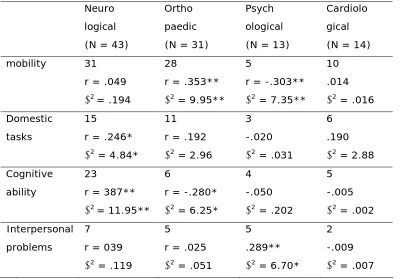
3.1.2 Relations between disorders and functional disabilities
Table 5 showed that neurological disorder was most frequent occurring, whereas mobility was the most prominent functional disability. To explore this relationship the three most dominant disease categories and psychological disorder were analyzed together with the four most prominent functional disabilities. The frequencies of cases where a disorder was occurring together with a functional disability are displayed in table 6. The relation between the two constructs is displayed below the frequencies of people with a certain disorder suffering from that functional disability.
psychological disorder was related to interpersonal problems, but the relation was clearly significant.
Table 6
Relations between functional disabilities and disorders Neuro
logical (N = 43)
Ortho paedic (N = 31)
Psych ological (N = 13)
Cardiolo gical (N = 14)
mobility 31
r = .049
2= .194
28
r = .353**
2 = 9.95**
5
r = -.303**
2 = 7.35**
10 .014
2 = .016
Domestic tasks
15
r = .246*
2 = 4.84*
11 r = .192
2 = 2.96
3 -.020
2 = .031
6 .190
2 = 2.88
Cognitive ability
23
r = 387**
2= 11.95**
6
r = -.280*
2 = 6.25*
4 -.050
2 = .202
5 -.005
2 = .002
Interpersonal problems
7 r = 039
2 = .119
5
r = .025
2 = .051
5 .289**
2 = 6.70*
2 -.009
2 = .007 *Relations are significant at 0.05 level
** Relations are significant at 0.01 level
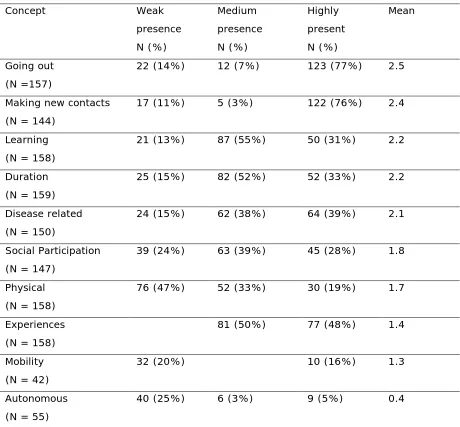
3.1.3 Activities
In total 160 activities were identified and scored on 10 different concepts. See table 8 for an overview of frequencies. Note that degrees of presence refer to the coding scheme, the number below each individual concepts presents the number of activities were the concepts could be aligned to.
Table 7
Overview over degree of presence of concepts (for 160 activities)
Concept Weak presence N (%) Medium presence N (%) Highly present N (%) Mean Going out (N =157)
22 (14%) 12 (7%) 123 (77%) 2.5
Making new contacts (N = 144)
17 (11%) 5 (3%) 122 (76%) 2.4
Learning (N = 158)
21 (13%) 87 (55%) 50 (31%) 2.2
Duration (N = 159)
25 (15%) 82 (52%) 52 (33%) 2.2
Disease related (N = 150)
24 (15%) 62 (38%) 64 (39%) 2.1
Social Participation (N = 147)
39 (24%) 63 (39%) 45 (28%) 1.8
Physical (N = 158)
76 (47%) 52 (33%) 30 (19%) 1.7
Experiences (N = 158)
81 (50%) 77 (48%) 1.4
Mobility (N = 42)
32 (20%) 10 (16%) 1.3
Autonomous (N = 55)
40 (25%) 6 (3%) 9 (5%) 0.4
The concepts mobility and autonomy frequently could not be assessed out of the dossiers, but when information about these dimensions was given in the dossiers, it displayed a tendency towards low presence of these concepts. Mobility was mostly needed for short time (taxi-service) only 10 per cent of all activities chosen enabled long term mobility. Autonomy was also low, which indicated that an activity that could be scored on this dimension was characterized by a high degree of help needed to execute the activity. Typically these were activities were a volunteer was needed for the realization.
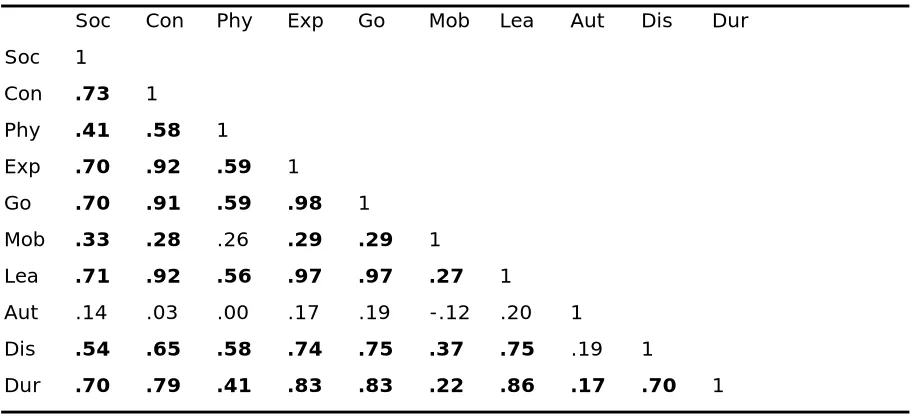
[image:31.595.70.526.399.607.2]To be able to correlate all concepts of the 160 activities, mean scores per concept for the 80 dossiers were computed. As can be seen in table 9, many correlations between constructs are positively significant. In fact, just one relation (autonomy and mobility) turned out to be significant and of these concepts frequently no information could be extracted from the profiles.
Table 8
Correlations between concepts assessed in dossier analysis (N = 80)
Soc Con Phy Exp Go Mob Lea Aut Dis Dur
Soc 1
Con .73 1
Phy .41 .58 1
Exp .70 .92 .59 1
Go .70 .91 .59 .98 1
Mob .33 .28 .26 .29 .29 1
Lea .71 .92 .56 .97 .97 .27 1
Aut .14 .03 .00 .17 .19 -.12 .20 1
Dis .54 .65 .58 .74 .75 .37 .75 .19 1
Dur .70 .79 .41 .83 .83 .22 .86 .17 .70 1
Significant correlations are displayed bold (p > 0.01)
Soc = Social Participation; Con = Making new contacts; Exp. = Making new experiences; Phy = Being physically active; Go = Going out; Mob = Mobility; Lea = Learning/Improving cognitive ability; Aut = autonomous; Dis = Disease related; Dur = Duration.
as going out is appealing. Social Participation also was related to the concepts just mentioned. All these concepts were found to occur frequently and data suggests that most people chose one or more activities that can be identified by these factors. This does not necessarily mean that one activity can be defined to be “high” in learning and making new experiences, but that on the average of all chosen experiences, these concepts were frequently found. This fits the observation that most people need the full amount of money, in order to execute more than just one activity (on average 2).
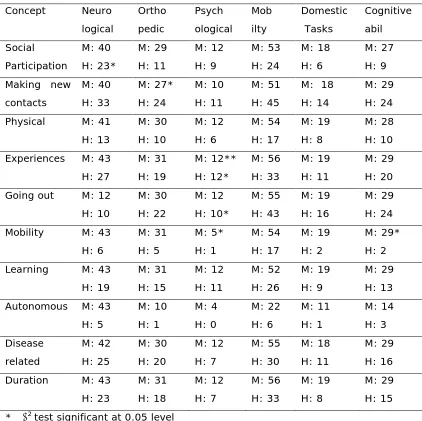
3.1.4 Relations between activities and diseases / functional disabilities
The table below shows relations between the mean and value “high” of presence of the concepts of the activities and different disorders or functional disabilities for all 80 dossiers. This was done, because on average everyone executed more than one activity, which nearly always made a mean score above 1. So additionally the dimension “high” was added, to give a clearer picture. So the M (mean) in table 9 indicates the amount of dossiers that suffered from a special disease and executed at least one activity that could be related to that concept. H (high) stands for the number of dossiers with the disease that executed at least one activity that could be related to the property “high” of that concept. Chi Square tests with all concepts and disease / functional disabilities were executed to test for significance.
Table 9
Relations between concepts and disorder
Concept Neuro logical Ortho pedic Psych ological Mob ilty Domestic Tasks Cognitive abil Social Participation M: 40 H: 23* M: 29 H: 11 M: 12 H: 9 M: 53 H: 24 M: 18 H: 6 M: 27 H: 9 Making new
contacts M: 40 H: 33 M: 27* H: 24 M: 10 H: 11 M: 51 H: 45
M: 18 H: 14
M: 29 H: 24 Physical M: 41
H: 13 M: 30 H: 10 M: 12 H: 6 M: 54 H: 17 M: 19 H: 8 M: 28 H: 10 Experiences M: 43
H: 27 M: 31 H: 19 M: 12** H: 12* M: 56 H: 33 M: 19 H: 11 M: 29 H: 20 Going out M: 12
H: 10 M: 30 H: 22 M: 12 H: 10* M: 55 H: 43 M: 19 H: 16 M: 29 H: 24 Mobility M: 43
H: 6 M: 31 H: 5 M: 5* H: 1 M: 54 H: 17 M: 19 H: 2 M: 29* H: 2 Learning M: 43
H: 19 M: 31 H: 15 M: 12 H: 11 M: 52 H: 26 M: 19 H: 9 M: 29 H: 13 Autonomous M: 43
H: 5 M: 10 H: 1 M: 4 H: 0 M: 22 H: 6 M: 11 H: 1 M: 14 H: 3 Disease related M: 42 H: 25 M: 30 H: 20 M: 12 H: 7 M: 55 H: 30 M: 18 H: 11 M: 29 H: 16 Duration M: 43
H: 23 M: 31 H: 18 M: 12 H: 7 M: 56 H: 33 M: 19 H: 8 M: 29 H: 15 * 2 test significant at 0.05 level
** 2 test significant at 0.01 level
Analysis revealed that neurological disorders constantly opted for high social participation, thus joining a network; the dependence between these two concepts became significant. About 80 percent wanted to meet unknown people- given the high amount of people with neurological disorders in this analysis; this is a good finding, because it shows the will to end the status of loneliness.
About 50 per cent did activities that enabled them to do something for a longer period of time (more than one year), instead for making a lot of experiences in short time.
A third of all orthopedic cases wanted to do sports, and join an enduring network, although nearly all decided to meet new people. The social component did seem to be present as in the former too.
In total, there are not many differences between the three disease groups concerning the selection of activities. This could indicate that not the disease, but the status of loneliness determines the choice for activities, or at least the underlying concepts are the same. They all share that they have a minimum of social contacts, which could explain the high preference for activities that facilitate the establishment of new contacts, pictures in mind and the termination of their lonely lives.
3.1.5 Conclusion
Dossier analysis was executed to be able to describe the population concerning disorders, functional disabilities and chosen activities.
A high prevalence of neurologic, orthopaedic and cardiologic disorders was found. Most prominent problems were mobility, cognitive tasks and fulfilling domestic tasks.
The second part of this study focused on different constructs of the chosen activities. On average more than 2 activities were executed per candidate, most activities were related to making new contacts and going out. The most constructs showed high intercorrelations, with some exceptions, as for example autonomy and mobility. Analysis done to examine the relation between disorders / functional disabilities and activities chosen revealed one significant predictor: psychological disorder had a strong predictive value for deciding to execute activities that could be rated “high” on making new experiences. Across all disorders certain activities were frequently chosen: getting in contact with unknown people, going out, opting for long-lasting and highly disease related activities. This is a pleasant finding, because it suggests that – independent of the underlying disorder- the participants of the happiness budget use it in order to fight against their diseases and the status of loneliness. All were completely free to choose what to do with the budget, and it can at least be concluded: the will to change their situation clearly is there.
3.2. Study two: the Questionnaire 3.2.1 Description of study group
Table 10
Demographic Data of the study population (N = 12)
Male 2
Female 10
Mean Age 60 (44 – 79 y)
Table 10 shows that most participants were female and on average 60 years old. The study group was very small, what has serious implications for the following analyses: they are completely descriptive in nature and have to be read with respect to this small sample.
First the different subscales measured with the questionnaire will be presented, before its suitability for the population will be discussed. An overview over disorders, functional disabilities and activities chosen by the participants of this study will also be given, before relations of these variables with outcomes of the questionnaire will be (briefly) discussed.
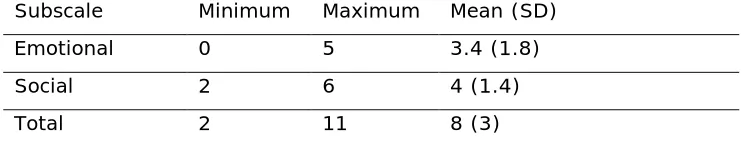
[image:35.595.65.437.515.588.2]3.2.2 Loneliness
Table 11
Results of the loneliness scale
Subscale Minimum Maximum Mean (SD)
Emotional 0 5 3.4 (1.8)
Social 2 6 4 (1.4)
Total 2 11 8 (3)
The comparison with the cut off scores given by de Jong Gierveld and Van Tilburg (1999) clearly indicates that this population is more isolated than the average of 3.823 Dutch people. Chi Square test was executed to test whether the sample significantly differ, this turned out to be true at 0.01 level. These results do suggests, that this population is substantially lonely, but this has to be seen with respect to the great difference in sample sizes: while De Jong Gierveld and van Tilburg (1999) had 3.823 respondents, this study had just 12.
Table 12
Comparison of loneliness scores to cut-off scores
Norms* Present study Difference
Scale0- 2: not lonely 68% 8%
3 -8 medium lonely; 28% 42%
9 -10 severe loneliness; 3% 17%
11 loneliness 1% 33% p < 0.01
Norms*: De Jong Gierveld &Van Tilburg (1999_2), N = 3.823
3.2.3 Mental Health
Table 13
Results of the mental health continuum
Subscale Minimum Maximum Mean (SD)
Emotional 2 6 4 (1.1)
Social 1.8 5 3.3 (0.9)
Psychological 3 5 4 (0.7)
Total 2.4 4.9 3.8 (0.8)
[image:36.595.65.441.507.601.2]Table 14
Comparison of mental health scores to norm scores Subscale Present study Westerhof
&Keyes (2008)*
p-value
Emotional 4 (1.1) 4.7 (0.9) n.s.
Social 3.3 (0.9) 3.3 (1.0) n.s.
Psychological 4 (0.7) 4.2 (1.0) n.s.
Present study Keyes (2002) p- value
Flourishing 33% 35%
Languishing 8% 4.9%
Moderately mentally healthy
58% 60% n.s.
* N = 1.663
Moreover, Keyes (2002) found that 16 per cent people who could be defined as being languishing could be diagnosed as having a major depressive episode. Given the fact that only eight per cent in this study were categorized as being languishing, it does not seem likely that depression is a problem frequently occurring.
But again, readers should keep in mind that this is only true for the 12 participants in this small sample.
3.2.4 Participation and autonomy
Table 15
Results of the Impact on participation and autonomy scale
Subscale Minimum Maximum Mean (SD)
Autonomy outdoors
(3 items) 2 4 3.1 (0.9)
Autonomy indoors
(2 items) 2 4 2.7 (0.7)
Total (5 items) total
2 10
4 20
2.9 (0.6) 14 (3.4)
3.2.5Purpose in Life
Table 16
Results of the purpose in life scale
Scale Minimum Maximum Mean (SD)
whole scale
Mean per item Whole Scale
(20 items, 9 cases)
64 128 92.6 (18.9) 4.63
Selection (17 items, 11 cases)
55 129 83.5 (17.3) 4.91
[image:38.595.68.461.375.588.2]Ebersole and dePaola
(1998)*
117.6 5.88
* Study sample was N = 36
trouble with that question. On the average people’s agreement with one question was 5.2, indicating that a quite high purpose in life.
Seemann (1991) stated that a score of 20 indicated a low purpose, whereas a score of 140 indicated a high purpose in Life. So the population can be characterized as having a present purpose, even if this purpose is not that strong. The idea behind this categorization of Seemann (1991) was to look at how strong candidates agree with the individual statements. Scoring a 7 indicates high purpose in life for every question, whereas scoring a 1 indicates virtually no purpose. Compared against the values used as norm scores against which this group was compared showed that they scored lower in this study. Unfortunately no standard deviations were given by Ebersole and DePaolo, so no tests for significance (t-test) could be computed. But obviously this sample does not have a strong purpose in life. Of course this is only valid for the 12 participants that took part in this study.
3.2.6Self rated health Table 17
Results of self rated health
Scale Minimum Maximum Mean (SD)
Whole Scale 1 7 3.8 (2)
Self rated health turned out to be exceptionally low. On a 10 point rating scale, the average rating varied between 1 and 5, which indicated that participants perceived their health status as insufficient. This goes in line with the finding that autonomy and the ability to participate were found to be low.
3.2.7Internal properties of the questionnaire
limited in their ability to move around and use their body, is not related to mental health or having a purpose in life.
Table 18
Inter-item correlation of the questionnaire
N respondents N Items
Loneliness Scale 12 11 .760
Mental Health Continuum
12 14 .855
Impact on
Participation and Autonomy Scale
12 5 .693
Purpose in Life Scale 12 20 .920
* Significant at 0.05 level ** Significant at 0.01 level
Diversity of this questionnaire is high and thus it is not surprising that the alpha for the whole scale turned out to be low. Still the author can conclude that the questionnaire is a reliable instrument for the use within this population.
Table 19
Correlations between subscales of the questionnaire
LS MHC IPA PIL SH
LS 1
MHC .827** 1
IPA -.318 -.090 1
PIL .605 .938** .124 1
SH .631* .463 -.555 .433 1
LS = Loneliness Scale; MHC= Mental Health Continuum Short-Form; IPA = Impact on Participation and Autonomy Scale; PIL = Purpose in Life Scale
* Significant at 0.05 level ** Significant at 0.01 level
[image:40.595.63.537.509.617.2]surprise, given the different nature of this scale. The negative relation to self reported health can be explained by the different scaling, high values on the IPA indicate high impairment, whereas high values on self reported health indicate low impairment.
This study served different goals, along with others it was intended to test whether the questionnaire was suitable to be used in this population. This is why participants were asked to read the questions aloud and indicate when they had problems answering a question. On average participants needed 28 minutes to fill in the questionnaire (SD: 13, Range: 10 – 55 minutes), which indicates that the questionnaire can be answered in a reasonable amount of time. Whether this is due to the selective sample can be questioned and will be discussed later.
They also were asked what needed to be changed to make the items more easy to answer, if (1) better explanation would be enough (phrasing was not understandable), (2) whether the question needed to be altered (content was not understandable) or (3) should be completely removed (question was too personal / respondents refused to gave an answer). Candidates made most comments on the questions 36, 37, 42 all questions of the Purpose in Life test. Comments were quite different for these three items. Question 36 was too personal and the formulation of response options too extreme for two respondents and they had chosen not to answer this question (“The points are too extreme for me to answer”; “9 lives would be too much, 1 surely is enough!”, “This question is exaggerated!”). Questions 37 concerned what people wanted to do when they would get in old age pension. Asking this a person who is chronically ill and can not work poses obvious problems: “I would like to, but I can not go with old age pension since I do not work!” Question 42 was too difficult for some respondent