[ 8
3THE RELATION BETWEEN THE EPIDERMAL
MITOTIC ACTIVITY AND THE BLOOD-SUGAR
LEVEL IN THE ADULT MALE MOUSE,
MUS MUSCULUS L.
BYW. S. BULLOUGH
Department of Zoology, University of Sheffield
{Received 24 November 1948)
(With Ten Text-figures)
I. INTRODUCTION
The diurnal cycle of mitotic activity in the adult male mouse has been described in detail (Bullough, 1948 a), and its relation to periods of waking and sleeping has been emphasized (Bullough, 1948^). Since then a search has continued for the critical factor, or factors, which are responsible for the form of the cycle, the first factor to be investigated being that of body temperature (Bullough,* 1949). It has been found that the normal variations in body temperature cannot be the cause of the diurnal mitosis cycle, and that abnormal variations have little or no effect on mitotic activity. However, from this and from the previous work, two significant results have emerged. The first is that experimentally induced exercise results in an abnormally reduced mitosis rate, and the second that a similar effect is induced by extreme cold. A common factor in both these situations is the drain on the sugar reserves, in the first case for the movements of the limbs, and in the second for the production of heat. The present paper records the results of experiments which were performed to test the theory that a connexion exists between mitotic activity and blood sugar.
II. MATERIAL AND METHODS
(1) The mice. The animals used were of the Kreyberg's white label and Strong's CBA strains, and no differences in response were found between them. All were healthy males in fuH breeding condition, and all were between the ages of 3 and 6 months. They received a diet which included whole oats, dog biscuit, and rat cake soaked in cod-liver oil, and their daily food was always given them between 09.00 and 10.00 hr. It may be important to add that sufficient was always given for there to be an abundance constantly present in the cages throughout the 24 hr. The laboratory was maintained at 200 C , and was artificially lighted between 09.00 and 18.00 hr. daily. The experiments were carried out between September and January. (2) Estimation of mitotic activity. The mitosis rate was measured in the ear epidermis by the earclip technique already described (Bullough, 1949). It may be repeated here that all stages of mitosis were included in the counts which were made on 1 cm. lengths of epidermis in sections cut j/x thick, and that from each earclip
ten such counts were made and the average taken. As each experimental group consisted of earclips from ten mice, ten figures were available from which a grand mean and standard error were calculated according to the formula for small samples recommended by Simpson & Roe (1939).
(3"*! Estimation of blood sugar. To obtain samples of blood it proved necessary to kill the mice. This was done by picking them up as gently as possible, and then quickly driving a spike into the brain. Immediately afterwards the throat was cut widely open, and the heart, continuing to beat, drove the blood into a small dish. The blood was constantly stirred to discourage clotting, which otherwise was extremely rapid, and as quickly as possible (in all cases within 45 sec.) two samples, each of o-i c.c, were taken. The glucose content of these samples was then estimated by a modification of the Hagedorn and Jensen technique. Thus for each group of ten mice, twenty blood-sugar estimations were made, and from these figures the averages and standard errors were calculated.
III. OBSERVATIONS
(1) Preliminary experiments
A series of preliminary experiments was performed in an attempt to establish some connexion between mitotic activity and the blood-sugar level. Repeated attempts were made by means of injections of glucose to obtain a stimulation of mitosis in waking mice, in which such activity is normally low. Following the evidence of Bissinger, Lesser & Zipf (1923) that the carbohydrate content of a 20 g. mouse after an 18 hr. fast is approximately 20 mg. of glycogen and 20 mg. of glucose, quantities ranging from 10 to 40 mg. of glucose in isotonic water solution were given in single or in repeated subcutaneous injections. Later, starch was substituted in order that the release of glucose into the blood should be considerably slowed, and that, in consequence, its effects should be felt over a longer period.
In these experiments the time of injection was 09.00 hr. (1 hr. before the time of minimum mitotic activity), and 20 mg. of starch in 0-9% saline was found to be a suitable dose. The response to this treatment was immediate, the mitosis rate rising to a high level at a time when it would normally be low.
(2) The diurnal cycles
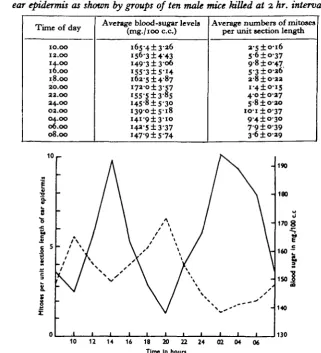
Encouraged by this result, a comparison was next made between the normal cyclic variations in the blood-sugar level and in the mitosis rate throughout the 24 hr. Groups often mice each were killed at 2 hr. intervals starting at 10.00 hr. on one day and ending at 08.00 hr. on the next. From each mouse were taken two blood samples and a piece of ear, and the results are recorded in Table 1 and Fig. 1.
If, as was suggested by the preliminary experiments, high mitotic activity is dependent on an abundance of blood sugar, it becomes necessary to attempt to define as clearly as possible what is meant by an abundance. It may be that during sleep when the blood-sugar level is low there is actually an abundance, since the demand of the muscles is at a minimum, while during waking when the sugar level
Table 1. The diurnal cycles in the blood-sugar level and in the mitotic activity of the
ear epidermis as shown by groups of ten male mice killed at 2 hr. intervals
Time of day
10.00 12.00 14.00 16.00 18.00 20.00 22.00 24.00 02.00 04.00 06.00 08.00
Average blood-sugar levels (mg./ioo c.c)
165-413-26 1563 ± 4 4 3 1493 ± 3 0 6 i55-3±5-i4 162-514-87 17a -o ±3-57 i55-5±3-85 145-8 ±5-3° i 3 9 ° ± S i 8 i4i-9±3-i° i43-5±3-37 147-9 ±5-74
Average numbers of mitoses per unit section length
2-S±o-i6 5"6±o-37 9-8 ±047 5-3 ±026 2-8 ±022 i - 4 ± ° i 5 40 ±027 S-8±o-2o
I O I ± O - 3 7
94 ±030 79 ±039 3-6 ±0-29
1 0 ,
-
3-5
I
X.
8
10 12 14 16
- 190
ISO
170 8
I
160 I
150 I
140
130 24 02 04 06 18 20 22
Time In hours
Fig. 1. The diurnal variations in the mitotic activity of the ear epidermis (continuous line) compared with the diurnal variations in the blood-sugar concentration (broken line).
is high the demand of the muscles is such that no abundance exists. To test this theory the following experiments were performed.
(3) The effect of starch injections
seemed probable that this was what had actually happened in the preliminary experiments. It was decided to try to raise the mitosis rate to a maximum at 10.00 hr. because at this time, when the rate is normally at a minimum, the result would have a maximum significance. The animals could always be relied upon to be awake and active at 10.00 hr. since they were accustomed to being fed just before this time.
Table 2. The effects of an injection of 20 mg. of starch at 08.30 hr. on the blood-sugar
level and on the epidermal mitosis rate of groups of ten adult male mice
Time of day
08.00 09.00 10.00 12.00 14.00
Average blood-sugar levels (mg./ioo c.c.)
I 5 ° - I ± 4 - 3 3
i9i-4±5'3°
209-914-41 146-615-42 130-1 ±2-62
Average numbers of mitoses per unit section length
3-8 ±027 5-5 ±0-32
IO-I±O-30
10-410-46 931O-31
10
3 •8
I
I
s
I
200
190
180 8
170
160
10 11
Time In houn
150
140
130
12 13 14
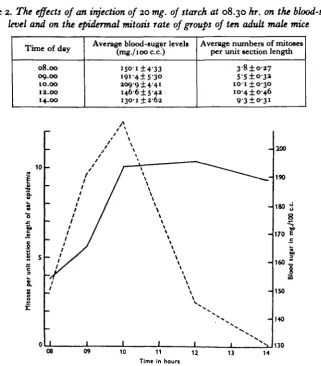
Fig. 2. The changes in the mitotic activity of the ear epidermis (continuous line) and in the blood-sugar concentration (broken line) following the subcutaneous injection of 20 mg. of starch at 08.30 hr.
A series of experiments, elaborations of the preliminary experiments recorded above, was carried out with this intention. In the first, groups of ten Strong's CBA mice were killed at 08.00, 09.00, 10.00, 12.00 and 14.00 hr., and from each animal there were taken two blood samples and a piece of ear. At 08.30 hr. the mice then alive were each injected subcutaneously with 0-5 c.c. of isotonic saline containing 20 mg. of starch. The results obtained are given in Table 2 and Fig. 2.
about i\ hr. the mitosis rate also rose until at 10.00 hr. a degree of mitotic activity similar to that normally found in sleeping mice was obtained in mice which were awake and active. By 12.00 hr. the blood-sugar level had fallen, but by this time the mice had started their mid-day sleep and the fall was not accompanied by a reduction in mitosis. By 14.00 hr. the blood sugar was markedly subnormal, apparently as an over-compensation for the earlier excess, but with the animaia still sound asleep, the mitosis rate remained high.
In a second confirmatory experiment blood-sugar estimations were not made, and the mice were kept alive. Two groups each of ten Strong's CBA mice were used, and from each animal an earclip was removed at 08.00 hr. and at hourly intervals there-after until 14.00 hr. At 08.30 hr. the mice in the control group each received an injection of 0*5 c.c. of isotonic saline, while the mice in the experimental group each received 0*5 c.c. of isotonic saline containing 20 mg. of starch. From the earclips the changes in mitotic activity were assessed, and the results are given in Table 3.
Table 3. The changes in the epidermal mitotic activity of ten control mice
and of ten mice injected with 20 mg. of starch at 08.30 hr.
Time of day
08.00 09.00 10.00 11.00 12.00 13.00 14.00
Average numbers of mitose* per unit section length
In control mice injected with saline
6 4 ± 0 3 4 2-8 ± 0 2 2 I.2±O-I2 2-O±O-II 37±o-2i 6-5 ±045
90 ±041
In mice injected with saline and starch
5 -6 ± 0 2 5 6"2±O-29 6 3 ± 0 1 9 4-2 ±0-30
6-8 ±037
11 -8 ±0-42 12-8 ±0-47
In these results the stimulation achieved at 10.00 hr. was not so great, but it was sufficiently striking for it to be said that the two experiments are confirmatory. I t is also possible to draw a further conclusion from this experiment, for it is evident that, with the approach of the early afternoon rest period, the injection of 20 mg. of starch induces an unusually rapid rise in mitotic activity to the high levels seen at 13.00 and 14.00 hr. As a further check on this effect, the experiment was repeated once again, and this time the earclips were taken hourly until 15.00 hr. The results are given in Table 4 and Fig. 3.
Table 4. The changes in the epidermal mitotic activity of ten control mice and
of ten mice injected vrith 20 mg. of starch at 08.30 hr.
Time of day
08.00 09.00 10.00 11.00 12.00 13.00 14.00 15.00
Average numbers of mitoses per unit section length
In control mice injected with saline
6-o±o-32 3 9 ± o i 9
I - 7 ± O I I
i-9±o-i5 3-8 ±020 55 ±036 7-1 ±0-30 59±o-27
In mice injected with saline and starch
In this case the stimulation achieved at 10.00 hr. was even less than before, but again the starch injection induced a great increase in the rate of mitotic activity at the beginning of the rest period. By 12.00 hr. the mitotic activity in the starch-injected animals had reached an abnormally high level which was maintained until after 14.00 hr.
The absence in this experiment of any great mitosis stimulation at 10.00 hr. was unexpected, and prompted two further repetitions of the experiment. In one of these only slight mitosis stimulation was obtained at 10.00 hr., but in the other the stimulation was great. In both the rate of increase of mitotic activity, as well as the level reached at the time of the mid-day sleep, was significantly higher after the
a
?
8-"8
I
i
i
J
c
s.
8 5
10
s
0
-\ \ " \
-\ / \ /
\ \ ^ ^
\ \ \
\ '
\ _.'
I I I
r
//
/
/
/
\
^ V
\
V _
-08 09 10 11 12 13 15
Time In houre
Fig. 3. The changes in the mitotic activity of the ear epidermis of mice injected at 08.30 hr. with 20 mg. of starch dissolved in saline (continuous line) and with saline alone (broken line).
injection of starch. Thus, in spite of some uncertainty concerning the time lag, it may safely be concluded that a rise in the blood-sugar level, as induced by the injection of 20 mg. of starch, is followed by a rise in mitotic activity. In the experi-ments which involved the shortest time lags, this stimulation was obtained in active waking animals so that their mitotic activity approximated to that normally found during sleep.
(4) The effects of various doses of starch
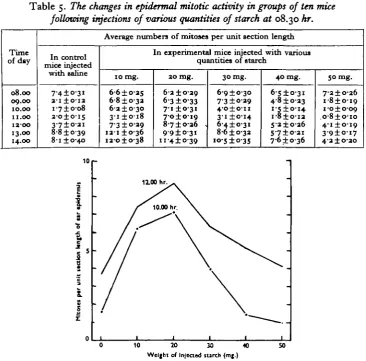
of starch dissolved in not more than 1 c.c. of isotonic saline. The effects on the mitotic activity of the ear epidermis induced by these various treatments are shown in Table 5.
Table 5. The changes in epidermal mitotic activity in groups of ten mice
following injections of various quantities of starch at 08.30 hr.
Time of day 08.00 09.00 10.00 11.00 IZ'OO 13.00 14.00 mice iryected with saline 7-4±o-3i a-i ±o-ia i-7±o-o8 a-o±o-is 3-7±oai 8-8 ±039 8-i ±0-40
Average numbers of mitoses
10 mg.
6-6 ±0-25 6-8 ± 03a
6-a ±0-30 3 i ± o i 8 7'3 ±0-29 ia-i ±0-36
ia-o±o-38
per unit section length
[n experimental mice injected with various quantities of starch
20 mg. 6-a ±0-29 63 ±033 71 ±0-31 7-o±oi9 87±036 . 99±031 11 4 ±039
30 mg. 6-9 ±0-30 7'3 ±0-29 4-o±o-n 31 ±014 6-4 ±o-31 8-6 ±033 10-5 ±035 40 mg.
6-S±o-3i 4 0 ±033 i - 5 ± o i 4 I-8±O-I3 5'3±O-36 5-7±o-3i 7-6 ±036 50 mg. 7-2±O-26 i-8±o-i9 i-o±o-09 O'8±o-io 4-1 ±0-19 3 9 ± o i 7 4"3±O-2O 10
r-1
I
3 •5 2. sI
12.00 hr10 M 30 Weight of Injected lurch (mj.)
50
Fig. 4. Graphs illustrating the different degrees of stimulation of the mitotic activity of the ear epidermis at 10.00 and 12.00 hr. after injections of from o to 50 mg. of starch at 08.30 hr.
9°
clearly the limitations to the stimulation of mitosis by means of starch injections, the maximum reaction being developed after treatment with about 20 mg.
(5) The effect of blood phosphate
The results so far obtained support the conclusion that, within limits, abnormal increases in the blood-sugar level result in abnormal increases in epidermal mitotic activity. However, the enigma remains that in the normal animal a relatively high concentration of blood sugar is associated with a low rate of cell division during waking, while a relatively low concentration of blood sugar is associated with a high rate of cell division during sleeping. Important as the sugar concentration may be, it appears certain that other more important factors are acting to limit mitosis, and to determine the form of the diurnal cycle. At this stage of the investigation it was decided, in discussion with Prof. J. B. S. Haldane, F.R.S., that an examination of the effect of the blood-phosphate level might prove valuable. One of the interesting points about the normal blood-phosphate concentration is that it is higher during sleep than during waking, and in this it resembles mitotic activity. In theory, therefore, it could be an important factor in the control of mitosis, and also, since phosphates are so closely involved with sugar in the release of energy, a link with the foregoing experiments is possible.
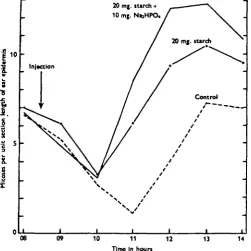
In these experiments sixty mice were studied, ten being injected with 1 c.c. of normal saline, ten with 20 mg. of starch alone, ten with 20 mg. of starch and 10 mg. of Na^IPO4, 2H,O, and ten each with 5, 10 and 15 mg. of Naj,HPO4, 2H,0 alone.
The starch solution was made up as before in normal saline, while the phosphate was made up as an N/IO solution in distilled water with the pH adjusted to 7-4. The results obtained are shown in Table 6 and in Fig. 5.
Table 6. The changes in epidermal mitotic activity in groups of ten male mice following
injections at 08.30 hr. of various quantities of NajHPO4, J Z H , 0 with and without the addition of 20 mg. of starch
Time of day 08.00 09.00 10.00 11.00 12.00 13.00 14.00
Average numbers of mitoses per unit section length in mice injected with
Saline alone
6-6 ±0-19
5 - I ± O I 8
2-7±o-o6 13 ± 0 0 5 4-o±O'io 7-3+0-15 7-o±o-i4
20 mg.
starch
7-o±o-n 6-i ± o - n 3-3 ± 0 0 8
6-i ±0-19 9-4 + 0 1 4 IO-5±O-I2
9 S ± o i 6
zo mg. starch and 10 mg.
Na,HPO4
6-7±o-i2 4"9±o-io 3 1 ± 0 0 9 8-s±o-i4
I2"6±O-2I I2-8±O"25 I O - 8 ± O I 8
Na,HPO« alone
6-i ±o-io a-8±o-io 2-6±o-o6 1-4 ± 0 0 5 2-9 ± 0 0 9
7 - I ± O I I
7-1 ±o-io 10 mg. Na,HPO4 alone 6o±oi8 35 ±008 2-2±O-IO I-I ±O-OS 5-2 ±0-07 8-4±o-i2 6-4 ±0-09 15 mg. Na,HPO4 alone 6-4±o-n
4-1 ±o-io 27 ±008 49 ±006 6-o±oi7 9-6±o-i9 6-7±o-i2
reached were consistently higher. No such response was developed in any of the mice which received the phosphate alone, although it is possible that those which received 15 mg. did experience some degree of stimulation.
It follows from these results that while a rise in the blood-phosphate level may strengthen the reaction produced by starch alone, it is not by itself capable of inducing an abnormal stimulation of mitotic activity, and it cannot be considered as the primary factor responsible for the rise in this activity which normally takes place during sleep.
[image:9.451.100.352.188.439.2]14
Fig. 5. The changes in the mitotic activity of the ear epidermis in control mice, in mice injected with 20 mg. of starch, and in mice injected with 20 mg. of starch together with 10 mg. of Na.HPC^, 2H.O.
(6) The effects of insulin
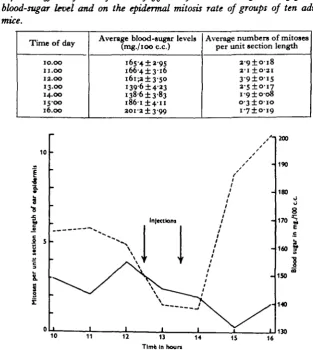
16.00 hr., and estimations were made of the blood-sugar level and of the rate of epidermal mitotic activity in the ear. The results were striking, and are given in Table 7 and Fig. 6.
Table 7. The effects of two injections offo unit of insulin at 12.30 and 13.30 hr. on the blood-sugar level and on the epidermal mitosis rate of groups of ten adult male mice.
Time of day
10.00 11.00 12.00 13.00 14.00 15-00 16.00
Average blood-sugar levels (mg./ioo c.c.)
165-4 ±2-95
I 6 6 - 4 ± 3 - I 6
i6i;a±3-5O i39-6±4-23 1386 ±3-83
I 8 6 - I ± 4 - I I
2Oi-2±3-99
Average numbers of mitoses per unit section length
2-O±O-J8 2-1 ±O-2I
3 9 ± o i 5 2 - 5 ± o i 7 i-o±o-o8 o-3±o-io i - 7 ± ° > 9
16130
Fig. 6. The changes in the mitotic activity of the ear epidermis (continuous line) and in the blood-sugar concentration (broken line) after injections, each of Ar unit of insulin, at 12.30 and
13.30 hr.
A sharp fall in the blood-sugar level \ hr. after the first injection was accompanied by a reduction in mitotic activity. This reduction became more acute after the second injection, and an extraordinary low level was reached by 15.00 hr. so that the normal early afternoon peak of mitotic activity was eliminated altogether. About 15.00 hr. the blood-sugar level rose rapidly, apparently due to an over-compensation, and this was followed by a slight rise in the mitosis rate.
each contained ten adult male mice. At each injection the former were given 0-5 c.c. of isotonic saline, and the latter 0-5 c.c. of isotonic saline containing -fo unit of insulin. The results are recorded in Table 8 and in Fig. 7.
Table 8. The chaises in the epidermal mitotic activity of ten control mice and
of ten mice injected with •£$ unit of insulin at 12.30 and 13.30 hr.
Time of day
10.00 11.00 12.00 13.00 14.00 15.00 16-00
Average numbers of mitoses
In control mice injected with saline
2-z±o-i6 3'O±O-2Z 4-1 ± 0 1 7
5-8 ±027 7'3 ±0-21
S'8±o-3I
4 - 2 ± o i s
per unit section length
In mice injected with saline and insulin
31 ±0-21 3-6±oig 4-o±o-iz 2-6±oi8
15 + o-i6 o-i ±005 i-4±oi9
•5
t
I 0
r 10
12 13
Time in houn
14 15 16
Fig. 7. The changes in the mitotic activity of the ear epidermis of mice injected at 12.30 and 13.30 hr. with iV unit of insulin (continuous line) as compared with controls (broken line).
Full confirmation of the results of the first experiment is demonstrated, and indeed by 15.00 hr. mitotic activity was almost totally eliminated.
(7) The effects of phloridzin
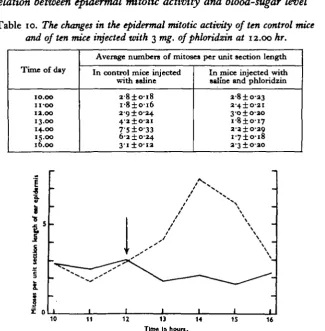
Experiments involving the use of phloridzin were next carried out. This sub-stance, while not at first causing any reduction in the blood-sugar level, impedes phosphorylation, and so opens the kidneys for the escape of sugar with the urine. After preliminary experiments, a dose of 3 mg. of phloridzin dissolved in 0-5 c.c. of isotonic saline and injected at 12.00 hr. was established as suitable. In the first experiment, groups of ten mice each were killed at hourly intervals from 10.00 to 16.00 hr., and determinations were made of the blood-sugar levels and of the epidermal mitosis rates. The results are given in Table 9 and Fig. 8.
steadier than that produced by insulin, and the mitosis rate remained low at 16.00 hr. when the last clip was taken. It should be added that the mice observed the normal mid-day rest period in an entirely normal manner.
Table 9. The effects of an injection of 3 mg. of phloridzin at 12.00 hr. on the
blood-sugar level and on the epidermal mitosis rate of groups of ten adult male mice
Time of day
JO.OO 11.00 12.00 13.00 14-00 15-00 JO.OO
Average blood-sugar levels, (mg./ioo c.c.)
i 6 a i ± 3 - 5 i
I 6 I - 7 ± 3 - 6 7
I55'i±4'°3 156-9 ± 3 7 7 1973 ± 4 6 3 198-6 ±4-75 i99-4±5-n
Average numbers of mitoses per unit length section
2 - 9 ± o i 4 3 3 ± ° '23 3-6±o-2i 2-b±o-i3 i-7±o-i5 i-7±o-23 2-1 ±O-2O 10 ----1200 - 190
1
8 •3i
S. "• # * / / / / / / f / / / / / / / / / e 1 " I| | j 1
——— i - 180 0 u 8 5 -- 170 160 =
J
S - 1S010 12 13
Time in hours
14 15 16
Fig. 8. The changes in the mitotic activity of the ear epidermis (continuous line) and in the blood-sugar concentration (broken line) after an injection of 3 mg. of phloridzin at 12.00 hr.
The experiment was then repeated without killing the mice involved, ten control males being injected at 12.00 hr. with 0-5 c.c. of isotonic saline, and ten mice with 3 mg. of phloridzin in 0-5 c.c. of isotonic saline. Earclips were taken at hourly intervals from 10.00 to 16.00 hr., and the results are shown in Table 10 and Fig. 9. The depression of mitosis observed in the experimental animals is similar in timing and degree to that in the first phloridzin experiment.
Table 10. The changes in the epidermal mitotic activity of ten control mice and of ten mice injected with 3 mg. of phloridzin at 12.00 hr.
Time of day
10.00
n-oo
12.00 13.00 14.00 15.00 16.00
Average numbers of mitoses per unit section length
In control mice injected with saline
2 - 8 ± o i 8
I - 8 ± O - I 6 2 9 ±0-24 4-2±O2I 6-2 ±0-24 3 I ± O I 2
In mice injected with saline and phloridzin
28 ±0-23 2-4±O-2I 3-o±o-2O i - 8 ± o i 7 2-a±o-29
I - 7 ± O - I 8 2-3±O-2O
1
I
10 11 12 13 14
Tlm« In h o u n .
15 16
Fig. 9. The changes in the mitotic activity of the ear epidermis of mice injected at 12.00 hr. with 3 mg. of phloridzin (continuous line) as compared with controls (broken line).
IV. DISCUSSION
The results recorded above justify the general conclusion that a connexion exists between the concentration of the blood sugar and the mitotic activity of the ear epidermis. However, it is also apparent from these results, and from the observation that mitotic activity is normally high during sleep when the blood-sugar concentra-tion is reduced, that the blood-sugar level per se is not the crucial factor which determines the form of the diurnal cycles. The actual control would appear to be exercised by some finer mechanism which is only crudely affected by unnaturally great changes in the blood-sugar concentration.
utilized as a building unit in the production of new cytoplasm. However, it is at least theoretically possible that it might be transformed into ribose, and then used in the formation of nucleoprotein. This possibility has been explored by means of subcutaneous injections of various concentrations of ribose dissolved in normal saline, but neither stimulation nor depression of the mitosis rate could be detected. It therefore appears improbable that in well-fed animals the supply of ribose can act as a limiting factor in cell division.
The second alternative, that glucose is of vital importance for the production of the energy consumed during cell division raises the question of whether, in fact, significant amounts of energy are involved in this process. The most recent work on this subject appears to be that of Zeuthen (1946, 1947) who, working first with frog's eggs and later with sea-urchin's eggs, concludes that there is an increase of about 10% in the respiration rate at or about the time of cleavage. This is in general agreement with the earlier results of Brachet (1934a, b), using frog's eggs, and of Runnstrom (1934), using sea-urchin's eggs. However, many other workers have entirely failed to distinguish any significant changes in the respiration rate during mitosis, and the question cannot be regarded as settled. Reviews of the extensive literature are given by Needham (1931, 1942) and Zeuthen (1946).
It must be concluded that the energy requirements of mitotic activity are at present unknown, and a suggestion that they may be significant can only be put forward in a tentative manner. However, it was partly because of this suggestion that experiments were carried out on the effects of injections of phosphate. It seemed possible that the relative deficiency of blood phosphate in the waking animal (Haldane, Wigglesworth & Woodrow, 19Z4) might act as a bar to the efficient phosphorylation of the sugar then available, while conversely its relative abundance in the sleeping animal might enable the development of full mitotic activity. This theory proved to be incorrect, but the results are of importance in indicating that injections of phosphate can augment the mitosis stimulating effect of injections of starch. This lends some support to the thesis that the function of glucose in cell division is to provide energy, and the depressing effects of phloridzin, which is known to interfere with the phosphorylation of sugar, also assume an added significance.
lactic acid appears in the vaginal lumen (Burrows, 1945). The establishment of such a local supply of carbohydrate would, on the present theory, be of the greatest assistance in the development of a high local mitosis rate. It is of interest to notice that, in apparent preparation for such a redistribution of glycogen, oestrogenic hormones cause a considerable increase in the blood-sugar level (Janes & Nelson, 1940). The detailed relation between glycogen deposition and mitotic activity in the cells of some tissue such as the vaginal epithelium is clearly an important subject for future investigation.
It is now possible to surmise why an unusual rise in the blood-sugar level does not infallibly induce an immediate increase in epidermal mitosis. It is clearly necessary that the sugar formed from the injected starch should be deposited into the epidermal cells, and this may not take place at once. In normal conditions, such deposition
10 12 14 I I IS 10 H 24 02 04 06
Tlm« In hourj (CUT.)
Fig. 10. The diurnal variations in the mitotic activity of the ear epidermis (continuous line) compared with the diurnal variations in the glycogen content of the liver (broken line). The liver glycogen graph is from results obtained by Dr P. J. Kipp.
apparently occurs mainly during sleep, thus accounting simultaneously for the drop in the blood-sugar level and the rise in the mitosis rate. Relatively little appears to be known at the moment regarding the diurnal changes in the carbohydrate content of the epidermis and similar tissues. However, conditions in the liver are well known, and they confirm that deposition of sugar with the formation of glycogen is a characteristic of sleep (Brody, 1945). For the mouse liver, the most recent results are those of Dr P. J. Kipp (private communication), who estimated the variations in the glycogen content throughout a period of 24 hr. using an ingenious photo-electric method. The greater part of his results are reproduced in Fig. 10, in which, for comparison, the diurnal variations in the epidermal mitosis rate are also included. It is obvious that the times of glycogen deposition are approximately the same as the times of high mitotic activity, the slight lack of synchronization being probably explicable on the grounds of individual differences between the animals.
It thus appears justifiable to adopt the working hypothesis that mitosis takes place most actively at those times when sugar is deposited from the blood into the tissues, and a full knowledge of the factors which initiate and control such deposition would seem to be important for a clear understanding of normal variations in the mitosis rate. Presumably one factor favouring deposition would be an excess of sugar in the blood stream, such as that caused in the present experiments by an injection of 20 mg. of starch. Another might be the temporary development of a greater area of contact between the tissue and the blood stream as induced by the dilation of blood vessels, by an increase in the numbers of capillaries, and by an increase in the rate of blood flow. These changes are seen, for instance, in the vicinity of wounds (Bullough, 1946), in the blood vessels of the skin after treatment with oestradiol (Reynolds, 1941), and around the hair bulbs in the region of rapid hair growth (Haddow, Elson, Roe, Rudall & Timmis, 1945). Yet another aid to mitosis stimula-tion might be an increase in the permeability of the capillary walls such as occurs in certain regions of tfie rat's body after treatment with oestrogens (Hechter, Krohn & Harris, 1942).
The opposite effect can be achieved by injections of insulin which, in a non-diabetic animal, are known to decrease the glycogen content of the liver as well as the blood-sugar level (Soskin & Levine, 1946). Local mitosis depression would also presumably follow a decrease in the blood supply, or a decrease in tfye permeability of the capillary walls.
If this theory is justified, it is evident that embryos, tumours, and such constantly proliferating tissues as lymph node centres must be characterized by an ability to absorb what sugar they require at all times of the day and night, even in conditions of unusual carbohydrate shortage.
In conclusion, it is interesting to consider the related question of the multi-plication of blood parasites which has been investigated by Hegner (1937). He introduced the malarial parasite Plasmodittm cathemerium into canaries made hyperglycaemic with glucose, or hypoglycaemic with insulin. In the former case the high blood-sugar level resulted in the production of an unusually large number of parasites, so that the birds sickened earlier and more frequently, and a greater proportion of them died. With insulin the opposite result was obtained with fewer parasites produced, and consequently with fewer illnesses and deaths among the hosts. Similar results have also been obtained by Steinbach & Duca (1942) with tuberculosis in rats. Animals which were rendered hyperglycaemic, and then inoculated intravenously with bovine tubercle bacilli, developed larger and more numerous tubercles than did the controls.
V. SUMMARY
a decrease in the blood-sugar level, induced by insulin, causes a decreased mitosis rate. A deep mitosis depression is also caused by injections of phloridzin.
2. Since it is known that phloridzin interferes with the phosphorylation of sugar, and since it is also shown that injections of phosphate augment the effect produced by starch alone, the tentative suggestion is put forward that sugar may act by satisfying the energy requirements of mitosis.
3. However, in the normal animal the diurnal changes in the blood-sugar level are the inverse of the diurnal changes in mitotic activity, the concentration of the blood sugar being relatively low during sleep when the mitosis rate is relatively high. It is therefore evident that, within normal limits, the level of the blood sugar as such is not an important factor in the control of the diurnal mitosis cycles.
4. It is considered probable that the critical factor in the control of these cycles is the concentration of sugar, or glycogen, within the tissues themselves. Thus during sleep, sugar is probably deposited in the tissues, as it is known to be in the liver, so accounting simultaneously for the fall in the level of the blood sugar and the rise in the mitosis rate.
It is a pleasant duty to record my indebtedness to Dr and Mrs F. Bielschowsky and to Prof. H. A. Krebs, F.R.S., who were constantly ready to give advice of a biochemical nature, and to Dr A. Jordan who arranged for the blood-sugar estimations to be made in the laboratories of the Sheffield Royal Infirmary. The work was carried out during a tenure of the Sorby Research Fellowship of the Royal Society of London.
REFERENCES
BISSINCER, E., LESSER, E. J. & ZIPF, K. (1923). KUn. Wschr. a, 2233.
BOYD, W. (1943). Text-book of Pathology, 4th ed. London: Henry Kimpton. BRACHET, J. (1934a). Arch. Biol., Paris, 46, 1.
BRACHET, J. (19346). Arch. exp. Zellforsch. 15, 46. BRODY, S. (1945). Bioenergetics and Growth. New York. BULLOUGH, W. S. (1946). Phtlot. Trans. B, 331, 453. BULLOUGH, W. S. (1948a). Proc. Roy. Soc. B, 135, 21a. BULLOUOH, W. S. (19486). Proc. Roy. Soc. B, 135, 233. BULLOUGH, W. S. (1949). J. Exp. Biol., 36, 76.
BURROWS, H. (1945). Biological Actions of the Sex Hormones. Cambridge.
HADDOW, A., ELSON, L. A., ROE, E. M. F., RUDALL, K. M. & TIMMIS, G. M. (1945). Nature, Lond.,
155.
379-HALDANE, J. B. S.F WIGCLESWORTH, V. B. & WOODROW, C. E. (1924). Proc. Roy. Soc. B, 96, 1.
HECHTKR, O., KROHN, L. & HARRIS, J. (1942). Endocrinology, 30, 598.
HEGNER, R. (1937). J. Parasit. 33, 1.
JANES, R. G. & NELSON, W. O. (1940). Proc. Soc. Exp., Biol., N.Y., 43, 340. NEHDHAM, J. (1931). Chemical Embryology. Cambridge.
NEEDHAM, J. (1942). Biochemistry and Morphogenesis. Cambridge. REYNOLDS, S. R. M. (1941). J. Invest. Dermat. 4, 7.
RUNNSTROM, J. (1934). Protoplasma, 20, 1.