39°
THE EFFECT OF TEMPERATURE ON CERTAIN
SIMPLE HAEMOLYTIC SYSTEMS
BY ERIC PONDER AND J. FRANKLIN YEAGER.
(From Washington Square College, New York University.)
(Received ist May, 1930.)
(With Four Text-figures.)
THIS paper is primarily concerned with an attempt to evaluate the temperature coefficients for the velocity of haemolysis in two simple haemolytic systems, the lysin being saponin in the first and sodium taurocholate in the second. There is nothing in the literature to suggest that the problem is one of any complexity, for Arrhenius (1915) and his collaborators, by whom most of the existing investigations have been carried out, find that the effect of temperature is adequately described by the well-known Arrhenius equation, the values of /n ranging from 26,000 when acetic, butyric, or proprionic acids are used as lysins to 38,000 when the lysin is sodium oleate. Their methods, however, are very unsatisfactory, for either the concentration of the lysin or the "time of action" (i.e. time required for the pro-duction of a particular degree of haemolysis) is fixed arbitrarily; further, the observations are made over a short temperature range, and usually between 200 and 400. Such experiments are too restricted to show the complete effects of temperature on the haemolytic systems, and, as will be shown below, lead to quite erroneous results1.
The study of the effect of temperature on simple haemolytic systems has a significance quite apart from any information which it may supply regarding the nature or the kinetics of the haemolytic process, for the system under consideration is one of much less complexity than those usually studied. Most of the recent work on the effect of temperature on biological systems has been devoted to finding the temperature coefficients for such processes as contraction in muscle, conduction in nerve, the movement of whole animals, etc.; sometimes the effect of temperature on the phenomenon has been found to be in accordance with the Arrhenius equation, sometimes not. It is of considerable interest, accordingly, to find to what extent such an equation describes the effect of temperature on simple systems such as those dealt with in this paper, especially when the effects in such systems can be subjected to a much more detailed analysis than is usually possible in investigations of this kind.
1
METHODS.
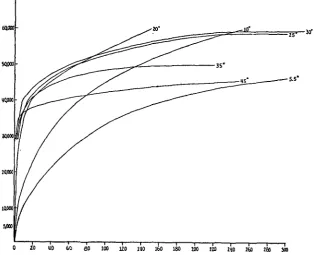
All the data for a study such as this can be obtained from a suitable series of time-dilution curves, i.e. curves showing the relation of the time required to produce complete haemolysis of a certain arbitrary number of red cells to the concentration (or dilution) of lysin producing the haemolysis. Such curves are obtained, at various temperatures, by a technique which has already been fully described (Ponder, 1923; Ponder and Yeager, 1929); any one concentration of lysin can then
[image:2.451.69.384.202.457.2]20 «0 60 60 100
Fig. 1. Time-dilution curves for saponin and human red cells at various temperatures. Some curves have been omitted to avoid overcrowding of the figure. Ordinate: dilution of lysin; abscissa: time in minutes.
be selected, and the relation between the temperature and the velocity of the haemolytic reaction (reciprocal of the time required for complete lysis) can be plotted in the usual way. The advantage of deriving the data from a complete set of time-dilution curves is that the relation between the temperature and the velocity of the reaction can be found for all concentrations of lysin within the experimental range, instead of for one arbitrarily selected concentration of lysin only.
392 E R I C PONDER AND J. FRANKLIN YEAGER
minutes or more at one extreme to times of 0-5 minute or less at the other, i A t h e revised technique recently described by us has been used throughout (Ponderand Yeager, 1929). For reasons of convenience, the observations at 50, io° and 150 were made in a refrigerator room containing the water bath and all the apparatus, etc.; the observations at higher temperatures were made in the usual manner.
RESULTS.
(1) Saponin.
The results obtained will be best understood by an inspection of Figs. 1 the first of which shows the time-dilution curves
from which the data are derived, and the second of which shows the logarithm of the velocity of haemolysis plotted against the reciprocal of the absolute temperature for a series of concentra-tions of lysin ranging from 1 in 6000 to 1 in 45,000. If the effect of temperature is described by the Arrhenius equation, the points obtained at different temperatures for any one concen-tration of lysin should fall on a straight line, the slope of which gives the temperature co-efficient /JL ; and further, if the haemolytic process is similar to the simple chemical processes with which it is often compared, the same tempera-ture coefficient should be obtained for all con-centrations of lysin, i.e. the lines in Fig. 2 should be parallel.
Inspection of Fig. 2 will show that neither of these conditions is fulfilled. In the first place, the points corresponding to any one concentration of lysin do not fall on a straight line over the entire temperature range, but only over its lower part (from 50 to about 200); above 200 the points deviate considerably from a straight line, the direction of the deviation generally indicating a diminution in velocity at these higher temperatures. This discontinuity in the neighbourhood of 200 is the rule rather than the exception in biological processes, and there are a number of ways of interpreting it. Some observers suppose that one reaction, with a high temperature coefficient, controls the
process below 15°-2O°, but that above these velocity; abscissa: reciprocal of temperatures the process becomes controlled
and 2,
15° TO° ii'3f 2f if 0X0)1 040& OjOOU
c^fccient than the first (Crozier, 1924; Glaser, 1924). Other investigators ignore tne^liscontinuity altogether, and base their calculations of the temperature coeffi-cient either on the part of the curve below the discontinuity or on the part above it. The simplest method of accounting for the results, however, is to assume that the cells of the tissues examined themselves undergo alteration at high temperatures, the alteration being either of the result of an irreversible "deterioration," or brought about by obscure changes in the physical, and perhaps in the chemical, properties of the protoplasm, as has been suggested by Heilbrunn and others (Heilbrunn, 1925). In the case of cardiac muscle, Brown (1930) has succeeded, in fact, in demonstrating that the "new /x value" above 200 is the result both of a destructive effect of the heat on the tissue ("deterioration") and also of obscure intercellular changes, the effect of which remains even after the " deterioration " has been allowed for; in view of the fact that these changes are so conspicuous above 200, Brown prefers to calculate the temperature coefficient of the process from the points observed below 150, but at the same time he implies that even these observations are probably affected by obscure changes in the system, these changes occurring at the lower temperatures as well as at the higher, but perhaps being reversible.
394
E R I C PONDER AND J. FRANKLIN YEAGERComparatively little regarding the temperature coefficient of the haemolytia cess, accordingly, is to be learnt from the conventional graphical representation ohhe way in which the velocity of the reaction varies with temperature, and it is scarcely more permissible to calculate a n value from the relatively straight line between 50 and 200, where the resistance of the system changes, although reversibly, with each change of temperature, than it is to calculate a fi value from the irregular line between 200 and 400, where the changes in the system are less regular and less reversible. We cannot be satisfied with such a procedure even as a rough approxima-tion, for as soon as we put it into practice we are confronted with a fresh difficulty, in that the various straight lines in Fig. 2 are not parallel. This results in a different
fj. value being obtained for each concentration of lysin, the value ranging from about
13000
so 100 1*0 ieo iM itt BO i<a 160 ia> 300
Fig. 3. Time-dilution curves for sodium taurocholate and human red cells. Ordinate: dilution of lysin; abscissa: time in minutes.
32,000 to about 27,000; there is no means of knowing, moreover, which of these values, if any, is the correct one. There is certainly no simple explanation, consistent with what is known regarding the kinetics of haemolytic systems, which can be advanced to reconcile this result with the theory of temperature coefficients, and we are accordingly forced to conclude that the effects of temperature, even in this very simple system, are too complex to be described by such an expression as the Arrhenius equation.
(2) Sodium taurocholate.
1000
th^^ne-dilution curves in Fig. 3 will show that the resistance of the system, as judged by the position of the asymptotes, first increases as temperature rises, and later falls, the system being at its maximum resistance at about 150. For this reason, among others, the relation between temperature and the velocity of the lytic reaction (Fig. 4) is far from simple, and is represented by a series of curves showing a number of alternating maxima and minima1.
It is obviously impossible to obtain a value for a temperature coefficient from these curves, especially as their slope may be
positive in some parts and negative in others. The curves, however, although of an un-familiar form, are not in any sense " irregular," for not only can they be readily reproduced, but they are derived from perfectly smooth and typical time-dilution curves; they differ con-siderably, at the same time, among themselves, in that the maxima and minima do not always occur at the same temperatures, and in that these maxima and minima are not always equally well marked. Comparison of the curves in Fig. 4 with those in Fig. 3, from which the former are derived, will show that ^ these differences in form are brought about by .5 two separate factors: (a) the variation in the •* position of the asymptotes of the time- ^ dilution curves, and (b) a change in the form -i of the time-dilution curves themselves with T
.9
variation in temperature. &
(a) The change in the position of the -7
asymptotes is essentially similar to the change * observed in the case of saponin, except that in .s the former case the asymptotic dilutions first 3 decrease and then increase, whereas in the \
latter case t h e y first increase a n d later d e - J- o.ooii o.ofe aorta o.<xm ox»is 0.0036 crease. T h e variation in the position of t h e Fig. 4. Analysis of results for sodium tauro-asymptOtes, moreover, is to be i n t e r p r e t e d in cholate and human red cells. Ordinate: , • • v r • • J- logarithm of velocity; abscissa: reciprocal t h e same way in either case, for It indicates of absolute temperature. The various curves variation in t h e resistance of t h e haemolytic correspond to various dilutions of lysin, as
system, i.e. in the quantity of lysin imagined n o t e d o p p o s i t e each
-to be combined, when lysis is complete, with the particular cell component affected. It is very difficult, however, to find any simple explanation for the occurrence of these changes; one might, indeed, expect that an increase of temperature would lead to a decrease in resistance, although exactly the opposite is usually the case. We must
•15° if a'
396 E R I C P O N D E R A N D J . F R A N K L I N Y E A G E R
leave the findings unexplained, accordingly, merely remarking that the incr^fe in resistance with increasing temperatures, unexpected though it is, leads, in m^xase of saponin at least, to quite a usual result, i.e. the falling away of the curves in Fig. 2 from the linear portion which corresponds to the range of lower temperatures.
(b) The change in the form of the time-dilution curves themselves, so well
seen in Fig. 3 and also to a lesser extent in Fig. 1, is perhaps less difficult to account for than the changes in the position of the asymptotes, but is nevertheless very difficult to analyse. The general subject of the form of the time-dilution curves has been fully discussed in another paper (Ponder and Yeager, 1929), and it has been shown that the curve is best described by the expression
in which c is the initial concentration of lysin producing lysis in time t, x the con-centration corresponding to the asymptotes, k a constant, and p a constant which determines the form of the curve, just as the value of x determines the position of its asymptote. It is also shown that a special physical significance can be attached to the constant />, if we imagine that each molecule of the cell component reacts with a number of lysin molecules, and that the latter may exist in groups or aggregates of varying size. The velocity of a reaction occurring in such a system may then be represented by dx/dt = k (c - x)" (2),
where n is the value of the ratio (mean number of lysin molecules reacting with each cell component molecule)/(mean number of lysin molecules in a lysin aggregate); whence, if we write p = ijn, we obtain expression (1).
Applying this hypothesis to the cases under consideration, it'is not surprising to find that different values of n are required to describe the time-dilution curves at various temperatures. In many cases the difference in form between curves at different temperatures is easily seen, e.g. in Fig. 1, the curves at 5-5°, 350 and 450 approach nearly the same asymptote, which enables their very different form to be appreciated at once. A similar instance in the case of Fig. 3 may be found in the curves at io° and 200; these approach nearly the same asymptote, but are totally different in form. There is little point in describing the complete analysis of these curves or of tabulating the various values of k, x and n obtained1; it is sufficient to observe that the effect of temperature is to alter the essential conditions on which the kinetics of the haemolytic systems depend. In scarcely any sense, therefore, is the velocity of the process at 50 comparable with the velocity of the process at 10° or at any other temperature, for the differences in velocity correspond to differences
1 Even k, it should be observed, is a complex constant, although in expression (2) it appears
quantities, k, x and n; the Arrhenius equation can therefore scarcely be expected to describe the results, since it assumes that changes in temperature affect only the velocity constant.
The curve for the action of sodium taurocholate at 5-5° shows in a peculiar way the effect of temperature on the haemolytic system, for here we see a distinct retardation of lysis in the dilution of 1 in 6000, followed by more rapid lysis by the dilutions of 1 in 7000 and 1 in 8000. This phenomenon (often referred to as a "zone phenomenon") is quite characteristic of the lysin sodium glycocholate, and is frequently met with in sodium taurocholate systems when sugars are present; in the latter case, at least, it has been shown to be brought about by the activity of the haemolysin itself being depressed, and it is probably permissible in this case also to attribute its appearance to an effect of the low temperature on the physical state of the lysin in the particular dilutions concerned. It is certainly not difficult to imagine that semi-colloidal lysins such as the saponins and the bile salts may undergo quite marked and perhaps abrupt changes in physical state as their temperature is in-creased ; the fact can, indeed, be demonstrated experimentally, as will be seen below.
(3) Irreversible Effects of Temperature.
The difference between the properties of a haemolytic system at two different temperatures, e.g. 50 and 200, may be either reversible or irreversible. In order to see how we may distinguish between these two kinds of change, let us examine some specific examples. Suppose that we plot a time-dilution curve for a haemolytic system first at 50 and then at 200; call these curves A and B. The fact that these two curves are different indicates that a change in the system has resulted from the increase in temperature. Let us now warm the cell suspension to be added to the haemolytic system by raising it to 200 for a period of, say, 30 minutes, cool it to 50, add it to various dilutions of lysin at 50, and so plot a curve at 5° for a system which differs from that used in obtaining curve A only in that the cells have been previously raised to 20°. Call the resulting curve C. Obviously, if A and C coincide, no irreversible change has resulted from warming the cells to 200, although the fact that A and B differ indicates that a change, which we may call "reversible," has occurred. If A and C do not coincide, however, the temperature of 200 must have produced a change which persists even after the lower temperature of 50 is again established; this change we call irreversible.
Continuing, the experiment may be modified by raising the lysin dilutions to 200 for 30 minutes, cooling to 50, and plotting a curve D by the addition of cells which have not been exposed to the higher temperature. If D and A coincide, no irreversible change has been produced in the lysin at 200; if they do not, an irre-versible difference has been established. Again, both cells and lysin can be heated to 200 separately, but mixed at 50 to produce curve E; again this may coincide with
A or may not. Yet another modification is to cool (i) cell suspension, (ii) lysin, or
cells and lysin, to i°, to warm again to 50, and then to plot curves F, G
H, which may or may not coincide with A; in this way it may be discovered
whether cooling the components of the haemolytic system results in irreversible changes or not. Finally, there are innumerable modifications of the experiment
398 E R I C PONDER AND J. FRANKLIN YEAGER
possible by employing temperatures other than 50 and 200, e.g. 10° and 2O^pto° and 400, etc.
In order to illustrate the type of change met with in the systems under considera-tion, we shall give a number of experiments in detail.
The first experiment is concerned with the effect of changing the temperature of cells and of saponin within the limits of the range i° to 220. The dilution of lysin is represented by S, and the times in minutes taken for lysis in the standard system at 140 by /j.The column headed t2 gives the times for complete lysis at 140 in a system composed of lysin together with cells which have been heated to 220 for 3 hours, and then cooled to 140. Under t3 are times for lysis of cells at 14
0
by lysin dilutions which have been warmed to 22° for 3 hours. To obtain the column t4, the lysin dilutions were placed in the ice-box for 3 hours, and lysis afterwards carried out at 140, whereas the times for systems at 140 containing cells which had been kept for 3 hours in the ice-box are shown in the column under t6. In practice, all five time-dilution curves were obtained simultaneously.
Table I. s 10,000 20,000 30,000 40,000 50,000 60,000 70,000 80,000 h o-o 3 9 6-8 n - 8
21-8
35"5 57"S
106-0
3-5
I2-I
2 3 O 8 7 O
150-0
3-8
n - 6
21-5 44-0
9 8 0
170-0
3 9 1 2 7
20-4 43 0 85-5 126-0 h — 3'3 — 1 3 8 1 8 8 3 8 0 6 8 0
1080
From these figures we may conclude: (i) that warming either the cells or the lysin to 220 results in a slight increase in resistance, and (ii) that cooling the cells produces a slight increase in resistance, and (iii) that all these changes are very small, and are exhibited principally in connection with the higher dilutions of the lysin.
The second experiment to be recorded concerns the effect of warming cell suspension or saponin dilutions to a temperature of 400. Here ^ gives the standard curve at 250, t2 the curve for a system composed of lysin plus cells which had been heated to 400 for 3 hours, and t3 the curve for a system composed of cells plus lysin which had been heated to 40° for 3 hours.
Table II. 8 10,000 20,000 30,000 40,000 50,000 60,000 70,000 80,000 90,000 100,000 '1 O-2 o-S
I - I
—
5° —
16-0
4 3 ° 95-°
2350
k
O-2
o-S
I - I
1-9 4'3 1 3 2 2 4 S
7 7 °
300-0 — h O-2 o-s 1-2 2-O 4/5 8-8 i4'5
can conclude from this table that heating the lysin to 400 has very little but that a similar treatment of the cells results in a considerable increase in resistance.
Carrying out similar experiments with sodium taurocholate as the lysin, we obtain the following results: tt gives the times for a standard curve at 25°, and
t2 the times for a system in which the cells had been heated to 420 for 3 hours, and
tz the times for a system in which the cells had been cooled to io° for 3 hours.
Table I I I .
8 1000 2000 3000 4000 5000 6000 7000 8000 h os I'O 1 6 3-9 14-3 35-5 90-0 140-0 h O S 0 9 1-7 4-5 iS-S 39-0 135° t, O S 0 9 17 47 io-o
45 0 no-o
200-0
As before, both heating and cooling the cells to 42° and to 10° respectively increases the resistance, but only very slightly. In the last experiment of the four, the effect of warming the dilutions of sodium taurocholate to 420 for 3 hours is investigated; tx gives the standard curve at 250, and t2 the curve, also at 250, for the system containing previously warmed lysin.
Table IV. 8 1000 2000 3000 4000 5000 6000 7000 8000 «i 0 4 I'O 1 7 3 0 8 0 183 4 1 0 1050 U o-35 0 7 i-3 2 9 8-4 35-o 70-0 2IO-O
The effect of temperature on the lysin is quite marked, although perhaps not so marked as we might expect in the case of so unstable a haemolysin. It will be seen that the curve for the second system crosses the curve for the standard system, the times in column t2 being first shorter than those in t1} but afterwards longer,
i.e. both the asymptote and the value of n are different in the two curves.
400 E R I C PONDER AND J. F R A N K L I N YEAGER
case of saponin. There is no need, however, to account for such deviations on the grounds that changes in temperature produce irreversible changes cells or in the lysins, for they are far more probably due to reversible changes, i.e. to differences which exist in the state of the cells and lysins at different temperatures, but which are not producible at one temperature and detectable at another.
CONCLUSIONS.
Two varieties of conclusion may be drawn from the foregoing investigation, the first relating to the temperature coefficients of the haemolytic processes studied, and the second relating to temperature coefficients in general.
The most outstanding fact is that both the simple haemolytic systems studied are apparently too complex to be described by the Arrhenius equation. It is impos-sible, as a consequence, to arrive at a value for the temperature coefficient; the best we can do, in the case of saponin haemolysis, is to say that the value of /A may be between 25,000 and 34,000, while in the case of sodium taurocholate haemolysis we cannot form any idea of the value of the temperature coefficient at all. The principal reason for this failure is that the Arrhenius equation is an expression which describes the effect of temperature on the velocity constant of a system, while, in the cases under consideration, a change of temperature does not change only the velocity constant, but alters the system in other ways; the changes are, in fact, far too complex to allow us to treat the process of haemolysis as if it were a simple chemical reaction. It appears, rather, to be a reaction of quite a complicated kind, for both the cells and the haemolysin, as well as the reaction between them, undergo changes with changes of temperature; a system containing lysin and cells at 200 is,, accordingly, by no means the same system, from the point of view of its kinetics, as a system of the same lysin and the same cells at 300. Such results might be considered as supporting the extreme position of Heilbrunn (1925), who has objected to applying to heterogeneous systems the type of analysis which applies to homogeneous systems and who concludes that it is not only useless to compare temperature coefficients obtained from biological processes with those obtained from chemical reactions, but useless to attempt to invest the former with any significance at all.
It is of considerable interest to compare the above results and the conclusions drawn from them with the results and conclusions of other workers, using other biological material. When we do so, we are at once struck by the fact that most investigations made hitherto have been concerned with much more complex systems than those with which this paper deals, but that, at the same time, the results have been much more simple1. Temperature coefficients have been obtained, for example, for such processes as the contraction of muscle, the movement of unicellular organisms, and even for certain responses of the whole organism; in many such
1
velocities have proved not so very different from those produced by the nius equation, and in many cases the more pronounced irregularities associated with the simple systems described in this paper have apparently been absent. It is at first sight a remarkable fact that the reactions of a complex system to temperature should appear simpler than those of a simpler system; such a result, however, is in conformity with a principle which applies to all investigations of this kind.
In the simplest case in which the velocity of a reaction is influenced by tempera-ture, the velocity constant, k, is a particular function of temperatempera-ture, and the Arrhenius equation is followed. In a more complex case, such as that of either of the haemolytic systems considered above, several independent constants are functions of temperature, i.e. k, x,n = / (t). Unless k, x and n are all similar func-tions of temperature, and are funcfunc-tions, moreover, of a particular kind, the Arrhenius equation cannot possibly apply, and the result of plotting the logarithm of the velocity against the reciprocal of the temperature will be a curve, the complexity of which will depend on the extent and on the particular way in which x and n vary with temperature. The complex curve may present, indeed, an almost unlimited number of forms, may show maxima and minima, and may show variations in form corresponding to variations in the concentration of the reacting substances, as in the cases referred to in this paper, i.e. if one form of curve is found under a set of conditions A, a different form may arise under a set of conditions B, provided any of the constants are influenced by conditions A or B.
Suppose, however, that we study a very complex system, in which twenty or more constants concerned in the reaction are functions of temperature, i.e. where k,
a,b,c, ... —f(t), the functions being of different kinds. Under such circumstances,
in accordance with well-known statistical rules, the result of plotting the logarithm of the velocity against the reciprocal of the temperature will be, in many cases at least, a smooth curve, devoid of obvious maxima or minima, and often easily mis-takable for a straight line. Further, if the curve is obtained under various sets of conditions A, B, C, etc., the form of the curve will tend to be similar under all sets of conditions which do not change a large number of the many constants which are functions of temperature. It is by no means surprising, accordingly, that a complex system (such as an entire cell or an entire organism) should yield an apparently simple " temperature coefficient," nor that a much simpler system should fail to do so. This principle, although not usually formulated, can be illustrated by several quite familiar examples1. The titration curve of a monobasic acid, for instance, is a smooth curve of familiar form. The titration curve of a dibasic acid is more complex, and that of a tribasic acid more complex still; when we consider the curve for a poly-basic acid such as a protein, however, we may again revert to the simple form, and the curve can be treated as that of a monobasic acid. Consider, again, the crossing of two organisms of single factor difference. The result is a bimodal curve, but the crossing of two organisms differing by many factors affecting the same characters is a simple frequency curve. The more complicated the state of affairs, indeed, the
402 E R I C PONDER AND J. FRANKLIN YEAGER
simpler does the final result seem to be. As a last example, consider the j ^ combining waves of various forms, as in harmonic analysis; the result of combming a few waves of different forms is in general to produce an apparently less smooth and simple wave form than is produced by combining many different forms; here, again, an apparent simplicity is effected by an increase in the complexity of the conditions.
The recognition of these facts considerably limits the possibility of determining temperature coefficients in biological processes. Suppose, for example, that we study some reaction of an intact animal (or even of an intact cell) to temperature; provided the system possesses a sufficient degree of complexity, the odds are over-whelmingly in favour of the plotting of the logarithm of the velocity against the reciprocal of the absolute temperature resulting in a smooth curve which may possibly be mistaken for an approximation to a straight line. We shall be unable, however, to investigate any of the intracellular processes involved in the reaction by investigating the slope of such a line, for regarded from the point of view either of the kinetics of the individual intracellular reactions or from the point of view of the Arrhehius equation, the line (or curve) is meaningless for at least two reasons, (i) If there are several reactions involved in bringing about the total response, it is mathematically demonstrable that the slope of the line (or of the curve) is not determined by the temperature coefficient of any one of them alone; a n value of 10,000, say, derived from the line, does not indicate that any one of the individual reactions has this temperature coefficient, or even that the average p. value of the reactions is 10,000. (ii) The fact that the entire system appears to follow the Arr-henius equation does not even necessarily indicate that any one of the underlying reactions does so; further, if a series of /x values are obtained for various parts of the temperature range, there is no reason to suppose either (a) that each new slope corresponds to a new reaction, or (b) that the /* values obtained for various slopes have any direct relation to the temperature coefficients of the various underlying reactions in the system under consideration.
SUMMARY.
1. When saponin or sodium taurocholate are used as haemolysins for human red cells, the effect of temperature on the haemolytic process cannot be adequately described by the Arrhenius equation.
2. The failure of this equation to describe the results is due to the fact that changes of temperature affect several constants in the equation for the reaction between the lysin and the cells and not the velocity constant only.
REFERENCES.
AHHHENIUS (1915). Qualitative Laws in Biological Chemistry, p. 65; BROWN (193°)- Joum. Exp. Biol. 7, 373.
CROZIER (1924). Journ. Gen. Physiol. 7, 123, 189;
FULMER and BUCHANAN (1928). Proc. Soc. Exp. Biol. and Med. 26, 446. GLASER (1924). Journ. Gen. Physiol. 7, 177.
HEILBRUNN (1925). Science^ 62, 268.
MORGAN (1926). American Naturalist, 60, 506. PONDER (1923). Proc. Royal Soc. B, 95, 42.