©IJRASET: All Rights are Reserved
14
CFD Analysis of Nano Fluid on Heat Exchangers
Dhanendra Sahu1, Dr. D. N. Dewangan2
1, 2
Department of Mechanical Engineering, RungtaCollege of Engineering and Technology, Raipur.
Abstract: Augmentation of heat transfer is one of the important characteristics of nano fluids thereby being used in heat exchangers. This research investigates the application of nano fluids in shell and tube heat exchanger using Computational Fluid Dynamics. The CAD model of heat exchanger is developed using Creo 2.0 software and CFD analysis is conducted using ANSYS CFX software. Different volume concentrations of TiO2/water nanofluid is used and results are compared with base
fluid i.e. water. Standard k-epsilon turbulence model is used for CFD simulation which gave reasonable good predictions of fluid flow.
Keywords: Nano fluids, Shell and Tube Heat Exchanger, CFD
I. INTRODUCTION
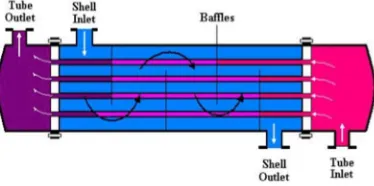
Heat exchangers are one of the mostly used equipment in the process industries. Heat exchangers are used to transfer heat between two process streams. One can realize their usage that any process which involves cooling, heating, condensation, boiling or evaporation will require a heat exchanger for these purposes. Process fluids, usually are heated or cooled before the process or
[image:1.612.215.402.382.475.2]undergo a phase change. Different heat exchangers are named according to their applications. For example, heat exchangers being used to condense are known as condensers, similarly heat exchangers for boiling purposes are called boilers. Performance and efficiency of heat exchangers are measured through the amount of heat transferred using least area of heat transfer and pressure drop. A better presentation of its efficiency is done by calculating over all heat transfer coefficient.
Figure 1: Shell and Tube Heat Exchangers
II. LITERATURE REVIEW
Albadr et al. [1] experimentally studied horizontal shell and tube heat exchanger for forced convective heat transfer and flow characteristics of a counter flow under turbulent flow conditions for water as base fluid and different volume concentrations of Al2O3 nanofluid. They found that nanoparticles dissolved in distilled water not only increases thermal conductivity but also viscosity
of the nanofluid. Friction factor increases with the increase in volume concentration of nanoparticle. Particle volume concentration of 2% the use of Aluminum oxide nanofluid gives significantly higher heat transfer characteristics.
Farajollahi et al. [2] Used shell and tube heat exchanger for comparative investigation of Al2O3 and TiO2 water nanofluid. They studied that at different nanoparticle concentrations the heat transfer enhancements of both nanofluids are different. TiO2/water and
γAl2O3/water nanofluids has better heat transfer at higher volume concentrations, respectively.
Tiwari et al. [3] investigated experimentally to optimize particle volume fractions depends on a high heat transfer rate, convective heat transfer coefficient, also overall heat transfer coefficient, effectiveness and performance index. They gives result that the optimum volume conc. of Al2O3, CeO2, SiO2 and TiO2 nanoparticles in water were 0.75, 1.0, 0.75 and 1.25 vol.%, for maximum heat transfer rate, overall heat transfer coefficient, convective heat transfer coefficient and effectiveness, respectively.
©IJRASET: All Rights are Reserved
15
The CAD model is developed using Creo 2.0 software which is sketch based, feature based parametric 3D modelling software developed by PTC. The software exhibits bi-directional associativity and parent child relationship.
Table 1: Heat Exchanger Dimensions SPECIFICATION DIMENSIONS Length of heat
exchanger, L
600mm
Shell inner diameter, DS 90mm Tube length, l 600mm Tube outer diameter, do 20mm No. of tubes, Nt 07mm Tube pitch &geometry,
Pt
30mm
[image:2.612.179.437.260.630.2]Baffle spacing, ∆Bt 86mm Baffles thickness, t 03mm No. of baffles Nb 6
Figure 2: CAD model of shell and tube heat exchanger
©IJRASET: All Rights are Reserved
16
Figure 3: Imported CAD model in ANSYS design modeler
[image:3.612.170.444.278.440.2]The CAD model imported is meshed in ANSYS mesher using tetrahedral elements. The tetrahedral elements are selected due to complex geometry. The size function is set to fine and inflation normal.
Figure 4: Meshed CAD model in ANSYS
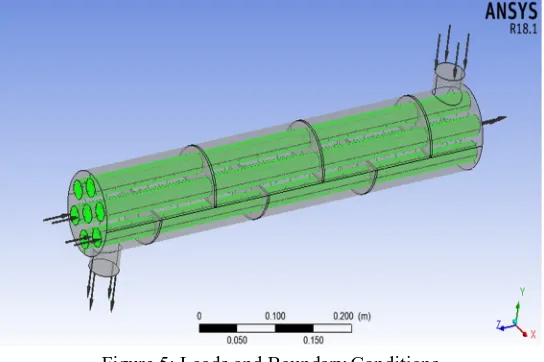
The number of modes generated is 195516 and number of elements generated is 573617.For analysis 2 domains are defined, one is shell domain and other is tube domain. The shell is continuous domain comprising of fluid with assigned material properties. The reference pressure is set to 1 atm and turbulence model set to k-epsilon. The fluid model is set to thermal energy.
Figure 5: Loads and Boundary Conditions
[image:3.612.171.443.505.686.2]©IJRASET: All Rights are Reserved
17
Figure 6: Temperature plot using water as fluid
[image:4.612.198.416.331.456.2]The temperature plot shown in figure 5.1 above shows higher temperature near inlet upto mid-section of shell and thereby reduces on moving towards exit and other zone. The maximum temperature is neat hot fluid inlet at temperature 340K. The temperature after mid-section is 330K and on lower zone is 318K.
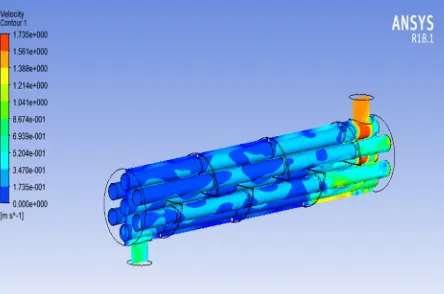
Figure 7: Velocity plot using water as fluid
The fluid velocity is highest near hot fluid inlet with magnitude of 1.69m/s and reduces on moving towards exit and .5 m/s at mid-section of shell as shown in figure 7 above. Further analysis is conducted using using TiO2/water (.5% volume concentration)
Figure 8: Temperature plot using TiO2/water (.5% volume concentration)
[image:4.612.170.443.506.646.2]©IJRASET: All Rights are Reserved
18
Figure 9: Velocity plot using TiO2/water (.5% volume concentration)
[image:5.612.196.419.286.424.2]The fluid velocity is highest near hot fluid inlet with magnitude of 1.658m/s and reduces on moving towards exit and .31 m/s at mid-section of shell as shown in figure 9 above. Further CFD analysis is conducted using TiO2/water (1% volume concentration)
Figure 10: Temperature plot using TiO2/water (1% volume concentration)
The temperature plot shown in figure 10 above shows higher temperature near inlet upto mid-section of shell and thereby reduces on moving towards exit and other zone. The maximum temperature is neat hot fluid inlet at temperature 340K. The temperature after mid-section is 320K and on lower zone is 312K.
Figure 11: Velocity plot using TiO2/water (1% volume concentration)
[image:5.612.196.418.499.646.2]©IJRASET: All Rights are Reserved
19
[image:6.612.196.414.76.191.2]The temperature plot shown in figure 12 above shows higher temperature near inlet upto mid-section of shell and thereby reduces on moving towards exit and other zone. The maximum temperature is neat hot fluid inlet at temperature 340K. The temperature after mid-section is 330K and on lower zone is 320K. The fluid velocity is highest near hot fluid inlet with magnitude of 1.67 m/s and reduces on moving towards exit and .45 m/s at mid-section of shell as shown in figure 13 below.
Figure 13: Velocity plot using TiO2/water (1.5 % volume concentration)
Design of heat exchanger is done by LMTD method and tubular exchangers manufacturers association standard. The log mean temperature difference is defined using following formula
LMTD = ∆Tm =∆T1− ∆T2 /ln ( ∆T1/ ∆T2) Where ΔT1=THin -TCin
THin – Hot fluid inlet temperature
TCin – Cold fluid inlet temperature
Table 2: Inlet and Outlet temperatures using different fluids Fluids THin (K) THout (K) Heat
Transfer Rate Q = mhCph
∆Th(W)
TiO2/water
(1.5% volume concentration)
340 321.82 31513
TiO2/water (1%
volume concentration)
340 322.39 30958
TiO2/water (.5%
volume concentration)
340 313.49 47409.15
[image:6.612.194.422.277.397.2] [image:6.612.193.423.522.723.2]©IJRASET: All Rights are Reserved
20
Figure 14: Heat transfer rate using different fluids
The heat transfer characteristics of different fluids are shown in figure 14 above. The graph shows highest heat transfer characteristics using water followed by by TiO2/water nano fluids with 1.5% volume fraction. The heat transfer rate is lowest with
TiO2/water nano fluids with 1% volume fraction
VI. CONCLUSION
CFD analysis of shell and tube heat exchanger is conducted using ANSYS CFX software using two variable k-epsilon turbulence model. Nano fluids (TiO2/water) are used for analysis and compared with water. The detailed results are discussed below:
A. CFD simulation has served as cost saving and time saving tool to predict fluid flows and temperature distribution.
B. Two variable k-epsilon model has provided reasonable flow predictions of fluid across heat exchanger.
C. The temperature drop for hot fluid obtained using TiO2/water nano fluids is higher as compared to water with .5% volume
fraction.
D. The temperature drop for cold fluid obtained using TiO2/water nano fluids is higher as compared to water with 1.5% volume
fraction.
E. LMTD (Log Mean temperature difference is highest for TiO2/water nano fluids with 1.5% volume fraction. F. LMTD (Log Mean temperature difference is lowest for water.
G. The heat transfer rate is highest with water followed by TiO2/water nano fluids with 1.5% volume fraction. H. The heat transfer rate is lowest with TiO2/water nano fluids with 1% volume fraction.
REFERENCES
[1] J. Albadr , S. Tayal , M. Alasadi, Heat transfer through heat exchanger using Al2O3 nanofluid at different concentrations, Case Studies in Thermal Engineering, 1(1), 2013, 38–44
[2] B. Farajollahi, S.Gh. Etemad , M. Hojjat , Heat transfer of nanofluids in a shell and tube heat exchanger, International Journal of Heat and Mass Transfer, 53(1-3),2010, 12–17
[3] A. K. Tiwari , P. Ghosh , Jahar Sarkar, Particle concentration levels of various nanofluids in plate heat exchanger for best performance” International Journal of Heat and Mass Transfer 89,2015, 1110– 1118
[4] Wael M. El-Maghlany , A. A. Hanafy , A. A. Hassan , M.A. El-Magid, Experimental study of Cu– water nanofluid heat transfer and pressure drop in a horizontal double-tube heat exchanger, Experimental Thermal and Fluid Science, 78, 2016, 100–111
[5] Y. Vermahmoudi, S.M. Peyghambarzadeh, S.H. Hashemabadi, M. Naraki , Experimental investigation on heat transfer performance of Fe2O3/water nanofluid in an air-finned heat exchanger, European Journal of Mechanics B/Fluids ,44, 2014, 32–41
0 10000 20000 30000 40000 50000 60000