LEAF: Leave-one-out Forward Selection Method
for Gene Selection in DNA Microarray Data
Kentaro Fukuta and Yoshifumi Okada
Abstract—Preventing, diagnosing, and treating disease is
greatly facilitated by the availability of biomarkers. Recent improvements in bioinformatics technology have facilitated large-scale screening of DNA arrays for candidate biomarkers. Here we discuss a gene analysis method that we call the
LEAve-one-out Forward selection method(LEAF) for discovering
informative genes embedded in expression data, and propose an additional algorithm for extending LEAF’s capabilities. An iterative forward selection method incorporating the concept of leave-one-out cross validation (LOOCV), LEAF provides a discrimination power score (DPS) for genes. We show that LEAF identifies genes that correspond to known biomarkers. Therefore, our method should provide a useful bioinformatics tool for biomedical, clinical, and pharmaceutical researchers.
Index Terms—biomarkers, data mining, gene expression
profiles, cancer classification.
I. INTRODUCTION
Recent progress in bioinformatics technology has facili-tated large-scale screening for candidate biomarkers [6]. A biomarker, as the name implies, is a cell-derived substance such as a gene, protein or enzyme that can be used to elucidate physiological or pathological process [5]. In our previous study, we have proposed a novel method called LEAve-one-out Forward selection method (LEAF) for anal-ysis of gene expression data [8]. This method enabled us to construct a ranking system of informative genes using a parameter reflecting the efficiency of the class discriminant designated the Discriminant Power Score (DPS).
We applied LEAF to three public leukemia datasets (ALL/AML, ALL/MLL, and MLL/AML) [1], [7]. The re-sults show that our method yields a stable discriminant result with 100% accuracy using a three-gene set. Furthermore, some genes with high DPS values are cancer-related genes (top-hgenes), as clarified by research in recent years.
Nevertheless, two problems remain to be resolved, namely: (1) We have not selected a criterion for defining theh-value. (2) The candidate list of associated genes is insufficient to assign a discrete biological function (correlation and causal relation between genes).
Here we briefly introduce LEAF and then propose a solution to address these problems. Thus, using public gene function database, we propose a simple and straightfor-ward method for determining the top-h genes (h-value) and conduct a biological functional analysis of the genes. Subsequently, we conduct a biological functional analysis of the genes, using public gene function database.
Kentaro Fukuta received his Ph.D. in engineering from Muroran In-stitute of Technology, Japan, in 2008. His current research interests are bioinformatics, Kansei engineering, and ontology engineering. (e-mail: [email protected]).
Yoshifumi Okada received his Ph.D. in engineering from Muroran Insti-tute of Technology, Japan, in 2002. His current research interests are bioin-formatics, Kansei engineering, data mining, statistical pattern recognition, and signal processing. (e-mail: [email protected]).
II. METHODOLOGY
A. Datasets
We used three well-known leukemia datasets provided by Armstrong et al., which includes acute lymphocytic leukemia (ALL), mixed lineage leukemia (MLL), and acute myeloge-nous leukemia (AML) [1]. These datasets are available at the Broad Institute [7]. Details of the datasets are summarized in Fig. 1A.
Fig. 1B presents two datasets are arranged in the form of a data matrix. The matrix size isCN×T G, whereCN de-notesClass1 N+Class2 N. Furthermore,Class1 N and
Class2 N, respectively, represent the number of samples in Class 1 and Class 2, andgk(k= 1,2, . . . , T G)corresponds to a gene expression value, andT Gsignifies the total number of genes:T G= 12,582.
B. LEAF: LEAve-one-out Forward selection method
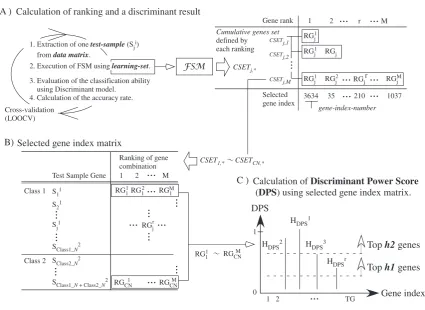
We have proposed a robust and accurate gene selection method based on forward selection called forward selection method (FSM) [10]. To satisfy a maximal variance ratio (F -value) between two disease classes, FSM cumulatively se-lects gene one-by-one and ultimately identifies a set of genes (a gene ranking) that is informative for disease classification. In fact, LEAF is an iterative FSM inspired by leave-one-out cross validation (LOOCV) [9]. Details of the algorithm have been published [8]. Figure 2 outlines the method. First, one test sample is taken from the dataset. Then the remaining samples are used as a learning set. Subsequently, we apply FSM to the learning set and obtain a gene ranking. These steps are repeated for every test sample.
Finally, we extract a highly robust set of genes in a classification based on discriminant power, called DPS. DPS is a parameter of the class discriminant ability defined for all genes.DP S(k) (1kT G)represents the DPS value of the gene with thek-th gene-index-number.
Figure 3 displays the DPSs of genes calculated from the respective pairs of the leukemia datasets. The horizontal axis shows the gene index number, and the vertical axis indicates the DPS given for each gene. The DPS graph can help visualize genes’ statistical importance. Genes with higher DPSs can be regarded as those contributing more significantly to discrimination between the classes. That is, significant genes are represented as peaks in the DPS graph.
C. Determination method of h-value (top-h genes)
Preparation of data Leukemia dataset [7]
ALL (Acute lymphocytic leukemia)
Class (#Genes : 12582) Samples : N
AML (Acute myelogenous leukemia) MLL (Mixed lineage leukemia)
24
28 20
ALL vs. AML Dataset name
MLL vs. AML ALL vs. MLL
AML (28)
AML (28) MLL (20) Class 2 (N) Class 1 (N)
ALL (24)
MLL (20) ALL (24)
A) B)
Data matrix for LEAF
Class 1 Class 2 Sample ID 1 Class1_N 2
...
CN = Class1_N
+ Class2_N
...
Class1_N + 1
S11
S21
SClass1_N1
SClass2_N2
SCN2
Sample Gene
[image:2.595.84.510.235.545.2]Gene index number 1 g1 2 g2 TG gTG
...
...
...
...
k gk...
...
Fig. 1. Preparation of dataset.
Gene index
1
0
DPS
1 2
...
TGTop h1 genes HDPS1
HDPS2 H
DPS3
HDPSr
Calculation of Discriminant Power Score
(DPS) using selected gene index matrix.
Top h2 genes
CSET1,* CSETCN,*
Selected gene index matrix
Class 1
Class 2 S11
S21
SClass1_N2
SClass2_N2
SClass1_N + Class2_N2
Test Sample Gene
Ranking of gene combination 1
RG11
2
...
M...
...
...
C )
RG12 RG1M
RGjr Sj1
...
...
...
...
RGCNM RGCN1
...
...
...
...
RG11 RGCNM1. Extraction of onetest-sample(Sji)
from data matrix.
2. Execution of FSM using learning-set.
Cross-validation (LOOCV)
Calculation of ranking and a discriminant result
FSM CSETj,*
3. Evaluation of the classification ability using Discriminant model.
4. Calculation of the accuracy rate.
A ) 2 Selected gene index 3634 1
...
...
Cumulative genes set
defined by each ranking
gene-index-number
M
...
RGj1 RGj1 RG
j
RGj1 RG j 2 RG j M 35 1037 Gene rank
...
...
r r RGj...
210...
CSETj,1CSETj,2
CSETj,M
B)
Fig. 2. Overview of LEAF’s methodology.
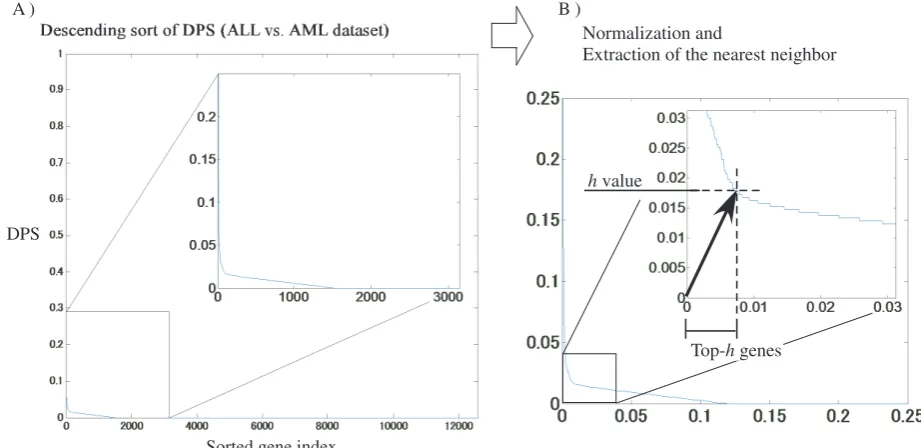
function. The identification method of the h-value is illus-trated in Fig. 4. Theh-value is calculated by the following steps:
1) Descending sort of DPS (Fig. 4A). 2) Decision of h-value.
a) Normalize the horizontal and vertical axes by di-viding by their respective maximum values (Fig. 4B).
b) Find the shortest Euclidean distance on the DPS graph to the origin. The abscissa value of the point is called theh-value.
c) Extract the set of genes having DPSsh-value. d) Recreate a DPS graph using only the gene set
obtained in Step (c).
e) Repeat from Step (a) to Step (d) unless the num-ber of points is 1 or all points take an identical
distance.
Thus, we employ the nearest neighbor point (h-value) from the origin for detecting drastic curvature in the descending sorted-DPS graph. We can then extract genes having high DPSs, which are ranked higher than the h-value. This method narrows down top-h-genes by interactively iterating the above procedure. Obviously, many iterations drastically decrease gene numbers, potentially eliminating biologically meaningful genes. In this study, therefore, the number of iterations in the decision of h-value is set to two (the respectiveh-values are referred to ash1 andh2).
III. BIOLOGICAL FUNCTION ANALYSIS
0 2000 4000 6000 8000 10000 12000 14000 0
0.1 0.2 0.3 0.4 0.5 0.6 0.7 0.8 0.9 1
Gene index number DPS
a) DPS vs. gene-index-number of ALL vs. AML dataset
0 2000 4000 6000 8000 10000 12000 14000
0 0.1 0.2 0.3 0.4 0.5 0.6 0.7 0.8 0.9 1
Gene index number DPS
b) DPS vs. gene-index-number of ALL vs. MLL dataset
0 2000 4000 6000 8000 10000 12000 14000
0 0.1 0.2 0.3 0.4 0.5 0.6 0.7 0.8 0.9 1
Gene index number DPS
[image:3.595.55.542.52.200.2]c) DPS vs. gene-index-number of MLL vs. AML dataset
Fig. 3. DPS vs. gene-index-number of leukemia dataset.
A )
Descending sort of DPS (ALL vs. AML dataset)
B )
Normalization and
Extraction of the nearest neighbor
DPS
Sorted gene index
[image:3.595.60.521.240.464.2]Top-h genes h value
Fig. 4. Outline for definingh-value.
TABLE I
h-VALUES ANDDPSOFLEUKEMIADATASET
Dataset h1 DPS h2 DPS ALL vs. AML 104 0.0168 10 0.1287 ALL vs. MLL 123 0.0192 11 0.1030 MLL vs. AML 139 0.0179 9 0.1042
discriminatory power to different classes. We conducted a biological function analysis of gene group in reference to the Gene ontology tool [2], [3] and the University of Washington’s L2L microarray analysis tool [11]. Below we focus on the top-h2 genes’ biological function.
In the L2L program, a p value for the significance of overlap between the given list and the function list of the databases is calculated by using the binomial distribution. Tables III, IV and V summarizes the L2L results. In the three datasets, we can observe that functions related to human cancer, such as colon carcinoma, gastric cancer, and breast cancer, exhibit statistical significance.
Table. II summarizes the primary functions of the
top-h2 genes obtained using Gene ontology. As expected, genes
related to leukemia in addition to leucocyte communication, such as TCL1A, RPL38, CALLA, and IL8RB [4], are selected from every dataset pair. In particular, it should be noted that ribosomal protein L38 (RPL38) is highly expressed in pancreatic cancer cell lines [12].
IV. GENE ANALYSISFRAMEWORK
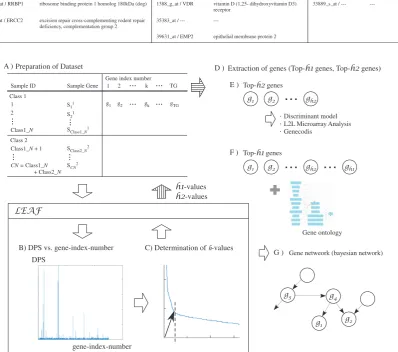
For basic biomedical and translational research purposes, it is not sufficient to list informative candidate genes without knowing the pathways in which their products participate. Our method for mining biomarkers is based upon differen-tial gene expression analysis, thereby providing functional information. We propose this as a gene-analysis framework, which applies LEAF. An overview of the framework (Fig. 5) illustrates the processes by which it operates.
1) Analysis of the dataset using LEAF, and display of DPS (Figs. 5A and B).
2) Calculation ofh-values (Fig. 5C).
3) Extraction of the genes based on theh-value (Fig. 5D). 4) Analysis of top-h2 genes (Fig. 5E).
TABLE II
SUMMARY OF THE TOPh2GENES RANKED BYDPS
DPS
ranking A) ALL vs. AML dataset
1 39318_at / TCL1A T-cell leukemia/lymphoma 1A 33412_at / --- --- 35307_at / GDI2 GDP dissociation inhibitor 2 Input name / Gene name
2 AFFX-M27830_5_at / --- --- 1984_s_at / ARHGDIB Rho GDP dissociation inhibitor (GDI) beta 31397_at / ---
---3 34085_at / RPL38 ribosomal protein L38 34699_at / CD2AP CD2-associated protein 35083_at / FTL ferritin, light polypeptide
4 38955_at / AVPR1A arginine vasopressin receptor 1A 39857_at / STX11 syntaxin 11 664_at / IL8RB interleukin 8 receptor, beta
5 39243_s_at / PSIP1 PC4 and SFRS1 interacting protein 1 36897_at / --- --- 35896_at / --- ---6 33099_at / FUT5 fucosyltransferase 5 (alpha (1,3) fucosyltransferase) 32755_at / ACTA2 actin, alpha 2, smooth muscle, aorta 33008_at / ---
---7 34863_s_at / SCCPDH saccharopine dehydrogenase (putative) 1389_at / MME membrane metallo-endopeptidase, common ALL antigen (CALLA)
979_g_at / ---
---8 37913_at / DHFR dihydrofolate reductase 38083_at / NOTCH2 Notch homolog 2 (Drosophila) 39175_at / PFKP phosphofructokinase, platelet Description
B) ALL vs. MLL dataset
Input name / Gene name Description
C) MLL vs. AML dataset
Input name / Gene name Description
9 33213_g_at / RRBP1 ribosome binding protein 1 homolog 180kDa (dog) 1388_g_at / VDR vitamin D (1,25- dihydroxyvitamin D3) receptor
33889_s_at / ---
---10 32397_r_at / ERCC2 excision repair cross-complementing rodent repair deficiency, complementation group 2
35383_at / ---
---11 39631_at / EMP2 epithelial membrane protein 2 h2
value
A )
Class 1
Class 2 Sample ID 1 Class1_N
2...
CN = Class1_N
+ Class2_N
...
Class1_N + 1 S11
S21
SClass1_N1
SClass2_N2
SCN2
Sample Gene
Gene index number 1
g1
2 g2
TG gTG ...
... ...
...
k gk
...
...
Preparation of Dataset
LEAF
B) DPS vs. gene-index-number
DPS
gene-index-number
C) Determination of D-values h1-values h2-values
D ) Extraction of genes (Top-h1 genes, Top-h2 genes)
Top-h2 genes
g3 g4
g1 g2
Discriminant model L2L Microarray Analysis Genecodis
g1 g2 gh2
g1 g2 gh2 gh1
Gene netweork (bayesian network) Gene ontology
E )
Top-h1 genes
F )
[image:4.595.103.502.205.557.2]G )
Fig. 5. Overview of the framework.
b) Output of a summary (i.e., Table II). 5) Gene-network analysis for top-h1 genes.
6) Output of the dependency rules based on probabilistic reasoning.
Interaction between genes can be inferred using the model of dependency structure (correlation and causal relationship). Figure 5G shows that gene-network analysis expresses a dependency using a graphical structure.
A graph node is a gene; an arrow represents the existence of dependency between nodes. One method of building gene networks uses a Bayesian network [13], [14]. We can apply probabilistic reasoning [15] and search for the biological process that supports discovery of a biomarker. Moreover, in this framework, we use biological ontology for
the construction and interpretation of a Bayesian network. Gene Ontology (GO) is a popular gene function database consisting of three independent ontologies: Biological pro-cess, molecular functions, and cellular components. Each node of the ontology corresponds to a certain biological function and includes one or more genes.
Actually, GO does not have only a common vocabulary in biological science. It does provide a classification tree of the concept of generalization and specialization (i.e., the “part-of link” for which biological process A consists of a molecular interaction X and Y.).
probabilistic reasoning. We store the candidate of a biological process sought by the agent as a general knowledge format (OWL ontology).
V. CONCLUSION
LEAF is an iterative FSM incorporating the concept of LOOCV; it also provides a DPS of genes. Moreover, we can determine the top-h according to the distribution of DPS value for each dataset using a simple algorithm for determining h-values. The h-values can be used as criteria for identifying candidate or informative genes. Our method shows that the biological functions of extracted genes cor-respond well with those reported in the literature. Finally, we propose a gene analysis framework for using LEAF for basic biomedical research and drug discovery. From these results, we expect that our method will provide a powerful tool to explore biomarker candidates and as a new method for disease diagnosis.
We plan to develop an automatic detection method ofh -value based on information criterion such as AIC (Akaike Information Criterion) [18] and evaluate the usefulness of the method by applying it to other datasets.
ACKNOWLEDGMENTS
A part of this work was supported by Promotion for Young Research Talent and Network from Northern Advancement Center for Science & Technology (NOASTEC Japan) and Grant-in-Aid for Young Scientists (B) No.21700233 from MEXT Japan.
REFERENCES
[1] S. A. Armstrong, J. E. Staunton, L. B. Silverman, et al. MLL translo-cations specify a distinct gene expression profile that distinguishes a unique leukemia. BioinNature Genetics, 30(1):41–47, 2001. [2] Gene Ontology Consortium. Gene ontology: tool for the unification
of biology.Nature Genetics, 25:25–29, 2000.
[3] Gene Ontology Consortium. the gene ontology. http://www.geneontology.org/, 25:25–29, 2000.
[4] T. Doan, R. Melvold, S. Viselli, Carl, and P. Waltenbaugh.Lippincott’s Illustrated Reviews: Immunology. Lippincott Williams and Wilkins, 2007.
[5] Foundation for the National Institutes of Health. The biomarkers consortium. http://www.biomarkersconsortium.org/, 2007.
[6] T.-R. Golub, D.-K. Slonim, P. Tamayo, C. Huard, M. Gaasenbeek, M. J.-P., H. Coller, L. M.-L., J.-R. Downing, M.-A. Caligiuri, et al. Molecular classification of cancer: class discovery and class prediction by gene expression monitoring.Science, 286:531–537, 1999. [7] Broad Institute. Broad Institute of MIT and Harvard.
http://www.broadinstitute.org/, 2010.
[8] F. Kentaro, N. Tomomasa, and O. Yoshifumi. Leaf: leave-one-out forward selection method for cancer classification using gene expres-sion data.9th IEEE/ACIS International Conference on Computer and Information Science (ICIS 2010), 31–36, 2010.
[9] P. A. Lachenbruch.Discriminant Analysis. Gendai-Sugakusha, Kyoto, 1979.
[10] H. Mitsubayashi, S. Aso, T. Nagashima, and Y. Okada. Accurate and robust gene selection for disease classification using a simple statistic. Bioinformation, 3(2):68–71, 2008.
[11] University of Washington. L2L microarray analysis tool. http://depts.washington.edu/l2l/, 2007.
[12] F. Sahin, W. Qiu, R. E. Wilentz, C. A. Iacobuzio-Donahue, A. Gros-mark, and G. H. Su. RPL38, FOSL1, and UPP1 Are Predominantly Ex-pressed in the Pancreatic Ductal Epithelium.PANCREAS, 30(2):158– 167, 2005.
[13] F. Jensen,An introduction to Bayesian Networks. University College London Press, 1996.
[14] E. N. Richard,Learning Bayesian Networks. Prentice Hall, 2003. [15] J. Pearl, Probabilistic Reasoning in Intelligent Systems. Morgan
Kaufmann, San Mateo, CA, 1988.
[16] Wooldridge, M.J. and Jennings, N.R., Intelligent Agents: Theory and Practice. Knowledge Engineering Review, vol. 3, no. 2, pp. 115–152, 1995.
[17] Fabio Bellifemine,Developing Multi-Agent Systems with JADE. John Wiley and Sons, Ltd, 2004.
TABLE III
FUNCTION ENRICHMENT ANALYSIS(L2L)FOR THE TOP-h2GENES OFALLVSAMLDATASET
Function name p-Value Description
Downregulated in MES cells from elongin-A knockout mice 5.33e-04
elongina_ko_dn
Upregulated by UV-B light in normal human epidermal keratinocytes, cluster 1 4.08e-03
uvb_nhek1_c1
Down-regulated in models of both replicative (high-passge human foreskin fibroblast) and induced (repression of E7 in HeLa) cellular senescence.
5.11e-03 senescence_rep-ind_dn
Downregulated by TSA at 48 hrs in SW260 colon carcinoma cells
5.19e-03 hdaci_colon_tsa48hrs_dn
TABLE IV
FUNCTION ENRICHMENT ANALYSIS(L2L)FOR THE TOP-h2GENES OFALLVSMLLDATASET
Function name p-Value Description
Downregulated by curcumin at 12 hrs in SW260 colon carcinoma cells
4.57e-03 hdaci_colon_cur12hrs_dn
Downregulated in samples of gastric cancer refractory to 5-FU/cisplatin treatment, compared to chemosensitive controls
9.12e-03 refractory_gastric_dn
TABLE V
FUNCTION ENRICHMENT ANALYSIS(L2L)FOR THE TOP-h2GENES OFMLLVSAMLDATASET
Function name p-Value Description
Gene set that can be used to differentiate BRCA1-linked, BRCA2-linked, and sporadic primary breast cancers
8.83e-04 breastca_three_classes
Genes known to be induced by hypoxia 3.04e-03
hypoxia_review
Gene set that can be used to differentiate BRCA1-linked and BRCA2-linked breast cancers