Flow control through vortex shedding interaction on one
cylinder downstream of another
DAKKA, Sam <http://orcid.org/0000-0001-9225-761X> and PAYTON,
Jonathan
Available from Sheffield Hallam University Research Archive (SHURA) at:
http://shura.shu.ac.uk/14007/
This document is the author deposited version. You are advised to consult the
publisher's version if you wish to cite from it.
Published version
DAKKA, Sam and PAYTON, Jonathan (2017). Flow control through vortex shedding
interaction on one cylinder downstream of another. International Journal of
GEOMATE, 12 (33), 53-59.
Copyright and re-use policy
See
http://shura.shu.ac.uk/information.html
Sheffield Hallam University Research Archive
FLOW CONTROL THROUGH VORTEX SHEDDING INTERACTION OF ONE CYLINDER DOWNSTREAM OF ANOTHER
Jonathan Paytonand Sam M Dakka
Department of Engineering and Mathematics, Sheffield Hallam University, United Kingdom
ABSTRACT
This study investigates the vortices produced between two 2d cylinders, and the relationship between the structures of the vortices produced at both cylinders when one is placed in the wake flow of another. CFD simulations using ANSYS Fluent were used to determine the coefficients of lift and drag, as well as the frequency of vortex shedding and size of vortices at three separate Reynolds numbers of 16000, 32000 and 65000 in different arrangements. Each arrangement of cylinders was compared against controls, which consisted of a single cylinder to determine the alteration of forces produced. Two trip wires at 7 different angles of 40, 45, 50, 55, 60, 65, and 70 degrees were then investigated at a Reynolds number of 65000 which was compared to the smooth cylinder control forces and frequency of vortex shedding. The most optimum angle of trip wires was then combined with linear cylinder arrangements also at a Reynolds number of 65000 for comparison with only the upstream cylinder utilizing the trip wires.
Keywords: Vortex, Shedding, Flow, Control, Strouhal
INTRODUCTION
Vortex shedding is a phenomenon that occurs with non-aerodynamic bodies at specific Reynolds numbers. The vortex shedding of the air in this periodic system can occur because the air flow sticks to the surface of the cylinder due to the Coanda effect [1], whereby the entrainment, the transportation of a fluid between two separate bodies of fluid by a shear induced turbulent imbalance [2], is reduced, due to the restriction caused by the interference by the surface of the cylinder. A pressure difference occurs between the surface and the fluid jet or flow, from the uneven distribution of momentum, and the change in acceleration that results from it to reach equilibrium [1]. This pressure change deflects the fluid jet towards the surface, causing the air to attach to, and follow the curvature of the surface. The separation of the boundary layer causes a large pressure difference forming the wake flow of the cylinder, and forms vortices generated by this pressure difference.
A vortex or Eddy is a circulating flow of air around an axis. The acceleration of this air increases with the reduction in diameter closer to the central axis in irrotational vortices. Using Helmholtz’s vortex theorems relating to inviscid flows, negating any influence from shear stresses, the theoretical behavior of these vortices can be explained, whereby the strength of a vortex remains equal along its entire length, the vortex lines of the path traveled by the air in the vortex remains on that same line and is constant; and irrotational vortices remain irrotational providing there are no rotational forces external to the vortex [3]. In Karman vortex streets, the rotation direction about these axes of the vortices alternates with each successive vortex produced, because each
one is being generated by the air flow from either side of the bluff body.
The flow instability is caused by the Kelvin– Helmholtz instability [4], which is formed when two flows of different velocities interact, Fig. 2. The turbulence experienced in both of these separate flows over both sides of the cylinder causes varying velocities, which generates the formation of this instability when these velocities interact in the wake flow [4].
The trip wires, control rods, or some form of a roughness element body can be used to reduce the vortex shedding produced by the cylinders [5]. The angle at which the rods are placed in front of the cylinder influences the airflow around the cylinder. A trip wire reduces the drag by accelerating the transition of the boundary layer separation from the laminar stage to the turbulent [6]. This allows for the air to reattach to the surface of the bluff body at an earlier stage across the bluff body, because the kinetic energy is increased. This effect of reducing the drag only occurs at certain Reynolds numbers that are above subcritical. Subcritical flow means the transition from laminar to turbulent occurs in the wake of the cylinder [7].
NUMERICAL METHOD
SEE-Osaka, Japan, Nov. 21-23, 2016
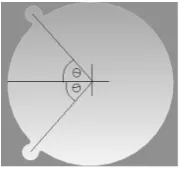
The model used to simulate the vortices was the Detached Eddy Simulation SST k-Omega with double precision to accurately model the flow in a transient state with hybrid initialization. One two dimensional, theoretically infinite cylinder of diameter 0.0127m was generated, and separate Reynolds numbers were simulated at 16000, 32000 and 65000. Higher Reynolds numbers required lower time steps, with 16000 being simulated at time steps of 0.0005, 32000 being simulated at 0.0001, and 65000 being simulated at 0.00005 time step intervals. Monitors were placed on each cylinder, a coefficient of drag monitor parallel to the flow of the fluid and a coefficient of lift perpendicular to the flow direction. Arrangements of the two cylinders used can be seen in Fig 1.
[image:3.595.74.283.282.411.2]
Fig. 1 Smooth cylinder arrangements.
For each Reynolds number, the boundary layer thickness was determined using the following Equations; Eq. 2 was used due to the boundary layer becoming turbulent as the rolling motion of the boundary layer occurs across the cylinder with 10 inflation layers used at inflation sizing 0.0002.
Re
/
)
*
491
.
0
(
d
(1) 2 . 0Re
/
)
*
382
.
0
(
*
d
(2)Table 1 Boundary Layer Thickness
Reynolds Number Laminar Boundary Layer Thickness (m) Turbulent Boundary Layer Thickness (m) 16000 0.00049 0.0007 32000 0.00035 0.00061 65000 0.00025 0.00053
The inlet velocity was calculated based on equation 3, Re- Reynolds number, p- density,
- dynamic viscosity. This can be seen in Table 2.
/
)
*
*
(
Re
p
d
U
(3)Table 2 Inlet Velocity Relating to Reynolds Number
Re. No. 103
Density (kg/ m3)
Dynamic Viscosity (kg/m/s) 10-5 Diameter (m) Inlet Vel. (m/s)
16 1.225 1.7894 0.0127 18.4 32 1.225 1.7894 0.0127 36.806 65 1.225 1.7894 0.0127 74.76
Equation 4: St- Strouhal number, w- vortex frequency, i- vortex length.
U
i
w
St
(
*
)
/
(4)Simulations were run for a minimum of five coefficients of lift oscillations, to be able to record the average value when calculating the frequency for the Strouhal number. Each graph was magnified to reduce the margin of error with the pixel ruler being used for each measurement taken. A mean average was taken of the coefficient of lift oscillations to ensure that any minor variations that could generate errors were reduced. These were taken by the distances between crests, and between troughs. The frequency was scaled - dependent to the time step used - to 1 second, to meet the metric standard constraints to calculate the Strouhal number, and divided by the average distance between oscillations. A similar method was also used finding the average maximum coefficient of lift with a zero origin line on the y axis to be able to calculate this distance vertically to the y axis scale.
The size of the control rods used was one tenth the size of the diameter of the cylinder. For this specific cylinder the diameter of the control rods were 1.27mm. In order to prevent the mesh becoming highly skewed from tangent circles and influencing the simulation, fillets were placed between the tangent contact points, which were equal to the radius of the control rods (Fig. 2). Reference values for total circumference in fluent was calculated accordingly.
[image:3.595.72.283.604.685.2][image:3.595.361.452.631.716.2]
RESULTS
[image:4.595.309.524.92.379.2]Averaged results were obtained and plotted to identify trends.
Fig. 3 Strouhal number Reynolds number 65000 in each arrangement
The same frequencies of shedding was experienced on the upstream cylinder and the downstream cylinder. The length of the vortices produced had little change with each arrangement.
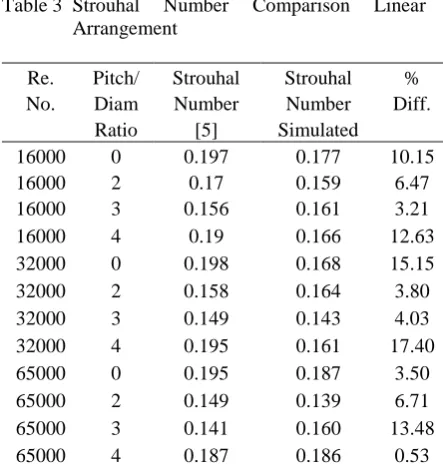
Table 3 Strouhal Number Comparison Linear Arrangement
Re. No.
Pitch/ Diam Ratio
Strouhal Number
[5]
Strouhal Number Simulated
% Diff.
16000 0 0.197 0.177 10.15 16000 2 0.17 0.159 6.47 16000 3 0.156 0.161 3.21 16000 4 0.19 0.166 12.63 32000 0 0.198 0.168 15.15 32000 2 0.158 0.164 3.80 32000 3 0.149 0.143 4.03 32000 4 0.195 0.161 17.40 65000 0 0.195 0.187 3.50 65000 2 0.149 0.139 6.71 65000 3 0.141 0.160 13.48 65000 4 0.187 0.186 0.53
The Strouhal number relative to each arrangement was close to that expected (Table 3). To obtain a more accurate result with the simulated graphs, the time step could be reduced to an even smaller iteration to allow for a graph that contains wider oscillations for more accurate measurements since will reduce the error obtained from pixel variations from the measurements taken with more definitive crests and troughs. The longer the simulations were left to run, the more compressed the graphs became, making the margin of error larger.
Fig. 4 Coefficient of Drag of the upstream cylinder in each arrangement
Fig. 5 Coefficient of Drag of the downstream cylinder in each arrangement
The drag force exerted by the cylinders, vary with the arrangement. The formation at a 90 degree angle results in a lower coefficient of drag with an increasing pitch to diameter ratio (Fig. 4, 5).
When compared to the downstream cylinder (Fig. 4, 5), the linear formation shows a significant drop in coefficient of drag compared to the upstream cylinder, which is caused by the cylinder located directly in the wake flow of the upstream cylinder. Since the arrangement of the downstream cylinder at 45 and 90 degrees is not directly in the wake flow at any pitch to diameter ratio, the coefficient of drag of the downstream cylinder in this arrangement is higher than the linear formation downstream cylinder.
The coefficient of drag generally decreases with an increasing pitch to diameter ratio, which is the same relationship for the coefficient of drag at 90 degrees for the downstream cylinder. At 90 degrees, both the upstream and downstream cylinder share the same coefficient of drag due to the arrangement being perpendicular to the flow, meaning the downstream cylinder is not influenced by the wake flow of the upstream cylinder (Fig. 4, 5).
[image:4.595.70.283.149.271.2] [image:4.595.70.292.371.607.2]SEE-Osaka, Japan, Nov. 21-23, 2016
increase with an increasing pitch to diameter ratio, but in a linear formation the downstream cylinder experiences the same maximum coefficient of lift at all three ratios at 2.25 (Fig. 7) and an increasing coefficient in the upstream cylinder with increasing pitch to diameter ratios (Fig. 6).
Fig. 6 Maximum Coefficient of lift reached – upstream cylinder
Fig. 7 Maximum Coefficient of Lift reached – downstream cylinder
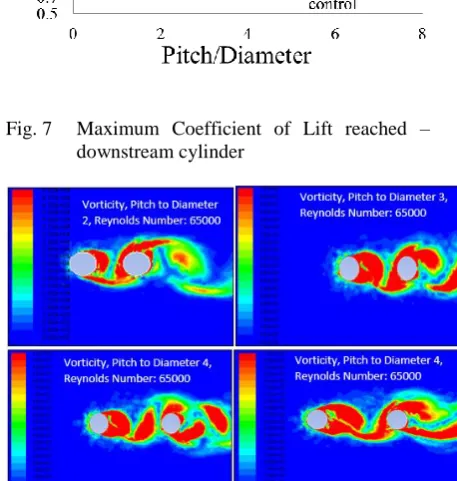
Fig. 8 Vorticity cut plot at different pitch to diameter ratios with two shown at a ratio of 4
The 45 degree arrangement results in a shedding that is interrupted towards the downstream cylinder at lower ratios of pitch to diameter (Fig. 6) and some reduction in low pitch to diameter ratios of the
downstream cylinder (Fig. 7).
The structure of the flow in the linear formation parallel to the freestream velocity, changed with changing pitch to diameter ratios. The flow structure seen in Fig. 8 is similar to that documented by Alam MM. At a pitch to diameter ratio of 2, front side reattachment of the flow is visible at a Reynolds number 65000, which fits in Alam’s flow structure range at a pitch to diameter of 1.5 to 2.2. At a pitch to diameter ratio of 3, the same type of flow is seen as before, which matches the flow structure described by Alam’s in the range of a pitch to diameter ratio of 2.7 to 3.9. At a pitch to diameter ratio of 4 both the forms of the bi-stable flow was seen at Reynolds number 65000 (Fig. 8).
Table 4 shows a reduction in the sum of the upstream and downstream cylinders coefficient of drag, averaged across the three angles simulated. The drag reduces with an increased pitch to diameter ratio, and also with an increase of the three Reynolds numbers simulated.
Table 4 Cumulative Mean Average Coefficient of Drag Comparison that includes all 3 Angles of Arrangements
The frequency of shedding increased when compared to a cylinder without control rods present for control rod arrangements simulated at angles 40, 45 and 70 degrees (Fig. 10). It is expected the Strouhal number would increase further after 70 degrees. The Strouhal number decreased significantly up to an angle of control rod arrangement of 55 degrees.
Fig. 10 Strouhal number of Trip wire angles compared to smooth cylinder – Reynolds number 65000
Re. No.
Pitch/ Diam. Ratio
of 2
Pitch/ Diam. Ratio of 3
Pitch/ Diam. Ratio
[image:5.595.74.284.175.303.2] [image:5.595.310.523.399.483.2] [image:5.595.68.297.422.663.2] [image:5.595.308.524.603.727.2]The control rods reduce the overall coefficient of drag produced by the cylinder, with all coefficients of drag lower than that of the control (Fig. 11). With an increasing angle of the arrangement of the control rods, the coefficient of drag increases. It is expected that the coefficient of drag will increase until a 90 degree formation, since this will generate the highest profile drag.
Fig. 11 Coefficient of Drag of Trip wire angles compared to smooth cylinder control – Reynolds number 65000
Similar to the coefficient of drag, the maximum coefficient of lift (Fig. 12) generally increases with an increasing angle arrangement. The maximum coefficient of lift produced (Fig. 12) is lower than the coefficient of lift produced by the control. The coefficient of drag is lowest at an angle of 40 degrees (Fig. 11) - and is expected to be even lower at lower angles since it separates the boundary layer at an earlier stage of the cylinder.
Fig. 12 Coefficient of Lift of Trip wire angles compared to smooth cylinder control Reynolds number 65000
Figure 12 shows the reduction of the coefficient of lift when control rods are introduced. The coefficient gradually increases with an increase in angle of trip wire placement.
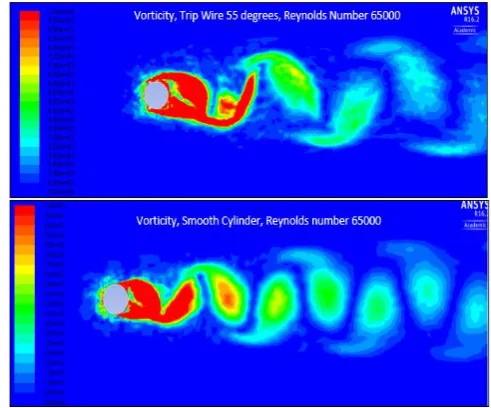
The vorticity cut plot comparison (Fig. 13) shows the decreased frequency of the vortex shedding when control rods are used at a 55 degree angle placement. The vorticity of the vortices produced later in the wake of the cylinder when the control rods are used are consequently less than that of the control cylinder. The frequency of the shedding per second is close to 1100 with the
control, to close to 870 when the trip wires are introduced at a 55 degree angle.
Fig. 13 Vorticity cut plot of Trip wire 55 degrees compared to smooth cylinder
Fig. 14 Strouhal number of Trip wire 55 degrees within arrangement –Reynolds number 65000
[image:6.595.308.554.130.334.2] [image:6.595.71.284.190.289.2] [image:6.595.311.523.409.524.2] [image:6.595.69.283.463.568.2] [image:6.595.309.525.478.698.2]SEE-Osaka, Japan, Nov. 21-23, 2016
When Fig. 14, 15 are compared, different Strouhal numbers are experienced on each cylinder theoretically unlike dual smooth cylinders. The vortices experienced in a linear arrangement aft of the arrangement is that of the downstream cylinder, since this bluff body interrupts the upstream vortex production.
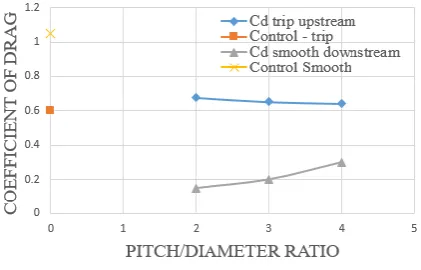
Fig. 16 Comparison between the trip upstream cylinder and the smooth downstream cylinder average coefficient of drag against each of the original control values
The results of the downstream cylinder linear arrangement with changing pitch to diameter ratios increasing, with the most optimum control rod angle placement of 55 degrees on the upstream cylinder showed an increase in the coefficient of drag greater than the trip control, a similar relationship to Fig. 4, . This increase from the control in Fig. 16 is reduced in comparison to Fig. 4. The coefficient of drag decreases towards the value of the control with an increasing pitch to diameter ratio (Fig 14). The downstream cylinder showed a mirrored relationship whereby the coefficient of drag increased with an increase in pitch to diameter ratio (Fig. 16). When Fig 4, 5 and Fig. 16 are compared, the reduction between the cumulative coefficients of drag with the linear arrangement is 0.775 at a pitch to diameter ratio of 2, 0.85 at a pitch to diameter ratio of 3 and 0.68 at a pitch to diameter ratio of 4.
CONCLUSIONS
To reduce the frequency of the shedding, and also to reduce the overall drag produced if multiple cylinders in close proximity are used, a linear arrangement with a pitch to diameter ratio of 2 would be used with no trip. More investigation is needed into pitch to diameter ratios lower than this point in order to find the most optimum performance for shedding frequency. It would be expected that reverse flow reattachment would be seen in the structure of the flow, with an even lower coefficient of drag from the downstream cylinder. The highest drag produced by the downstream cylinder is in the
90 degree formation since little interaction occurs between the cylinders. Due to the increased difference of drag at increasing Reynold numbers, the importance of the arrangement is high.
The trip wire arrangement showed a reduced coefficient of drag at a Reynolds number of 65000; and a reduced maximum coefficient of lift which gradually increased with an increasing angle of control rod placement. The most optimum angle for flow control was 55 degrees.
The arrangement with the presence of a trip on the upstream cylinder resulted in a reduced coefficient of lift on both the upstream and downstream cylinder when compared to the same non-trip arrangement. The coefficient of drag of the downstream cylinder arrangement with a trip is also lower than the non-trip arranged downstream cylinder. The upstream cylinder also has a reduced coefficient of drag, making it the lowest overall coefficient of drag with two cylinders.
ACKNOWLEDGEMENT
The work is part of dissertation submitted by Jonathan Payton in partial fulfillment of
Bachelor Degree in engineering at Engineering and Math Department, Sheffield Hallam University, UK
REFERENCES
[1] S. &. C. Thermofluids, "Coanda Effect," 2014. [Online].Available:
http://www.thermofluids.co.uk/effect.php [2] Turner J S, Buoyancy Effects in Fuids,
Cambridge University Press,1973. [3] Yang J, "Vorticity Theorems," 2012.
[4] Laroussi M et al. "Triggering vortex shedding for flow past circular cylinder by acting on initial conditions: A numerical study," Computers & Fluids, Vol. 10, 2014, pp. 194–207.
[5] Alam MM, "Suppression of fluid forces on two staggered cylinders,"Procedia Engineering, Vol. 56, 2013, pp. 173-178.
[6] S. Behara, "Transition of the boundary layer on a circular cylinder in the presence of a trip," Journal of Fluids and Structure, Vol. 27(5), 2011, pp.702-715.
[7] Doolan CJ, "Large eddy simulation of the near wake of a circular cylinder at sub-critical Reynolds number", Enginnering applications of fluid mechanis, Vol. 4 (4), 2010, pp. 496-510. [8] [Online]. Available:
[image:7.595.72.283.178.313.2]