KORMANN, Mariza and LOCK, Gary
Available from Sheffield Hallam University Research Archive (SHURA) at:
http://shura.shu.ac.uk/5285/
This document is the author deposited version. You are advised to consult the
publisher's version if you wish to cite from it.
Published version
KORMANN, Mariza and LOCK, Gary (2013). Dynamic models to reconstruct ancient
landscapes. In: CONTRERAS, F., FARJAS, M. and MELERO, F.J., (eds.) CAA 2010:
Fusion of Cultures. Proceeding s of the 38th Annual Conference on Computer
Applications and Quantitative Methods in Archaeology. BAR International Series
(2494). Oxford, UK, Archaeopress, British Archaeological Reports, 169-176.
Copyright and re-use policy
See
http://shura.shu.ac.uk/information.html
Sheffield Hallam University Research Archive
1
Dynamic Models to Reconstruct Ancient Landscapes
Kormann, M.C.1, Lock, G.2 1
Kellogg College, University of Oxford, UK 2
Department for Continuing Education and School of Archaeology, University of Oxford, UK
[email protected], [email protected]
Abstract
In this paper a method of landscape analysis is demonstrated through raster-based digital elevation models (DEM) using the case-study of the Helike Delta, Gulf of Corinth, Greece. In the Classical Period, Helike was the seat of the Achaean League and the worship centre of the god Helikonian Poseidon. With the focus on the earthquake and tsu-nami of 373BC, DEMs are generated using dytsu-namic models of sea level rise, tectonic and pulse tectonic uplift, sub-sidence, and sediment deposition. Starting with a DEM from the present day landscape, simulated DEM models are generated for the Early Helladic II/III (2500-2100BC), Classical (480-323BC), Hellenistic (323-146 BC), and Roman (1st Century BC – 4th Century AD Periods). The models shed light on archaeological interpretation concerning the continuity and discontinuity of human occupation in the Helike Delta. Moreover, the method demonstrates a new ap-proach to dynamic landscape analysis using GIS that is general and can be applied to any landscape.
Keywords: GIS, dynamic models, raster-based DEM, landscape analysis, geomorphology, geoarchaeology, Helike Delta
1.
Introduction
The Helike Delta is one of the most seismically active regions of Greece. The Eliki fault is a 22km long nor-mal fault consisting of two colinear segments of 9 and 13km (Eastern and Western Eliki Faults, Figure 1) sepa-rated by a step-over or transfer zone (KOUKOUVELAS
et al., 2001, 2005a). The transfer zone causes the two segments to behave independently during seismic events and having separate effects on the topography of the Delta such as changing the courses of the local rivers
(POULIMENOS and DOUTSOS, 1996;
KOU-KOUVELAS et al., 2005b). Seismic and aseismic
tec-tonic uplift are continuously raising the mountains to-gether with the Delta. During periods of aseismic uplift high energy sediment deposition from the rivers causes rapid progradation of the Delta and, at major earth-quakes, the entire plain to the north of the fault experi-ences abrupt subsidence causing agradation of the Delta with marine transgression at lower elevations, soil
lique-faction and submarine landslides (SOTER et al., 2001).
This pattern of continuously changing shoreline, which also depends on the rate of sea level rise, is characteris-tic of the Holocene and it affects other regions of the Gulf as well and it has been well documented in ancient literature.
The complex archaeological stratigraphy of the Delta is thus a consequence of earthquakes with co-seismic tectonic uplift, aseismic tectonic uplift, uneven
[image:2.595.312.539.502.645.2]subsid-ence, soil liquefaction, flood debris flow, colluvial and alluvial sediment deposition, terrestrial and marine landslides, and seismic sea waves. Stratigraphy can change abruptly in only a few metres resulting in a land-scape difficult to unravel, but one that offers interesting and challenging questions.
Figure 1: The Helike Delta between the Selinous and Keryn-itis rivers and the Western and Eastern Eliki faults (from
Cundy and Stewart (2004)).
Geo-graphic Information Systems (GIS) based dynamic models are proposed and validated by extensive bore-hole, environmental and excavation data, and cross-validated against archaeological and literary sources. Related research questions are concerned with generat-ing and testgenerat-ing models of tsunami reach, and the inter-pretation of ancient written sources concerned with the earthquake and tsunami of 373BC.
Related previous work using modelling techniques in
connection with a GIS include CLELAND et al. (2008)
on Native American use of recessional shorelines over a 700 year period. The models use a variety of environ-mental data including geology, hydrology, biology and archaeology resulting in distribution maps plotted over the period and used both for analysis and validation. The work of NUNEZ, VIKKULA and KIRKINEN (1995) explores shoreline modelling in an isostatic up-lifting region of Finland. A raster-based DEM approach estimates past elevations as a function of time and the only variable considered is isostatic uplift enabling the establishment of a relationship between ancient site lo-cation and shoreline. GILLINGS (1995) describes a model of flood dynamics in the Tisza Valley, Hungary. Supported by borehole data, a DEM model was used to simulate past environments and fluvial behaviour and the relationship to cultural activity leading to new hy-potheses of land exploitation and raising interesting questions to be tested with independent data. SMITH (1995) has demonstrated how GIS can support broad based studies of ancient landscapes in Greece and how these can be validated by and linked to written sources. It was established that in Classical Greece all minting activities occurred at lower elevations; also, the inter-pretation of Pausanias acquired a new dimension con-cerning spatial relationships between locations and writ-ing sequences.
The research discussed above uses GIS in three dis-tinct and discrete ways:
1. The use of a variety of environmental, geological
and archaeological data to validate models of sea-land relationships;
2. The use of a dynamic model applied to a current
DEM where a geological variable (tectonic uplift) is used to generate past environments; and
3. The use of ancient writings to guide analysis and
interpretation of DEM based models.
This paper argues for a comprehensive approach to landscape analysis using GIS. The method proposed here integrates the three approaches above into a single framework. A case study of the Helike Delta landscape is modelled for the Early Helladic, Classical, Hellenis-tic, and Roman Periods. It is shown that DEM dynamic models supported by detailed geological quantification and validated by environmental and archaeological data and ancient written sources can effectively be used for landscape analysis.
The rest of this paper is organized as follows. Section 2 outlines the proposed methodology. Section 3 de-scribes a particular way of acquiring a DEM through remote sensing. Section 4 describes the proposed dy-namic model and Section 5 presents simulation results. Finally, Section 6 presents a discussion and conclusion.
2.
Methodology
In order to reconstruct and validate ancient landscape models a four-step methodology is proposed:
1. Acquisition of a DEM model. This paper focuses
on a method of acquiring data through remote sensing;
2. Identification of relevant time-dependent
seismological and geological variables and models from current literature. The purpose is to use such models to modify elevation values in the DEM, where each modified DEM is a snapshot of an ancient landscape;
3. Generation of raster-based DEM models for the
events and/or periods of interest for which archaeological evidence and historical records are available;
4. Plotting of all relevant environmental,
archaeological and other data on the raster-based
DEM. This will lead to well-grounded
interpretation, validated models and methodology.
Some important considerations concerning the above steps are as follows. Firstly, in step 1 DEMs can be pur-chased or downloaded in a variety of formats. In order to be able to apply the dynamic models to elevation data, it is necessary to have access to the actual data (i.e. to the numbers representing the heights of each point). If the acquired DEM is formatted for a particular appli-cation say, MapInfo, it needs to be exported as plain ASCII organized into a matrix of rows and columns.
Secondly, a raster image (e.g. .bmp, .jpeg, .tiff) of an aerial photograph needs to be acquired, for example through Google Earth, corresponding exactly to the area specified by the DEM data matrix. The number of pixels in the raster image is normally much larger than the number of elevation data readings and a correspondence must be established between how many pixels would map to a single elevation point.
or below sea level correspond to blue pixels while all other pixels remain unchanged. This allows us to visual-ize sea advance/retreat in relation to land.
3.
DEM Acquisition
[image:4.595.311.540.82.285.2]Elevation data for the entire world acquired by NASA Shuttle Radar Topographic Mission (SRTM) are acces-sible via the Consultative Group for International Agri-culture Research, Consortium for Spatial Information (CGIAR, 2008) free of charge. SRTM data are available as 3 arc second (approximately 90m horizontal resolu-tion) DEMs split up into tiles of 5x5 degrees. The diffi-culty of such large data files for this project is slow dis-play as most of the data (greater than 99%) are irrele-vant for the selected area in the Helike plain as it covers only approximately 0.050x0.036 degrees. Attempts to crop the selected area from the large tile proved to be cumbersome and prone to errors.
Figure 2:Background (map): a single tile of SRTM elevation data covers most of Greece. Foreground (image): the selected area on Google Earth for elevation readings.
However, Google Earth (GE) 4.1 interface uses the same SRTM 90m data in their elevation models with the added advantage of being sub-tiled into smaller area
grids(GOOGLE EARTH, 2008). Thus, a feasible
solu-tion although very laborious, was to acquire the model by first selecting the region of interest on GE,
approxi-mately 17km2 (Figure 2) and then directly performing
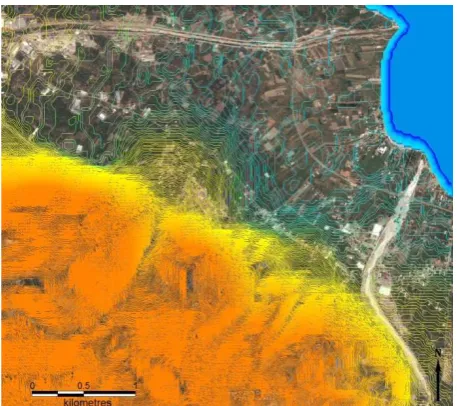
[image:4.595.59.285.315.508.2]elevation readings – a total of 28,341 readings were taken forming a matrix of data with 141 rows and 201 columns. These data were geo-referenced as prescribed by MapInfo and imported as a DEM using Vertical Mapper. A generated model using TIN at 1m contour interval is depicted in Figure 3.
Figure 3:TIN model overlaid on the raster image.
4.
Dynamic Models
(SOTER 1998; 2005) studied a number of time-dependent geological variables and proposed detailed quantification of these for the Gulf of Corinth for the Holocene Era. The quantification considered in this paper focuses, and is only valid for, the period between 4300BP to present day. The quantified variables are:
1. the rate of sea level rise (RS), expressed in metres
per thousand years mky-1
2. the rate of vertical tectonic uplift (RU) relative to
the local sea level, in mky-1
3. the pulse tectonic uplift (U) in m,
4. subsidence (S) at the event or earthquake consid-ered in m, and
5. the rate of sediment deposition (RD) in mky-1
The quantification of each of these variables in rela-tion to the Helike Delta is as follows. Concerning sea level rise, the global eustatic sea level is determined by the amount of glacial ice. As global sea levels change, local isostatic adjustments happen. Soter has adopted the eustatic sea level curves as published by Peltier (SOTER 1998) which show a deceleration of sea level rise in 7000BP and a cessation of global melting at around 5000BP and applied local adjustments for the Gulf of Corinth following the work of Lambeck (SO-TER 1998). The ‘corrected’ local sea level curves show
and average sea level rise RS=0.5mky-1 over the past
5000 years.
it must be noted that the relationship between variable sea level rise and tectonic uplift is very complex as both rise independently at variable speeds. While it is safe to assume a constant rate of sea level rise, the same does not apply for tectonic uplift. In reality, the rate over the baseline reference frame discussed above is not linear in time, but is punctuated with earthquake related disconti-nuities with periods of relatively steady aseismic trajec-tory.
SOTER (1998) has analysed the age of 21 relic shore-lines in an attempt to determine the changes in tectonic uplift in relation to the local corrected sea level. Sam-ples were dated using the uranium-series method and carbon dating corrected for the local ‘reservoir effect’: local surrounding limestone mountains continuously
discharge carbon depleted in C14 into the Gulf which has
limited exchange of water with the Ionian Sea. These are then taken up and metabolized by aquatic organisms
and deposited as C14-depleted organic sediments. An
additional correction of 380 years was found necessary and thus applied to all marine carbon date ages in the Helike Delta.
By plotting the calibrated age of the shoreline against elevation, Soter has shown that about 9000BP the shore-line was 20m lower than it is today. Moreover, two ma-jor discontinuities were observed at 7000BP and 2300BP. The first discontinuity implies a pulse tectonic uplift of about 6-7m while the second, which coincides
with the earthquake of 373BC, is set to U=2.0m. In the
earthquake of 1861AD, a pulse tectonic uplift U=1.0m
is assumed. Moreover, evidence suggests an earthquake
in 2300BC (ALVAREZ-ZARIKIAN et al., 2008)
per-haps of lower magnitude than 373BC and this does not show in the sparse data. Careful analysis of the plotted shoreline data allows us to conjecture a discontinuity in
4300BP with a pulse tectonic uplift U=2.0m. By the
same token, aseismic tectonic uplift should assume two
different rates: RU=0.9mky-1 between 4300-2300BP and
from 2300BP to present a rate of RU=2.0mky-1.
On earthquakes occurring on a normal fault, pulse tec-tonic uplift is normally accompanied by subsidence of the hanging wall block. Usually, subsidence is larger than pulse tectonic uplift and in the case of the Eliki Fault, this causes marine transgression that drowns parts of the delta surface. This clearly happened in the earth-quake of 1861AD as described by Schmidt (KAT-SONOUPOULOU and SOTER 1998); (SOTER and KATSONOPOULOU, 1999) where a subsidence
S=2.0m is reported. Soter’s (1998) analysis of borehole
samples for the event of 373BC yields inconclusive results showing co-seismic subsidence of the order of 9m, 6m and 4m although he points out that it does not take into account other factors such as pulse uplift and subsidence in the intervening earthquakes between 373BC and 1861AD, nor soil compaction or differential deposition. Taking Soter’s analysis into account, it is
assumed here a subsidence of S=4.5m in 373BC and
S=4.0m for the lower magnitude of the earthquake of
2300BC.
Finally the deposition rate is considered with SOTER (1998) suggesting an average of 16.8m in the last 7000
years (2.4mky-1). It is clear that deposition has a strong
localized effect with periods of faster deposition fol-lowed by a steady flow of sediments. Also, until around 50 years ago when riverbank walls were built, the two local rivers were continuously changing course. Ar-chaeological data was used to guide quantification of deposition rates, in particular, at the Early Helladic site (situated right in the middle of the plain between the two rivers) where archaeological data imply a rate of
about 1.0mky-1over the past 4300 years. Thus, it is
as-sumed here a rate of sediment deposition RD=1.0mky-1
from 7000-2300BP and RD=3.0mky-1 from 2300BP to
present. It is also acknowledged that the rate can be much higher on locations nearer the riverbeds but such effects are not to be included in the current model.
Once the rates are quantified, the method to generate a DEM of a past environment proposed here involves updating the height or elevation of every cell in the DEM by simple multiplication and addition over the desired time span. It is important to stress that we are interested in the relationship between sea and land so we need to consider which variables have a plus effect, that is, a raising of land, and which variables have a minus effect, that is, a lowering of land in relation to sea level.
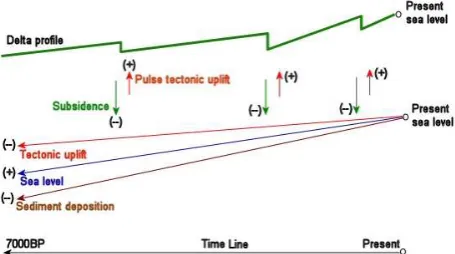
Figure 4: The Helike Delta elevation profile (on top, not to scale) over the past 7000 years with the variables’ effects plus (+) or minus (-) on current DEM heights.
Figure 4 depicts the effects of each variable in the He-like Delta. Starting at “Present sea level” on the right of the picture, back in time is to the left. Tectonic uplift raises the tectonic plate and in the past any point in the
Delta was lower than it is today, so the rate of vertical
tectonic uplift (RU) has a minus effect (i.e. it is
subtract-ed) from all current DEM heights. Since sediment depo-sition is always adding layers of soil over time and any
point was lower in the past than it is today, the rate of
sediment deposition (RD) also has a minus effect and
[image:5.595.314.542.436.563.2]The rise in sea levels deserves careful consideration. Since it is known that in the past sea levels were lower than the present day, it means that any point in today’s
DEM is higher in relation to past sea level, so the rate of
sea level rise (RS) is added to DEM heights to represent
this relative rise. Pulse tectonic uplift and subsidence only happen during the event of major earthquakes and,
as discussed earlier, pulse tectonic uplift (U) raises the
plate and must be added while subsidence (S) lowers the
plate and must be subtracted.
Combining these time-dependent variables into a sin-gle expression where time is given in BP yields:
Ht1 = Ht0 + (St1 – Ut1) – RU*t – RD*t + RS*t + M
Where t0 and t1 are the start and end time of the
simu-lation, t is the time span of the simulation given by t =
(t1 – t0)/1000 as this is expressed in ky-1, and H is the
height in metres of every single point in the DEM at
time t0 (initial) and t1 (final or updated).
The last term of the equation M refers to any other
relevant modelled variable. It is included here as the
proposed method is general; variables are included or excluded depending on the characteristics of the
land-scape under analysis. Examples of M would be soil
ero-sion over time, tilting of tectonic plate, marine landslide causing localized subsidence at the shore, other local-ized subsidence or deposition and indeed, any other local or global effect that can be described over time or
as a pulse event. If M is included, the correct sign (+/-)
needs to be determined following similar reasoning as above. In the simulations described in the next section
M is zero and thus, excluded.
In the equation above, normally (t1 – t0) > 0, that is,
the simulation is run back in time. If a simulation is required to run forward in time say, from 4300—
2373BP, where t0=4300 and t1=2373, then (t1 – t0) is
negative and the inverse is performed: subsidence and sea levels are subtracted while tectonic uplift (seismic and aseismic) and deposition are added.
5.
Simulation Results
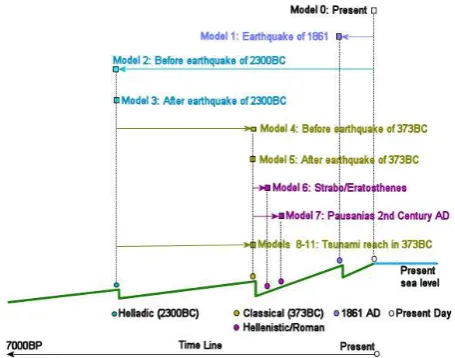
A number of raster based DEM models were generat-ed starting from the present day landscape to AD1861 then to the Early Helladic (2300BC). From there, the models run forward in time to the Classical, Hellenistic and Roman Periods (Figure 5):
• Model 0: the acquired DEM model of the present day landscape,
• Model 1: from present to the earthquake of AD1861, validated against Schmidt's account,
• Model 2: from present to before the earthquake of
c.2300BC,
• Model 3: immediately after the earthquake of c. 2300BC,
• Model 4: from the earthquake of c.2300BC to be-fore the earthquake of 373BC,
• Model 5: immediately after the earthquake of 373BC,
• Model 6: from the earthquake of 373BC to the ac-count by Strabo / Eratosthenes 150 years later,
• Model 7: from the earthquake of 373BC to the ac-count of Pausanias in the 2nd Century AD,
• Models 8-11: tsunami reach in 373BC compared to the accounts of written sources.
[image:6.595.312.540.282.461.2]All models are validated and interpreted using written sources, archaeological and environmental data from boreholes and excavation, and a number of geophysical surveys. Data are available from a total of 99 boreholes plus 77 trenches and trial trenches across the plain.
Figure 5:Twelve landscape models are generated.
5.1 Environmental and Archaeological Validation
Models 0 and 1 are validation models. Since a raster image is overlain on each DEM and all heights with a value of zero or negative should be painted blue in the raster image, then the shoreline of Model 0 should ex-actly correspond to the present day shoreline, this was verified. References are available for the earthquake of AD1861 mainly based on the work of Schmidt pub-lished in 1862, reported here in (KATSONOPOULOU and SOTER, 1998); (SOTER and KATSONOPOULOU 1999)). Schmidt described the event and produced drawings of the aftermath showing a submerged strip of 200m from the seashore probably caused by a marine landslide. He suggested that a similar event but of great-er magnitude destroyed Helike in 373BC. Thgreat-erefore, after calculating the DEM heights for Model 1 in AD1861, all points within 200m of the shore were forced to a negative value in the DEM and the same method was then applied to the seashore after the earth-quakes of 2300BC and 373BC.
The models for c. 2300BC (Figures 6 and 7) are fully
consistent with archaeological and environmental data.
earth-quake: all the evidence found concerning the Early Hel-ladic is in trenches H7, 21, 22, and borehole B75 with archaeological excavations revealing foundation walls of EHII/III “corridor houses” and associated pottery. Furthermore the archaeological evidence indicates that this site was at the sea side which is confirmed by the dynamic model showing exactly that.
In B58 ceramics dating to 2300BC were recovered from sandy clay at a depth of 3.0 - 4.20m and above that is further environmental evidence showing a brackish environment with ostracods together with evidence of a
tsunami (ALVAREZ-ZARIKIAN et al., 2005). The
[image:7.595.310.541.80.545.2]interpretation is that the Early Helladic settlement was placed close to the shore and the earthquake of 2300BC destroyed and subsided the site which then became a marine environment (Figure 7). In H7 where Early Hel-ladic occupation has been found, there is evidence for a marine environment indicating that the area has experi-enced long term submergence. As silting continued over the next centuries, the connection to the sea was cut off and the area became a lagoonal environment which then turned to marsh by the Classical Period.
Figure 6:2300BC before the earthquake.
Furthermore, the long term submergence could ex-plain the hiatus in the archaeological record in the mid-plain of almost 1000 years from the Early Helladic Pe-riod. Occupation is evidenced again towards the end of the Mycenaean and Proto-geometric Periods in the southeast of the Delta, away from the mid-plain.
The generated models for the Classical Period (Fig-ures 8 and 9), where all evidence of Archaic/Classical occupation is overlaid on the raster-based DEM, show that before the earthquake of 373BC the shoreline was close to the current railway line (Figure 8). Near trench H8 it indicates a possible lagoon in the same place as in
the model of c. 2300BC near B58. The interpretation is
that this is more likely to have been a swampy area in 373BC, in fact the whole area is known as “the swamps” even today.
[image:7.595.46.288.199.561.2]Figure 7:2300BC after the earthquake.
Figure 8:373BC before the earthquake.
[image:7.595.310.539.355.740.2]The model after the earthquake of 373BC is depicted in Figure 9 and shows large areas being submerged near to the shore when compared to the model before the earthquake. The area in the centre of the picture (where the sea advances most inland) indicates submergence and the formation of a lagoon. Trenches H10, H18 and H19 revealed Classical pottery and remains of walls at 3.0-3.3m depth with one in H19 destroyed and fallen towards the sea, suggesting the backlash of a tsunami according to Soter (KATSONOPOULOU, 2005). Also, H10, H18 and H19 showed a brackish environment with ostracods below the walls reinforcing the earlier inter-pretation of marine, lagoonal and marshy environments at that location.
A DEM model was generated and compared with the
accounts of Eratosthenes (in Strabo, App., le), 3rd
Centu-ry BC, approximately 150 years after the events of 373BC (Figure 10). Eratosthenes reports that the bronze
statue of Poseidon was in the poros (normally a narrow
[image:8.595.57.284.380.587.2]passage of water in ancient Greek). KATSONOPOU-LOU (2005) has reinterpreted this as an inland marine lagoon which is consistent with the environmental data and the possible location can be inferred from the DEM model – in the middle of the bay as annotated in Figure 11.
Figure 10:Eratosthenes account 150 years after 373BC. Figure 11 depicts a DEM model showing a possible
scenario in the 2nd Century AD, which was compared
with the accounts of Pausanias. By this time the area in the centre of the bay was silted over and a Roman road ran through it. Pausanias may have travelled along this road and he reported that the ruins of Helike were still visible under water. The model suggests that such ruins may have been under a marine lagoon, formed in the
same location as the ancient lagoon of c. 2300BC and
this view is further reinforced by extensive gravity measurements in the area by DIMITROPOULOUS and NOUTSIS (2005) whose results closely match both the
location and orientation of the lagoon as indicated on Figure 11.
Figure 11:Pausanias’ account in the 2nd Century AD.
5.2 Models of Tsunami Reach
The earthquake and tsunami of 373BC were reported by a large number of ancient writers and this rich histor-ical record allows us to test models of tsunami reach and whether it is likely or not that the entire city of Helike was destroyed. A tsunami following the earthquake is reported by Herakleides, Theophrastos, Eratosthenes, Poseidippos of Pella, Aelian, Diodoros, Strabo, Ovid, and Pausanias among others (KATSONOPOULOU 2005). The records do not conflict too much but they do differ in the magnitude and destructive consequences of the tsunami. The contemporaries to the event, Hera-kleides and Theophrastos, provide a description of the topography by stating that the city was located around 2km from the shore. This information seems to have been lost in later accounts although they also described the city as being located on higher ground and that the entire area was covered by seawater.
Strabo, Diodoros, Pausanias, and Poiseidippos all re-ported that the magnitude of the earthquake was of the most destructive kind and as a result the sea was raised to a great height and the people disappeared together with their land. Pausanias reported also that the sea sur-rounded the city.
Two writers had actually visited Helike: Eratosthenes who reported that ferrymen told him that the bronze statue of Poseidon holding a hippocampus stood under water and was dangerous to those fishing with nets; and Pausanias who reported that when he visited the site the ruins of Helike were still visible under water although heavily deteriorated.
minimum scenario is that it reached the surface heights of those horizons showing Classical occupation and with evidence of the tsunami itself, this was calculated to be a wave of 10m and is shown in Figure 12. Many more models were generated at increasing wave height intervals, for example a tsunami height of 40m (Figure 13) was necessary to flood the remaining Classical hori-zon in borehole B52.
Figure 12:Tsunami reach of 10m.
It is interesting that Pausanias states that the tsunami “encircled the city” and if one assumes that a good pro-portion of the people lived on higher ground as suggest-ed by some ancient writers, and as is the case today, then this description makes sense as shown by the 40m model even though this seems very unlikely.
Figure 13:Tsunami reach of 40m.
The models suggest that the tsunami reached a maxi-mum of 10m and thus did not destroy all of Classical Helike and that the evidence for total destruction is not conclusive. The models show that such claims may have been exaggerated as has been previously pointed out by
SOTER (2001) and others concerning subsidence of the shore.
For most of its inhabitants to have perished, ancient Helike must have been more densely populated at lower elevations compared to today's pattern. A note of cau-tion is that the elevacau-tion model may differ substantially to the reality of 373BC and many factors have not been considered such as the magnitude of the marine land-slide that contributed to the wave generation, the actual size of the wave, the forces involved, or wave attenua-tion as it hit obstacles limiting actual reach on land.
6.
Discussion and Conclusion
This paper has demonstrated a method of landscape analysis using GIS with particular focus on temporal dynamics. A case study of the Helike Delta illustrates the method: 1) acquisition of a DEM model; 2) identifi-cation of relevant geological variables and their quanti-fication; 3) building the dynamic model and applying to DEM heights to simulate past landscapes; and 4) valida-tion through a variety of data sources including envi-ronmental, archaeological from borehole and excava-tion, geophysics, and historical records.
The dynamic models are identified and quantified using five major variables namely sea level rise, seismic and aseismic tectonic uplift, subsidence, and sediment deposition, all integrated into a single equation allowing the evaluation of new DEM heights over time. Twelve landscape models were generated from the present day to AD1861 to the Early Helladic, then to the Classical, Hellenistic and Roman Periods. The models shed light on archaeological interpretation concerning the continu-ity and discontinucontinu-ity of human occupation in the Helike Delta.
A number of models of tsunami reach caused by the earthquake of 373BC were generated and compared to literary accounts reporting the total destruction of He-like. Plausible models suggest that the tsunami reached the 10m elevation contour but did not destroy all of Classical Helike as described in the ancient sources.
The dynamic modelling method described in this pa-per allows a way into the story of the Helike Delta at different temporal levels and at scales ranging from microfaunal identification and absolute dating to large scale spatial considerations allowing archaeological interpretation of long term trends, sequences and chang-es. Moreover, the model is generic and other variables can be added as required and the methodology can be applied to any dynamic landscape modelling and analy-sis.
Acknowledgements
[image:9.595.56.284.472.693.2]References
ALVAREZ-ZARIKIAN C. A., SOTER S., KATSO-NOPOULOU D., 2008. Recurrent Submergence and Uplift in the Area of Ancient Helike, Gulf of Corinth, Greece: Microfaunal and Archaeological Evidence.
Journal of Coastal Research 24 (1A), pp. 110-125.
CLELAND J. H., YORK A., JOHNSON A., 2008. The Tides of History: Modelling Native American Use of
Recessional Shorelines. KEA Environmental, Inc., San
Diego, California. http://proceedings.esri.com/ li-brary/userconf/proc00/professional/papers/pap377/ p377.htm (last accessed 19/02/10).
CUNDY A. B., STEWART I. S., 2004. Dating recent
colluvial sequences with 210Pb and 137Cs along an active
fault scarp, the Elike Fault, Gulf of Corinth, Greece.
Tectonophysics 386 (2004), pp. 147-156.
CGIAR-CSI (2008). Consultative Group for Inter-national Agriculture Research, http://srtm.csi.cgiar.org and http://www.ambiotek.com/ topoview (last accessed 28.08.08).
DIMITROPOULOS K. C., NOUTSIS V. C., 2005. Gravity Evidence on the Location of the Lost Ancient City of Helike. In Katsonopoulou D., Soter S.,
Kou-kouvelas I. (eds.), Helike III - Ancient Helike and
Aigi-aleia, Archaeological Sites in Geologically Active Re-gions. Proc. 3rd International Conference Nikolaika,
Greece, 2005, pp. 197—200.
GILLINGS M., 1995. Flood dynamics and settlement in the Tisza valley of north-east Hungary: GIS and the
Upper Tisza project. In Lock G., and Stančič Z., (eds.)
Archaeology and Geographical Information System,
pp. 68—84. Taylor and Francis, London.
GOOGLE EARTH (2008). Google Earth Community.
http://bbs.keyhole.com/ubb/showflat.php/Cat/0/Number /397432/an/0/ page/0/vc/1. (last accessed 28.08.08).
KATSONOPOULOU D., SOTER S., 1998. The Search for Ancient Helike, 1988-1995: Geological, Sonar and Borehole Studies. In Katsonopoulou D., Soter S.,
Schilardi D., (eds.) Helike II -Ancient Helike and
Aigi-aleia. Proc. 2nd International Conference Aigion,
Greece 1995, pp. 69—116.
KATSONOPOULOU D., 2005. The earthquake of 373BC. Literary and Archaeological Evidence. In
Kat-sonopoulou D., Soter S., Koukouvelas I., (eds) Helike
III - Ancient Helike and Aigialeia,Archaeological Sites in Geologically Active Regions. Proc. 3rd International
Conference Nikolaika, Greece, 2005, pp. 15—32.
KOUKOUVELAS I. K., PAVLIDES S., AGRAFIOTIS D., ALEXANDRIS G., STAMATOPOULOS L., ZI-GOURI V., VERROIOS S., SBORAS S., KOKKALAS S., 2005b. Coseismic and Aseismic Adjustment of a River Course: The Case History of the Kerynites River, Gulf of Corinth, Greece. In Katsonopoulou D., Soter
S., Koukouvelas I. (eds.), Helike III - Ancient Helike
and Aigialeia, Archaeological Sites in Geologically Active Regions. Proc. 3rd International Conference
Ni-kolaika, Greece, 2005, pp. 223—241.
KOUKOUVELAS I. K, KATSONOPOULOU D., SO-TER S., XYPOLIAS P., 2005a. Slip rates on the Helike Fault, Gulf of Corinth, Greece: new evidence from
geo-archaeology. Terra Nova17 (2), pp. 158—164.
KOUKOUVELAS I., K., STAMATOPOULOS L., KATSONOPOULOU D., PAVLIDES S., 2001. A Pal-aeoseismological and Geoarchaeological Investigation
of the Eliki Fault, Gulf of Corinth, Greece. Journal of
Structural Geology23 (2001), pp. 531—543.
NUNEZ M., VIKKULA A., KIRKINEN T., 1995. Per-ceiving time and space in an isostatically rising region.
In Lock G., and Stančič Z., (eds.) Archaeology and
Ge-ographical Information System, pp. 141—151. Taylor
and Francis, London.
PAUSANIAS. The Description of Greece Vol IV,
translated by J.G. Frazer, 1913, MacMillan and Co Ltd, London.
POULIMENOS G., DOUTSOS T., 1996. Barriers on
Seismogenic Faults in Central Greece. Journal of
Geo-dynamics, 22 (1/2), pp.119—135.
SMITH N., 1995. Towards a study of ancient Greek
landscapes: the Perseus GIS. In Lock G., and Stančič
Z., (eds.) Archaeology and Geographical Information
System, pp. 239—248. Taylor and Francis, London.
SOTER S., 1998. Holocene uplift and subsidence of the Helike Delta, Gulf of Corinth, Greece. In Stewart I. S.
and Vita-Finzi C., (eds.) Coastal Tectonics, (146), pp.
41—56. Geological Society Special Publication, Lon-don.
SOTER S., BLACKWELDER P., TZIAVOS C.,
ALVAREZ-ZARIKIAN C., 2001. Environmental Analysis of Cores
from the Helike Delta, Gulf of Corinth, Greece. Journal
of Coastal Research 17 (1), pp. 95—106.
SOTER S., KATSONOPOULOU D., 1999. Occupation Horizons Found in the Search for the Ancient Greek
City of Helike. Geoarchaeology: An International
Journal 14 (6), pp. 531—563.
SOTER S., KATSONOPOULOU D., 2005. Studies on the Geoarchaeology of the Helike Delta: 1991—2000.
In Katsonopoulou D., Soter S., and Koukouvelas I.,
(eds.) Helike III - Ancient Helike and Aigialeia,
Ar-chaeological Sites in Geologically Active Regions.
Proc. 3rd International Conference Nikolaika, Greece,