The preliminary
R&D satellite
account for the
UK: a sensitivity
analysis
This article builds on previous work in Economic & Labour Market Review which treated expenditure on research and development as investment in an intangible scientifi c asset, in line with proposed revisions to the System of National Accounts (SNA). The purpose of the analysis is to communicate to users the degree of sensitivity of the results previously presented to changes in the key assumptions. The analysis is part of a wider Offi ce for National Statistics contribution to Organisation for Economic Co-operation and Development work updating the 1993 SNA, and was presented at the International Association for Research on Income and Wealth conference in Slovenia in August 2008. SUMMARY
FEATURE
Peter Evans, Michael Hatcher and Damian Whittard
Offi ce for National Statistics
O
ne of the major recommended changes to the 1993 System of National Accounts (1993 SNA) is that research and development (R&D) expenditure should be treated as investment in an intangible scientifi c asset, with its defi nition following the Organisation for Economic Co-operation and Development’s Frascati Manual (OECD 2002). As a precursor to incorporation into countries’ national accounts, the recommended changes are to be documented inexperimental R&D satellite accounts. While the revision timetable spans a number of years, many statistical agencies, including the Offi ce for National Statistics, have already conducted preliminary assessments to communicate the potential impacts to users.
Ina previous issue of Economic & Labour MarketReview, Galindo-Rueda (2007) presented preliminary analysis for the UK treating R&D as a capital asset. Capitalising R&D would raise UK gross domestic product (GDP) by approximately 1.5 per cent, have non-trivial impacts on R&D intensity indicators and key economic ratios, but limited eff ect on estimates of recent GDP growth. Th e treatment of R&D as a capital asset also has impacts on the goods and services account (GSA).
In this article, a sensitivity analysis on Galindo-Rueda’s preliminary results is carried out. Th e areas investigated are: the GSA impacts, GDP and net domestic product (NDP) estimates, R&D intensity indicators, key economic ratios and growth- accounting results. Th e focus of the analysis is the assumptions made with respect to depreciation rates for R&D and fi xed assets,
the inclusion of soft ware, and the funding and ownership assumptions regarding R&D across various sectors.1 Th e aim of the article
is to communicate to users the degree of sensitivity of the results previously presented to changes in the key assumptions.
The key assumptions
Depreciation rates R&D stocksTreating R&D as an asset requires a number of assumptions, one of the most important of which is the rate of depreciation. Using a constant price series for R&D gross fi xed capital formation (GFCF), end-of-period R&D stocks were calculated using a perpetual inventory model (PIM), which adds new investment to capital stock, and subtracts depreciation. In the original benchmark analysis by Galindo-Rueda (2007), a depreciation rate of 20 per cent was applied to the business sector’s R&D stock, while a 5 per cent rate was applied to the government and non-profi t institutions serving households (NPISH) sectors.
refl ecting the likelihood of slower depreciation of knowledge produced for more general applications.
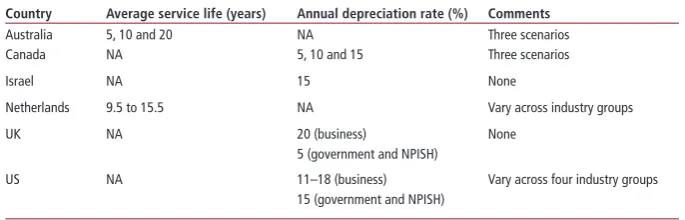
A comparison of depreciation rates used in international R&D satellite accounts is given in Table 1.2 On the basis of these
rates and estimates in the literature, three scenarios for the business sector are considered: 15 per cent, 20 per cent (original) and 25 per cent,3 and three
scenarios for the government and NPISH sectors: 2.5 per cent per cent, 5 per cent (original) and 7.5 per cent.It is assumed that the same depreciation rate always applies in the government and NPISH sectors.
Fixed assets stocks
In the benchmark analysis, stocks of fixed assets used for R&D for the two separate categories in the Business Enterprise Research and Development survey (land and buildings and plant, machinery and equipment) depreciate geometrically according to the PIM, with capital services for the use of both stocks calculated assuming a net rate of return (ROR) of 7 per cent. A 1.5 per cent depreciation rate was applied to land and buildings, and 15 per cent for machinery and equipment.
Th ese rates are consistent with the fi nding that physical capital depreciates more slowly than business sector R&D capital,
though the latter is only slightly below the business sector’s R&D capital depreciation rate of 20 per cent. In this analysis, three scenarios are considered: 0.5 per cent, 1.5 per cent (original) and 2.5 per cent for land and buildings, and 10 per cent, 15 per cent (original) and 20 per cent for plant, machinery and equipment. Th e net ROR of 7 per cent is applied in each case.
Software estimates
To avoid double counting of soft ware, which is currently recognised as a produced asset in the National Accounts (NA), and scientifi c originals (R&D) which are not, 50 per cent of total R&D in the computer services industry was deducted in the benchmark analysis (it is assumed this proportion is already correctly accounted for in soft ware estimates). In addition, 60 and 40 per cent deductions are considered.
Performance, funding and ownership of R&D
In the benchmark analysis, a number of assumptions are made about the share of each sector’s R&D that is funded and owned by another sector. Th e sensitivity to changes in some of these assumed shares is also investigated, again using three scenarios. Th e assumptions used in the sensitivity analysis are presented in Table 2, with the original assumptions labelled.
Results
Impacts on the goods and
services account
Th e goods and services account (GSA) balances total resources (supply), from output and imports, against possible uses (demand). Like Galindo-Rueda, concentration is on the impacts of R&D capitalisation. Th e fi gures presented therefore refl ect the changes relative to NA values for the 2004 reference year. Th e sensitivity with respect to depreciation rates is considered fi rst.
Depreciation rates
NPISH and government R&D capital Th e changes, which are documented in Table 3, are non-trivial. Th e impact on total demand rises by approximately 19 per cent if the depreciation rate is increased from the original 5 per cent value to 7.5 per cent. However, this does result only from increases in fi nal consumption of services from R&D capital by the NPISH and government sectors, which increase by 65 and 12 per cent, respectively. Reducing the depreciation rate from 5 to 2.5 per cent reduces total demand through the same channels but, interestingly, the eff ect is less marked. Th us, while the total demand impact shows signifi cant sensitivity to even small changes in these depreciation rates, it is more sensitive to an increase from the benchmark value.
Business R&D capital
Changing the business R&D capital depreciation rate has no eff ect on the GSA. Th is result follows from the elimination of the channels discussed above via the imposed constraint, used to estimate adjustments to other goods and services on the supply and use sides, that non-market gross value added (GVA) increases only by the value of R&D capital consumption in the government and NPISH sectors.
Land and buildings
[image:2.595.37.380.523.633.2]Changing the depreciation rate leads to changes in almost all the components of total demand, but the overall impact is small. Increasing the rate from the original value of 1.5 per cent to 2.5 per cent reduces total demand impact by 1.3 per cent, resulting mainly from a reduction in the capitalisation of R&D investment (that is, R&D GFCF) from £19.407 billion to £19.213 billion. For such a small change in the depreciation rate, this is certainly non-trivial, but reducing the depreciation rate by 1 percentage point to 0.5 per cent produces an even greater effect. The total demand
Table 1
Comparison of service lives and depreciation rates in international R&D
satellite accounts
Source: OECD (2008)
Country Average service life (years) Annual depreciation rate (%) Comments
Australia 5, 10 and 20 NA Three scenarios Canada NA 5, 10 and 15 Three scenarios
Israel NA 15 None
Netherlands 9.5 to 15.5 NA Vary across industry groups
UK NA 20 (business)
5 (government and NPISH)
None
US NA 11–18 (business)
15 (government and NPISH)
Vary across four industry groups
Share of sector i’s R&D funded by sector j that is owned by sector j
Funder (i) Business enterprise
General government NPISH Rest of World
Performer (j) Original Original Original Original
Business enterprise
1.00 0.40 0.50 0.60 1.00 0.85 0.90 0.95
General government
1.00 1.00 1.00 1.00 1.00 0.85 0.90 0.95
[image:2.595.38.378.692.801.2]NPISH 1.00 0.05 0.10 0.15 1.00 0.85 0.90 0.95 Rest of World 0.90 1.00 1.00 1.00 0.76 0.22 0.22 0.22
Table 2
Table 3
Sensitivity of GSA impacts to NPISH and government R&D capital
depreciation rates, 2004
£ million, current prices
Source: Offi ce for National Statistics
Resources
Depreciation rate 2.5% 5% (original) 7.5%
R&D output Unchanged 12,403 Unchanged
Output of other goods and services (OGS) Unchanged –9,089 Unchanged Output of OGS from other non–market consumption
of R&D capital services
3,219 4,216 5,671
R&D imports Unchanged 197 Unchanged
Total supply of R&D Unchanged 12,600 Unchanged
Total supply of OGS –5,870 –4,873 –3,418
Total supply 6,730 7,727 9,182
Uses
R&D intermediate consumption Unchanged –5,274 Unchanged Intermediate consumption OGS Unchanged –1,363 Unchanged R&D gross fi xed capital formation Unchanged 19,407 Unchanged Gross fi xed capital formation other assets Unchanged 0 Unchanged Changes in inventories Unchanged 12 Unchanged Final consumption of R&D by NPISH Unchanged –325 Unchanged Final consumption of OGS by NPISH Unchanged –5,084 Unchanged Final consumption of services from R&D capital by
NPISH
1,124 1,776 2,939
Final consumption of OGS by government Unchanged –2,641 Unchanged Final consumption of services from R&D capital by
government
2,095 2,440 2,732
R&D exports Unchanged –1,219 Unchanged
Total demand of R&D Unchanged 12,600 Unchanged
Total demand of OGS –5,870 –4,873 –3,418
Total demand 6,730 7,727 9,182
[image:3.595.46.381.110.412.2]Source: Offi ce for National Statistics
Table 4
Sensitivity of GSA impacts to the land and buildings depreciation rate,
2004
£ million, current prices
Resources
Depreciation rate 0.5% 1.5% (original) 2.5%
R&D output 12,988 12,403 12,151
Output of other goods and services (OGS) –9,006 –9,089 –9,124 Output of OGS from other non–market consumption
of R&D capital services
3,828 4,216 4,402
R&D imports Unchanged 197 Unchanged
Total supply of R&D 13,185 12,600 12,348
Total supply of OGS –5,178 –4,873 –4,722
Total supply 8,007 7,727 7,627
Uses
R&D intermediate consumption –5,272 –5,274 –5,275 Intermediate consumption OGS –1,351 –1,363 –1,369 R&D gross fi xed capital formation 19,856 19,407 19,213 Gross fi xed capital formation other assets 0 0 0 Changes in inventories Unchanged 12 Unchanged Final consumption of R&D by NPISH Unchanged –325 Unchanged Final consumption of OGS by NPISH –5,034 –5,084 –5,105 Final consumption of services from R&D capital by
NPISH
1,612 1,776 1,854
Final consumption of OGS by government –2,621 –2,641 –2,650 Final consumption of services from R&D capital by
government
2,216 2,440 2,548
R&D exports –1,086 –1,219 –1,277
Total demand of R&D 13,185 12,600 12,348
Total demand of OGS –5,178 –4,873 –4,722
Total demand 8,007 7,727 7,627
impact increases by almost 4 per cent, again resulting mainly from the effect on R&D investment (see Table 4).
Plant, machinery and equipment Th e total demand impacts of increasing or reducing the depreciation rate are insignifi cant at less than 1 per cent. Inspection of Table 5 shows that this does not result from off setting elements within demand, but rather because the eff ects on all elements are quite small. Th ese results stand in contrast to the changes produced by altering the land and buildings depreciation rate.
Software estimates
Table 6 shows that the total demand impacts of the soft ware deduction assumption are not particularly large. As expected, increasing (decreasing) the percentage deduction of R&D in the computer services industry decreases (increases) the impact of R&D capitalisation on total demand, primarily through its eff ect on R&D investment. Changing the soft ware deduction by 10 percentage points leads to approximately a 1.6 per cent change in the total demand impact and around a 0.5 per cent change in R&D investment.4
Performance, funding and ownership of R&D
Th e changes in the GSA impacts diff er depending on the funding share considered, but the general result is that there are only small changes in total demand and its individual components. Th e greatest sensitivity is with respect to the share of government-funded and -owned R&D performed by business enterprise, with changes in the GSA shown in Table 7. Th e total demand impact changes by 1.25 per cent.
GDP and NDP estimates
Th e capitalised estimates as well as their percentage changes relative to the benchmark estimates of Galindo-Rueda (2007) are given in next three tables. Th e satellite account GDP and NDP estimates refer to all sectors. Table 8 refers to depreciation rates, Table 9 to the soft ware deduction and Table 10 to the assumed funding-ownership shares.Depreciation rates
[image:3.595.45.381.489.791.2]Table 5
Sensitivity of GSA impacts to the plant, machinery and equipment
depreciation rate, 2004
£ million, current prices
Source: Offi ce for National Statistics
Resources
Depreciation rate 10% 15% (original) 20%
R&D output Unchanged 12,403 Unchanged
Output of other goods and services (OGS) –9,034 –9,089 –9,122 Output of OGS from other non–market consumption
of R&D capital services
4,204 4,216 4,225
R&D imports Unchanged 197 Unchanged
Total supply of R&D Unchanged 12,600 Unchanged
Total supply of OGS –4,830 –4,873 –4,897
Total supply 7,770 7,727 7,703
Uses
R&D intermediate consumption Unchanged –5,274 Unchanged Intermediate consumption OGS –1,355 –1,363 –1,368 R&D gross fi xed capital formation 19, 400 19, 407 19411 Gross fi xed capital formation other assets Unchanged 0 Unchanged Changes in inventories Unchanged 12 Unchanged Final consumption of R&D by NPISH Unchanged –325 Unchanged Final consumption of OGS by NPISH –5,051 –5,084 –5,104 Final consumption of services from R&D capital by
NPISH
1,768 1,776 1,781
Final consumption of OGS by government –2,628 –2,641 –2,650 Final consumption of services from R&D capital by
government
2,435 2,440 2,444
R&D exports –1,212 –1,219 –1,224
Total demand of R&D Unchanged 12,600 Unchanged
Total demand of OGS –4,830 –4,873 –4,897
Total demand 7,770 7,727 7,703
Table 6
Sensitivity of GSA impacts to the software estimates deduction, 2004
£ million, current prices
Source: Offi ce for National Statistics
Resources
Software deduction 40% 50% (original) 60%
R&D output 12,525 12,403 12,281
Output of other goods and services (OGS) Unchanged –9,089 Unchanged Output of OGS from other non–market consumption
of R&D capital services
4,220 4,216 4,213
R&D imports Unchanged 197 Unchanged
Total supply of R&D 12,722 12,600 12,478
Total supply of OGS –4,869 –4,873 –4,881
Total supply 7,852 7,727 7,602
Uses
R&D intermediate consumption Unchanged –5,274 Unchanged Intermediate consumption OGS Unchanged –1,363 Unchanged R&D gross fi xed capital formation 19, 503 19, 407 19, 311 Gross fi xed capital formation other assets Unchanged 0 Unchanged Changes in inventories Unchanged 12 Unchanged Final consumption of R&D by NPISH Unchanged –325 Unchanged Final consumption of OGS by NPISH Unchanged –5,084 Unchanged Final consumption of services from R&D capital by
NPISH
Unchanged 1,776 Unchanged
Final consumption of OGS by government Unchanged –2,641 Unchanged Final consumption of services from R&D capital by
government
2,444 2,440 2,437
R&D exports –1,194 –1,219 –1,245
Total demand of R&D 12,722 12,600 12,478
Total demand of OGS –4,869 –4,873 –4,876
Total demand 7,852 7,727 7,602
the amount of consumption of fi xed capital attributable to R&D is added to both income and expenditure, thereby increasing factor incomes, fi nal expenditure and value added in these sectors. With a 7.5 per cent depreciation rate, GDP increases by 0.05 per cent relative to the preliminary case. If the depreciation rate is reduced to 2.5 per cent instead, the GDP estimate falls by almost one-tenth of a percentage point. GDP estimates are therefore also rather insensitive to the NPISH and government R&D capital depreciation rates.
Business sector R&D capital
In this case, it is the NDP estimates that change while the GDP estimates stay constant. Th e reason for this result is that the consumption of fi xed capital that occurs with the depreciation of R&D assets used in a production process is a portion of total operating surplus. Th us, when business capital is depreciated, the depreciation rate used aff ects the composition between capital consumption and net operating surplus (and thus NDP), but does not aff ect GDP. Th e changes in NDP are rather insignifi cant: if the depreciation rate is reduced by 5 percentage points to 15 per cent, then there is 0.01 per cent increase in NDP, while an increase up to 25 per cent reduces NDP by 0.02 per cent.
Land and buildings
Both NDP and GDP estimates change relative to the benchmark analysis. Increasing the depreciation rate from 1.5 per cent to 2.5 per cent reduces NDP by 0.1 per cent compared with only a 0.01 per cent reduction in GDP. Th e corresponding changes for a 1 percentage point reduction in the depreciation rate to 0.5 per cent are similar quantitatively, with the proviso that the directions of change are reversed. Th us, while NDP estimates are more variable than GDP estimates, both sets are rather robust.
Plant, machinery and equipment Both GDP and NDP estimates show little variability to the assumed depreciation rate for plant, machinery and equipment. Th e changes for GDP and NDP are the same in percentage terms, but an increase in the depreciation rate reduces GDP and increases NDP (and vice versa for a decrease in the depreciation rate). Changes in the plant, machinery and equipment depreciation rate also had only minor impacts on the goods and services account, despite the relatively wide range of values considered.
Software estimates
[image:4.595.42.381.486.788.2]Table 7
Sensitivity of GSA impacts to the share of government-funded R&D
performed by business enterprise and owned by government, 2004
£ million, current prices
Source: Offi ce for National Statistics
Resources
Funding share 40% 50% (original) 60%
R&D output 12,399 12,403 12,406
Output of other goods and services (OGS) Unchanged –9,089 Unchanged Output of OGS from other non–market consumption
of R&D capital services
4,123 4,216 4,309
R&D imports Unchanged 197 Unchanged
Total supply of R&D 12,597 12,600 12,603
Total supply of OGS –4,966 –4,873 –4,966
Total supply 7,631 7,727 7,824
Uses
R&D intermediate consumption –5,278 –5,274 –5,271 Intermediate consumption OGS Unchanged –1,363 Unchanged R&D gross fi xed capital formation Unchanged 19, 407 Unchanged Gross fi xed capital formation other assets Unchanged 0 Unchanged Changes in inventories Unchanged 12 Unchanged Final consumption of R&D by NPISH Unchanged –325 Unchanged Final consumption of OGS by NPISH Unchanged –5,084 Unchanged Final consumption of services from R&D capital by
NPISH
Unchanged 1,776 Unchanged
Final consumption of OGS by government Unchanged –2,641 Unchanged Final consumption of services from R&D capital by
government
2,347 2,440 2,533
R&D exports Unchanged –1,219 Unchanged
Total demand of R&D 12,597 12,600 12,603
Total demand of OGS –4,966 –4,873 –4,780
[image:5.595.36.384.113.414.2] [image:5.595.39.382.475.667.2]Total demand 7,631 7,727 7,824
Table 8
Sensitivity of GDP and NDP estimates to depreciation rates, 2004
£ million, current prices
Source: Offi ce for National Statistics
Depreciation rate (%)
Gross domestic product (GDP)
% change from the benchmark analysis
Net domestic product (NDP)
% change from the benchmark analysis
Land and buildings
0.5 1,190,960 0.02 1,049,071 0.1
Original 1.5 1,190,695 1,047,990
2.5 1,190,600 –0.01 1,047,507 –0.1
Plant, machinery and equipment
10 1,190,729 0.003 1,047,954 –0.003
Original 15 1,190,695 1,047,990
20 1,190,675 –0.002 1,048,009 0.002
Business sector R&D stocks
15 1,190,695 Unchanged 1,048,361 0.01
Original 20 1,190,695 1,047,990
25 1,190,695 Unchanged 1,047,748 –0.02
Government and NPISH R&D stocks
2.5 1,189,698 –0.08 1,047,990 Unchanged
Original 5.0 1,190,695 1,047,990
7.5 1,191,266 0.05 1,047,990 Unchanged
40 per cent and fall by 0.01 per cent if the share is increased to 60 per cent. Th e results for each share are presented in Table 10.
Sensitivity of R&D intensity
indicators and key economic
ratios
Sensitivity with respect to two indicators of R&D intensity is considered – the GERD/ GDP ratio and R&D GFCF/GDP – and two key economic ratios – the gross operating surplus (GOS) to GDP ratio and the gross saving to gross national disposable income ratio.
Depreciation rates
Th e GERD/GDP ratio, the headline R&D intensity indicator, does not change at all to three decimal places for the depreciation rate scenarios considered. Th e R&D GFCF/ GDP ratio is similarly insensitive, but does increase by 0.001 (one-tenth of a percentage point) when the land and buildings depreciation rate is reduced to 0.5 per cent. Key economic ratios (the last two columns of Table 11) are also insensitive. Th ere is only a change to the third decimal place in the ratio of gross saving to gross national domestic income ratio, which rises by one-tenth of a percentage point, again for a 1 percentage point reduction in the land and buildings depreciation rate to 0.5 per cent.
Software estimates
Th ere are no changes in the key economic ratios or R&D intensity indicators to three decimal places. Th e eff ects of changing the soft ware deduction assumption are therefore minimal across the three key areas of the satellite account on which the sensitivity analysis focuses.
Performance, funding and ownership of R&D
Th e R&D intensity indicators and key economic ratios are also unchanged to three decimal places with respect to the assumed funding-ownership shares. Th is gives some justifi cation to the original assumptions used in preliminary analysis since both the GDP and NDP estimates are robust, while the eff ects on the GSA were also small.
Growth accounting
Growth accounting is a technique used to attribute changes in the volume of output to changes in the volume of inputs – labour (quality-adjusted), non-R&D capital and R&D capital – based on the assumption that contributions of each input are proportional to their share in national income.
Th e benchmark results of Galindo-per cent causes a change in GDP of only
0.01 per cent. As expected, increasing the soft ware deduction reduces GDP (as it reduces the potential for double-counting), while a reduction in the soft ware deduction increases GDP. NDP changes in the same direction and by equal magnitude in percentage terms (see Table 9).
Performance, funding and ownership of R&D
Table 9
Sensitivity of GDP and NDP to the software deduction assumption,
2004
£ million, current prices
Source: Offi ce for National Statistics
Software deduction (%)
Gross domestic product (GDP)
% change from the benchmark analysis
Net domestic product (NDP)
% change from the benchmark analysis
Software deduction (removing double counting)
40 1,190,820 0.01 1,048,047 0.01
Original 50 1,190,695 1,047,990
60 1,190,382 –0.01 1,047,933 –0.01
Table 10
Sensitivity of GDP and NDP to funding share assumptions, 2004
£ million, current prices
Source: Offi ce for National Statistics
Funding share (%) Gross domestic product (GDP)
% change from the benchmark analysis
Net domestic product (NDP)
% change from the benchmark analysis
R&D funded and owned by general government, performed by business enterprise
40 1,190,462 –0.01 1,047,720 –0.01
Original 50 1,190,695 1,047,990
60 1,190,788 0.01 1,048,098 0.01
R&D owned and funded by general government, performed by NPISH
5 1,190,668 –0.002 1,047,990 Unchanged
Original 10 1,190,695 1,047,990
15 1,190,722 0.002 1,047,990 Unchanged
R&D owned and funded by the Rest of the World, performed by business enterprise
85 1,190,695 Unchanged 1,047,841 –0.01
Original 90 1,190,695 1,047,990
95 1,190,695 Unchanged 1,048,139 0.01
R&D owned and funded by the Rest of the World, performed by general government
85 1,190,697 0.0002 1,047,990 Unchanged
Original 90 1,190,695 1,047,990
95 1,190,692 –0.0003 1,047,990 Unchanged
R&D owned and funded by the Rest of the World, performed by NPISH
85 1,190,704 0.0008 1,047,990 Unchanged
Original 90 1,190,695 1,047,990
95 1,190,686 –0.0008 1,047,990 Unchanged
Rueda (2007) suggest that, over the 1997 to 2004 period, R&D made only a small contribution of 0.05 per cent to observed GVA growth of 2.8 per cent. By comparison, the contributions of non-R&D capital and quality-adjusted labour were 1.45 and 0.8 per cent, respectively. Th e inclusion of R&D therefore had little impact on the unexplained Solow residual, reducing its value from 0.55 (2.8 – 1.45 – 0.8) per cent to 0.50 per cent via its 0.05 per cent contribution. An interesting question is whether this conclusion is sensitive to changes in key assumptions. Th is question is addressed in this section using the same scenarios, and the same 1997 to 2004 period used by Galindo-Rueda (2007).
Depreciation rates
The results for the four depreciation rates are given in Table 12. GVA growth sometimes changes slightly, but the contribution of R&D capital to growth (and thus the reduction in the Solow residual) remains in the
range 0.04 to 0.06 per cent. The role of R&D in explaining growth therefore remains rather small, and similar to the benchmark value of 0.05 per cent found by Galindo-Rueda (2007). This result is also consistent with earlier work by Edworthy and Wallis (2007), though users should note that this growth-accounting exercise captures only the direct contribution from ‘owned’ R&D knowledge. The limited contribution of R&D to growth is the result of the low income share of R&D accumulation remaining relatively constant with respect to changes in depreciation rates.
Software and funding-ownership assumptions
Both GVA and the contributions to growth of R&D capital are unaff ected to two decimal places by changes in the assumed shares of R&D funded and owned by a given sector (but performed by a diff erent sector) or the soft ware deduction assumption. Further, for all these
assumptions, this result is robust to the use of more extreme scenarios.5
Conclusion
Th is article has built upon previous work in Economic & Labour MarketReview, treating expenditure on research and development as investment in an intangible scientifi c asset. Th e sensitivity of the impacts of R&D capitalisation previously quantifi ed have been investigated via a sensitivity analysis on the key assumptions.
Taking 2004 as the reference year, the sensitivity of goods and services account impacts, GDP and NDP estimates, R&D intensity indicators and key economic ratios have been examined. Th ese results are rather robust to changes in key assumptions, with only goods and services account impacts showing signifi cant sensitivity vis-à-vis the depreciation rates of R&D capital in the government and NPISH sectors.
In addition, growth-accounting results show a small but robust contribution of R&D to growth in recent years, consistent with previous work.
A key fi nding is that uncertainty regarding the correct depreciation rates in the government and NPISH sectors is important for R&D capitalisation, but only at a relatively disaggregated – supply and demand – level.
Notes
1 Th e sensitivity analysis is carried out holding all other variables at their values in the benchmark analysis of Galindo-Rueda (2007).
2 Th is table is based on ‘Methods for obtaining R&D service lives’, prepared for the OECD Task Force on R&D and other Intellectual Property Products, 24–25 April 2008.
3 It is worth noting that Edworthy and Wallis (2007) have estimated the UK business sector R&D depreciation rate at 50 per cent. Results here are robust to the use of a 50 per cent depreciation rate. Th e GSA, GDP estimates and the R&D intensity indicators and key economic ratios are left unchanged. Th e NDP estimate does change, but the impact is relatively small; NDP is only 0.07 per cent below the original estimate for a 20 per cent depreciation rate. 4 To produce relatively large changes in
the total demand impact of around 4 per cent, a 25 percentage point change is required.
[image:6.595.39.381.247.481.2]Table 11
Sensitivity of R&D intensity indicators and key economic ratios to depreciation rates, 2004
Ratios
Source: Offi ce for National Statistics
Depreciation rate (%)
GERD/GDP R&D GFCF/GDP Gross operating surplus/GDP Gross saving/gross national disposable income
BB06 Satellite Satellite BB06 Satellite BB06 Satellite
Depreciation of land and buildings
0.5 0.017 Unchanged to three decimal places
0.017 0.322 Unchanged to three decimal places
0.151 0.165
Original 1.5 0.017 0.017 0.016 0.322 0.330 0.151 0.164
2.5 Unchanged to three decimal places
Depreciation of plant and machinery
20 Unchanged to three decimal places
Original 15 0.017 0.017 0.016 0.322 0.330 0.151 0.164
10 Unchanged to three decimal places
Depreciation of R&D stocks for the business sector
15 Unchanged to three decimal places
Original 20 0.017 0.017 0.016 0.322 0.330 0.151 0.164
25 Unchanged to three decimal places
Depreciation of R&D stocks for the government and NPISH sectors
2.5 Unchanged to three decimal places
Original 5.0 0.017 0.017 0.016 0.322 0.330 0.151 0.164
7.5 Unchanged to three decimal places
Table 12
Sensitivity of the impact of R&D stock accumulation on economic growth to depreciation rates, 1997 to 2004
Percentages
Note: Source: Authors’ calculations on a number of ONS sources
GVA excludes dwellings.
Land and buildings Plant, machinery and equipment Business sector R&D Government and NPISH R&D
Original Original Original Original
Depreciation rate 0.5 1.5 2.5 10.0 15.0 20.0 15.0 20.0 25.0 2.5 5.0 7.5
GVA growth 2.82 2.80 2.79
Unchanged to two decimal places
2.80
Unchanged to two decimal places
Unchanged to two decimal places
2.80
Unchanged to two decimal places
2.79 2.80
Unchanged to two decimal places
Contributions to growth
Other assets 1.45 1.45 1.45 1.45 1.45 1.45 1.45
R&D assets 0.06 0.05 0.04 0.05 0.05 0.04 0.05
QALI 0.80 0.80 0.80 0.80 0.80 0.80 0.80
Multifactor productivity growth
MFP excluding R&D 2.25 2.25 2.25 2.25 2.25 2.25 2.25
MFP including R&D 2.31 2.30 2.29 2.30 2.30 2.29 2.30
Residual excluding R&D 0.57 0.55 0.54 0.55 0.55 0.54 0.55
Residual including R&D 0.51 0.50 0.50 0.50 0.50 0.50 0.50
ACKNOWLEGEMENTS
The Offi ce for National Statistics would like to thank Professor Barbara Fraumeni of the Muskie School of Public Service, University of Southern Maine, United States, for helpful comments.
CONTACT
elmr@ons.gsi.gov.uk
REFERENCES
Edworthy E and Wallis G (2007) ‘Treating research and development as a capital asset’,
Economic & Labour Market Review 1(2), pp 16–25.
Galindo-Rueda F (2007) ‘Developing an R&D satellite account for the UK: A preliminary analysis’, Economic & Labour Market Review
1(12), pp 18–29.
Organisation for Economic Co-operation and Development (2002) Frascati Manual: Proposed standard practice for surveys on research and development, OECD Paris. Organisation for Economic Co-operation and Development (2008) ‘Methods for obtaining R&D service lives’, prepared for the OECD Task Force on R&D and other intellectual property products (unpublished), 24–25 April 2008.
[image:7.595.42.558.369.516.2]