www.wjpr.net Vol 4, Issue 08, 2015.
A
NEW
MATHEMATIC
METHOD
FOR
CALCULATION
OF
PEPPAS-SAHLIN
MODEL
CONSTANTS
AND
INTERPRET
THE
RESULTS
IN
RELATION
TO
ZERO
ORDER,
HIGUCHI,
KROSMEYER-PEPPAS
MODELS
AND
MICROCAPSULE
STRUCTURE
IMAGE.
Dr. Omar Y. Mady* and Dr. Ahmed A. Donia
Department of Pharmaceutical Technology, Faculty of Pharmacy, Tanta University, Egypt.
ABSTRACT
It was tried to calculate the constants values of Peppes-Sahlin model
(k1&k2) using software packet and a mathematic matrix method for
aspirin release data from Eudragit RS100 microcapsules. Then discuss
the values of the constants as tool for the drug release mechanisms
determination in relation to the physico-chemical microcapsule
structure suggested by the author. In addition, applying the new
mathematic method suggested by the author as a trial to have an image
about the drug release mechanism(s) and the violet of each at every
unit time from the microcapsules. The calculation of the Peppes-Sahlin
constants (k1&k2) were done at fixed m value for Fickian drug
diffusion from the spheres, at m value determined by the software packet and at m value equal to the exponent n value of Krosmeyer- Peppas model. The results showed the inability of using both fixed (m) value for Fickian diffusion from spheres and that calculated by software packet. The using of (m) value equal to (n) value showed the contribution of Fickian diffusion and polymer chain relaxation on the drug release process which is in agreement with the microcapsule structure but sometimes did
not in agreement with the overall drug release mechanism. In addition the results cannot used
for calculation the percent of drug released by each mechanism at each unite time of the drug
release. The application of a new mathematic method using m value equal to n value led to calculate the percent of drug released by each mechanism at each unite time. Also showed the
overlap, alternate, predominate and combination of drug release mechanisms at each unite
time.
Volume 4, Issue 8, 2199-2246. Research Article ISSN 2277– 7105
Article Received on 15 June 2015,
Revised on 06 July 2015, Accepted on 27 July 2015
*Correspondence for Author
Dr. Omar Y. Mady
Department of
Pharmaceutical
Technology, Faculty of
Pharmacy, Tanta
KEYWORDS: New mathematic method, Krosmeyer-Peppas model, Peppas-Sahlin model, Zero order kinetic, Higuchi model.
INTRODUCTION
Drug release is the process by which a drug leaves the dosage form and is subjected to
absorption, distribution, metabolism and excretion, eventually becoming available for
pharmacological action[1]. In vitro dissolution has been recognized as an important element in
drug development. Under certain conditions it can be used as a surrogate for assessment of
bioequivalent[2]. During the journey of the pharmaceutical technology development, there
were continuous suggestion of different models to interpret the mechanisms of the drug
release. One of the most popular is Higuchi model. It describes drug release as a diffusion
process based in the Fick’s law, square root time dependent. Higuchi model was simplified
as, Q = KH t1/2 where KH is the Higuchi dissolution rate constant. For diffusion controlled
process, plotting the amount of drug released in time per unit area versus square root of time
is linear.[3-4] This relation can be used to describe the drug dissolution from several types of
modified release pharmaceutical dosage forms[2].
An empirical equation to analyze both Fickian and non-Fickian release of drug from swelling
as well as non-swelling polymeric delivery systems was developed by Ritger-Peppas and
Korsmeyer- Peppas[5-7]. The equation is represented as: Mt / M ∝ = K t n. The logarithm form
of the equation could be written as: Log (Mt / M ∝ ) = Log k + n Log t where (Mt / M∝)is
fraction of drug released at time t, n is diffusion exponent indicative of the transport mechanism of drug through the polymer, K is kinetic constant (having units of t-n) incorporating structural and geometric characteristics of the delivery system. The release
exponent n is ≤ 0.5 for Fickian diffusion and › 0.5 - › 1 for non-Fickian diffusion (Anomalous Transport) from slab respectively. A value of n is 1 actually means that, the drug release is independent of time regardless of the geometry (Case II transport, Zero order release). If the
value of n is higher than 1, then the drug release transport is Super Case II transport. The value of n ≤ 0.43 for Fickian diffusion and › 0.43 - › 0.85 for non-Fickian diffusion from spheres, respectively. A value of n is 0.85 actually means that, the drug release is independent of time regardless of the geometry (Case II transport, Zero order release). If the
value of n is higher than 0.85 then the drug release transport is Super Case II transport. This equation can be used to analyze only first 60% of release, regardless of geometric
An interesting model based on logic concepts was developed by Peppas-Sahlin to quantify
and materialize the amount of drug released by Fickian diffusion and polymer relaxation.
This model accounts for the coupled effects of Fickian diffusion and case II transport[11-12].
𝐌𝐭/𝐌∞ = K1 tm + K2 t2mwhere Mt/M∞ is the fraction of drug release at time t. The first and
the second terms on the right hand side of the equation represent the Fickian diffusion and the
case II relaxation contributions respectively[11-13]
.
k1 and k2 are kinetic constants. To calculatethe kinetic constants, the release data treated as a system of non-linear equations using special
soft wares[13, 14]. Matrix method is widely used to calculate the kinetic constants by soft
wares which lead to calculation of one constant value for each mechanism of the whole drug
release process. Omar Y. Mady, proved about the unacceptable points of using one value for
the kinetic constants (k1&k2) of the whole drug release time for comparison and also for
calculation the Fickian fraction release especially the drug release mechanism is a dynamic
process. Another mathematic method suggested by Mady O.,and it was applied for
calculation of the kinetic constants (k1&k2) which is substitution method. The use of the
substitution method gives the chance for calculation of the kinetic constants (k1&k2) at each
unite time. As a result, it could be calculate the amount of drug release % by each mechanism
at each unite time and there is no need for further calculation for comparison like the Fickian
fraction release. Also the substitution method may be, indicate the role of each drug release
mechanism at each point especially because the comparison would be between the amount of
drug release % by each mechanism at each unite time. Not only that but also the overlap,
alternate, predominate and also combination of all drug release mechanisms at each unite
time indicate the dynamic complex drug release process which is in agreement with the logic
concept of the drug release[15].
The reasons for all suggested drug release models may be due to the full information’s about
the physico-chemical properties of both drugs and polymers which would be summarized in
the Preformulation process in addition to the high development in the pharmaceutical
technology processes. For example, the using of instrumental analysis methods like I.R.,
X-ray diffraction, DSC and extra help in the explanation of the method of drug entrapment in
the matrix during the formulation process and if there is any physical or chemical interaction
between the drug and excipients. In addition to the reported mechanisms of drug release from
certain polymers like swelling of certain kinds of celluloses, solubility of the polymer which
may be depends on the pH of the dissolution media and also release through pores from
with the helping of the information’s collected from the above ways, will lead to creation of
an image about the forms of the drug entrapped in the pharmaceutical dosage form[16-18]. Also
the using of computer system with different mathematic software played an important role in
the suggesting of different models. As an example to what stated above, Omar Y. Mady, tried
to solve the low drug entrapment in the microcapsule structure prepared by using solvent
evaporation technique[16-19]. The author suspended Aspirin crystal in the organic phase
containing dissolved Eudragit RS100 with different drug-polymer ratios before pouring into
0.1 N HCl containing gelatin as an aqueous phase. The mean actual drug content was
markedly higher than the theoretical one. Based on scientific and logic concepts which
supported with references, the findings were explained according to the division of the
emulsified microcapsule during preparation by what is named division mechanism[19]. XRPD,
DSC and FTIR scans were used for inspection of the crystallinity properties and any possible
interaction between the drug and the polymer[20]. Mady O., tried to use XRPD and DSC as
tools for studying the method of drug entrapment in the microcapsule structure. The results
helped to have an image about the drug entrapment methods which found to be more than one
form. At the first, the drug entrapped as a solid solution form. Increasing the theoretical drug
content leads to an increasing in the amount of the drug crystal form. Between these two
forms another minute form may be formed as a result of increasing the theoretical drug
content or /and certain kind of physic- chemical interaction between the drug and the
polymer. It was concluded that all analysis results supported what is suggested mechanism
during microcapsules formation (Division Mechanism) as a result of appearances or
disappearances of drug crystals in addition to its effect on actual drug content[21]. The
dissolution profiles of Aspirin from different particle size ranges of Eudragit RS100
microcapsules prepared with the same or different theoretical drug content were studied in
relation to the suggested microcapsule structures. The results again supported the image
about microcapsule structure suggested as a result of instrumental analysis discussed[22].
Mady O., tried to use different dependent models (kinetics and mechanisms) to study the
Aspirin release from different particle size ranges of Eudragit RS100 microcapsules prepared
with the same or different theoretical drug content in relation to the methods of drug
entrapment. It was found that the drug release kinetic obeys zero order and Higuchi models.
Higuchi model had a large application in the polymeric matrix systems but zero order is an
ideal to coated dosage forms. Both two entrapment forms are found to be the structure of
Eudragit RS100 microcapsules entrapped the drug[21]. The good fitting of the drug release to
models (Higuchi and Ritger-Peppes), indicates the mechanism of the drug release in every
case is either Case II or supper Case II in addition for few case anomalous one. The above
results are also supported by the good fitting of the dissolution data to Hixson-Crowel model
since Eudragit RS100 is a swellable and non-soluble polymer[23].According to what stated
above, the aim of this work is try calculate the constants values of Peppes-Sahlin (k1&k2)
using software packet (DDSolver) and matrix method suggested by the author[15]. Then
discuss the values of the constants as tools to the drug release mechanisms and the
physico-chemical microcapsule structure suggested also by the author. In addition, applying the new
mathematic method suggested by the author as a trial to have an image about the drug release
mechanism(s) and the violet of each at every unit time from the microcapsules.
MATERIALS AND METHODS
The materials and methods used are the same as in reference published by the author[23]. TDC
is % of theoretical drug content and ADC is % of actual drug content.
RESULTS AND DISCUSSION
In the literature it was found that Peppes et al[14] used the value of m for Peppes-Sahlin equation on studying the effect of the hydrogel structure and synthesis condition on the drug
delivery with two values, one of both calculated using special software and the second is
fixed at 0.5. It was also reported that when the exponent value is 0.5 for hydrogel membrane
then the release mechanism is Fickian diffusion one and if it is lower than 0.5 then the
transport mechanism is less Fickian diffusion one[24]. Accordingly, first it will try to calculate
the values of the model constants (k1 and k2) suggested by Peppes-Sahlin model using fixed m value at 0.43 for spheres, matrix method for calculation[23] and the results are represented in table (1). From the table it can be noticed that the correlation coefficient value (r2) in every case is higher than 0.98 which is high enough to evaluate the drug dissolution behavior by
Peppes-Sahlin equation. Also the values of k2 are very high comparing to the values of k1
which are also negative i.e. there is no Case I drug release (Fickian diffusion) and the drug
release mechanism follows case II relaxation. These results are in agreement with what is
reported by Mady O[23] who studied the drug release kinetics and found that the drug release
kinetic obeys zero order kinetic. At the same time these results are disagreement with the
obeying of the drug release data to Higuchi model since there is no role for Fickian diffusion
on the drug release process according to the application of Peppas-Sahlin model. Higuchi
becomes the ideal to describe coated dosage forms or membrane controlled dosage forms[3].
Both two forms are found to be the structure of Eudragit RS100 microcapsules entrapped
Aspirin[16, 18].
Table (1): Calculated values of Peppes-Sahlin constant on using fixed m value (0.43).
TDC 20% 33% 50%
Microcp. PS 500-400 400-315 315-80 800-500 500-400 315-80 800-500 500-400 315-80
k1
k2
m
r2
-7.599 15.832 0.430 0.991
-5.646 14.140 0.430 0.992
-9.092 14.716 0.430 0.978
-2.621 12.381 0.430 0.994
12.180 17.420 0.430 0.988
-7.155 15.218 0.430 0.993
-7.060 15.509 0.430 0.990
-5.622 14.487 0.430 0.990
-3.975 13.626 0.430 0.985
TDC 66% 80%
Microcp. PS 800-500 500-400 315-80 800-500 500-400 315-80
k1
k2
m
r2
-4.180 13.888 0.430 0.990
-8.254 15.244 0.430 0.984
-4.991 13.415 0.430 0.989
-2.551 13.055 0.430 0.993
-3.699 13.190 0.430 0.994
-5.001 13.452 0.430 0.994
At the same time the application of Krosmeyer-Peppes model indicated the drug release
mechanisms from the microcapsules prepared on using different TDC with different particle
size ranges are Case II and Super case II except that from the smallest particle size range of
microcapsules prepared on using of 20%, 50 %, 66% TDC and the biggest particle size range
of microcapsules prepared on using 66% TDC since the value of the exponent (n) is lower than 0.85 indicating the release mechanism is anomalous[23]. The application of
Krosmeyer-Peppas model results are in agreement with the image of microcapsules structure as a result
of instrumental analysis[21]. But these results are not again in agreement with that obtained
from the application of Peppes-Sahlin equation at fixed m value at 0.43 (table 1) which
indicates there is no roll for Fickian diffusion in drug release in all cases. Accordingly it can
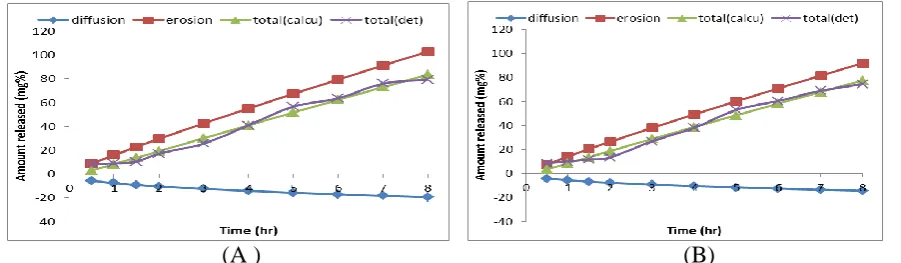
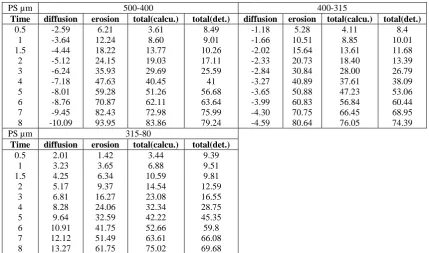
Table 2: Calculation the % of drug released by different mechanisms from Eudragit RS100 microcapsules prepared by using 20% TDC & the calculated (K1&K2) at fixed m value.
PS µm 500-400 400-315
Time diffusion Erosion total(calcu.) total(det.) diffusion erosion total(calcu.) total(det.)
0.5 1 1.5 2 3 4 5 6 7 8 -5.56 -7.60 -9.12 -10.38 -12.46 -14.18 -15.68 -17.02 -18.24 -19.37 8.48 15.83 22.80 29.54 42.56 55.13 67.39 79.41 91.23 102.88 2.92 8.23 13.68 19.16 30.10 40.95 51.72 62.39 72.99 83.51 8.49 9.01 10.26 17.11 25.59 41 56.68 63.64 75.99 79.24 -4.13 -5.65 -6.78 -7.71 -9.26 -10.54 -11.65 -12.65 -13.55 -14.39 7.58 14.14 20.37 26.39 38.01 49.24 60.19 70.92 81.48 91.88 3.44 8.49 13.59 18.67 28.75 38.70 48.54 58.28 67.92 77.49 8.40 10.01 11.68 13.39 26.79 38.09 53.06 60.44 68.95 74.39
PS µm 315-80
Time diffusion erosion total(calcu.) total(det.)
0.5 1 1.5 2 3 4 5 6 7 8 -6.66 -9.09 -10.91 -12.42 -14.91 -16.97 -18.76 -20.36 -21.82 -23.18 7.89 14.72 21.20 27.46 39.55 51.24 62.64 73.81 84.80 95.62 1.23 5.62 10.29 15.04 24.65 34.28 43.88 53.45 62.97 72.45 9.39 9.51 9.81 12.59 16.55 28.75 45.35 59.8 66.08 69.68
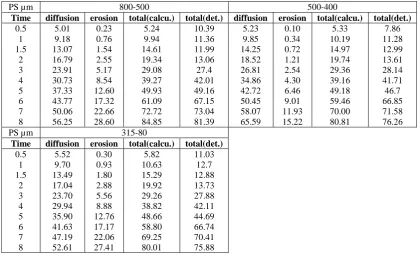
On trying to estimate the percent of drug release by different mechanisms at each time
intervals, the amount of drug release % could be calculated using the values of coefficient
constants (k1&k2) which calculated at fixed m value and then substituted in Peppes-Sahlin
equation[15]. The results of this substitution are summarized in tables (2-6). From the tables, it
can be noticed that, the amount of drug release % by diffusion mechanism from different
particle size ranges microcapsules prepared by using the same or different TDC are negative.
This indicates that there is no contribution for the Fickian diffusion mechanism in the drug
release process but it is only a pure polymer chain relaxation predominant mechanism. That
is may be due to that, the negative values of k1 calculated as a result of using fixed value of m. Also from the tables it can be noticed that the determined amount of drug release % after half an hour, which represents in this case the initial drug release and indicates if there is
burst effect or not, in every case is markedly higher than that calculated one. In addition, it
can be noticed that the calculated total % of drug release which is the summation of the
amount % of drug released by diffusion and dissolution are not completely similar to the
experimental determined total percent of drug release even that till 6 hours release time which
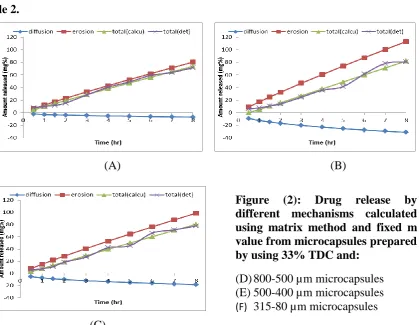
Table 3: Calculation the % of drug released by different mechanisms from Eudragit RS100 microcapsules prepared by using 33% TDC & the calculated (K1&K2) at fixed m value.
PS µm 800-500 500-400
Time diffusion erosion total(calcu.) total(det.) diffusion erosion total(calcu.) total(det.)
0.5 1 1.5 2 3 4 5 6 7 8 -1.92 -2.62 -3.15 -3.58 -4.30 -4.89 -5.41 -5.87 -6.29 -6.68 6.64 12.38 17.83 23.10 33.28 43.11 52.70 62.10 71.34 80.45 4.72 9.76 14.69 19.52 28.98 38.22 47.30 56.23 65.05 73.77 7.99 10.28 11.9 15.54 28.41 40.7 49.05 59.28 64 71.53 -8.92 -12.18 -14.62 -16.64 -19.97 -22.73 -25.13 -27.28 -29.24 -31.05 9.33 17.42 25.09 32.51 46.82 60.66 74.15 87.37 100.38 113.19 0.42 5.24 10.47 15.87 26.85 37.93 49.02 60.09 71.14 82.15 6.48 7.83 10.93 14.07 24.65 35.78 41.6 61.55 78.28 81.13
PS µm 315-80
Time diffusion erosion total(calcu.) total(det.)
0.5 1 1.5 2 3 4 5 6 7 8 -5.24 -7.15 -8.59 -9.77 -11.73 -13.35 -14.76 -16.02 -17.18 -18.24 8.16 15.22 21.92 28.40 40.90 52.99 64.78 76.33 87.69 98.89 2.92 8.06 13.33 18.62 29.17 39.64 50.02 60.31 70.52 80.65 5.98 7.79 11.11 18.41 26.94 42.41 45.7 66.19 71.5 77.85
Table 4: Calculation the % of drug released by different mechanisms from Eudragit RS100 microcapsules prepared by using 50% TDC & the calculated (K1&K2) at fixed m value.
PS µm 800-500 500-400
Time diffusion erosion total(calcu.) total(det.) diffusion erosion total(calcu.) total(det.)
0.5 1 1.5 2 3 4 5 6 7 8 -5.17 -7.06 -8.47 -9.64 -11.57 -13.17 -14.57 -15.81 -16.95 -18.00 8.31 15.51 22.34 28.94 41.69 54.00 66.02 77.79 89.36 100.78 3.14 8.45 13.87 19.30 30.11 40.83 51.45 61.98 72.42 82.78 10.39 11.36 11.99 13.06 27.4 42.01 49.16 67.15 73.04 81.39 -4.12 -5.62 -6.75 -7.68 -9.22 -10.49 -11.60 -12.59 -13.50 -14.33 7.76 14.49 20.87 27.03 38.94 50.45 61.67 72.66 83.48 94.14 3.65 8.86 14.12 19.35 29.72 39.96 50.07 60.07 69.98 79.81 7.86 11.28 12.99 13.61 28.14 41.71 46.7 66.85 71.58 76.26
PS µm 315-80
Time diffusion erosion total(calcu.) total(det.)
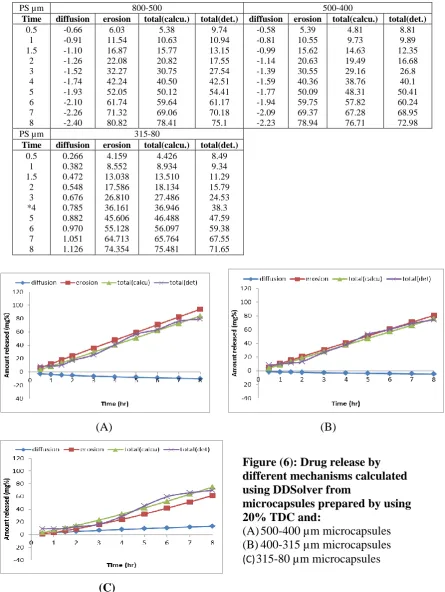
An exploratory data analysis was also done for the calculated % of drug release by different
mechanisms from Eudragit RS100 microcapsules prepared by using different or similar TDC
& the calculated (k1&k2) at fixed m value. This is done by plotting the dissolution data from
tables (2-6) which will be figures (1-5). The figures indicate the amount of drug release by
each mechanism and the relation between the calculated and determined total drug release %
at each time interval. From the figures it can be noticed that the amount of drug released as a
result of the polymer relaxation mechanism, in every case, is higher than the total amount
released either determined or calculated. Also the negative drug released as a result of
Fickian diffusion mechanism which is responsible about the higher value of that release by
polymer relaxation mechanism should not be considered. That is may be due that it can not
be imagine there is a reabsorption of the drug from the dissolution media although in
literature such phenomena can be found but on using plain polymer immersed in drug
solution[25].
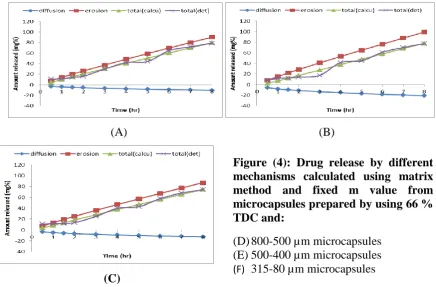
Table 5: Calculation the % of drug released by different mechanisms from Eudragit RS100 microcapsules prepared by using 66% TDC & the calculated (K1&K2) at fixed m value.
PS µm 800-500 500-400
Time diffusion erosion total(calcu.) total(det.) diffusion erosion total(calcu.) total(det.)
0.5 1 1.5 2 3 4 5 6 7 8 -3.06 -4.18 -5.02 -5.71 -6.85 -7.80 -8.62 -9.36 -10.03 -10.65 7.44 13.89 20.00 25.92 37.33 48.36 59.12 69.66 80.03 90.25 4.38 9.71 14.99 20.21 30.48 40.56 50.49 60.30 69.99 79.59 11 11.16 13.84 15.88 29.55 42.02 44.09 64.65 72.03 78.95 -6.04 -8.25 -9.91 -11.28 -13.53 -15.40 -17.03 -18.49 -19.81 -21.04 8.17 15.24 21.96 28.45 40.97 53.08 64.89 76.46 87.84 99.06 2.13 6.99 12.05 17.17 27.44 37.68 47.86 57.97 68.03 78.02 8.21 11.54 12.34 13.85 17.35 41.6 44.79 61.05 70.15 77.53
PS µm 315-80
Time diffusion erosion total(calcu.) total(det.)
0.5 1 1.5 2 3 4 5 6 7 8 -3.65 -4.99 -5.99 -6.82 -8.18 -9.31 -10.30 -11.18 -11.98 -12.72 7.19 13.41 19.32 25.03 36.06 46.71 57.10 67.29 77.30 87.17 3.54 8.42 13.33 18.21 27.87 37.40 46.81 56.11 65.32 74.45 10.86 11.11 11.76 13.31 24.85 39.86 42.68 57.73 67.99 74.2
The calculated total amount of drug released looks like as a fitting one for the determined
total amount of drug released. Also from the figures it can be concluded the role of the
polymer and the method of drug entrapment on the drug release mechanisms. They looked
application of the release data. Comparing the data from the tables and the equation used for
the calculations it can be stated that this variable is the time, accordingly it can be understand
the description of the figures (1-5) stated before[15].
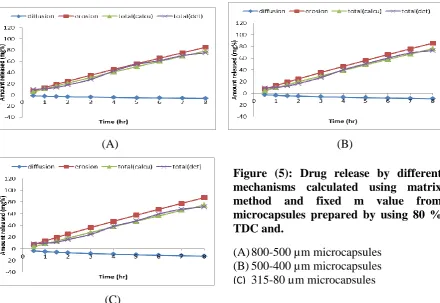
Table 6: Calculation the % of drug released by different mechanisms from Eudragit RS100 microcapsules prepared by using 80% TDC & the calculated (k1&k2) at fixed m value.
PS µm 800-500 500-400
Time diffusion erosion total(calcu.) total(det.) diffusion erosion total(calcu.) total(det.)
0.5 1 1.5 2 3 4 5 6 7 8 -1.87 -2.55 -3.06 -3.48 -4.18 -4.76 -5.26 -5.71 -6.12 -6.50 7.00 13.05 18.80 24.36 35.09 45.46 55.57 65.48 75.22 84.83 5.13 10.50 15.74 20.88 30.91 40.70 50.31 59.77 69.10 78.33 9.74 10.94 13.15 17.55 27.54 42.51 54.41 61.17 70.18 75.1 -2.71 -3.70 -4.44 -5.05 -6.06 -6.90 -7.63 -8.28 -8.88 -9.43 7.07 13.19 19.00 24.61 35.45 45.93 56.15 66.16 76.00 85.71 4.36 9.49 14.56 19.56 29.39 39.03 48.51 57.87 67.12 76.28 8.81 9.89 12.35 16.68 26.8 40.1 50.41 60.24 68.95 72.98
PS µm 315-80
Time diffusion erosion total(calcu.) total(det.)
0.5 1 1.5 2 3 4 5 6 7 8 -3.66 -5.00 -6.00 -6.83 -8.20 -9.33 -10.32 -11.20 -12.01 -12.75 7.21 13.45 19.38 25.10 36.16 46.84 57.26 67.47 77.51 87.41 3.55 8.45 13.37 18.27 27.96 37.51 46.94 56.27 65.51 74.66 8.49 9.34 11.29 15.79 24.53 38.3 47.59 59.38 67.55 71.65
Mady O., discussed some objections about the use of drug mechanisms constants of Peppes -Sahlin model (k1&k2) for comparison or for determination the mechanism of drug release.
These objections are again found in this study with the same proves. That is may be the
reason by which the model suggested researchers (Peppas-Sahlin) were not using the constant
values of (k1&k2) for further calculation of the amount of drug released by each mechanism
at each unit time and used instead what they called fractional contribution of each drug
release mechanism.
[image:10.595.75.526.634.765.2]
(C)
Figure 1: Drug release by different mechanisms calculated using matrix method from table 2.
(A) (B)
(C)
Figure 2: Drug release by different mechanisms calculated using matrix method from table 3.
Figure (1): Drug release by different mechanisms calculated using matrix method and fixed m value from microcapsules prepared by using 20% TDC and:
(A)500-400 µm microcapsules (B)400-315 µm microcapsules (C) 315-80 µm microcapsules
Figure (2): Drug release by different mechanisms calculated using matrix method and fixed m value from microcapsules prepared by using 33% TDC and:
[image:11.595.90.510.265.590.2]
(A) (B)
(C)
Figure 3: Drug release by different mechanisms calculated using matrix method from table 4.
(A) (B)
(C)
[image:12.595.76.513.437.724.2]Figure 4: Drug release by different mechanisms calculated using matrix method from table 5.
Figure (3): Drug release by different mechanisms calculated using matrix method and fixed m value from microcapsules prepared by using 50 % TDC and:
(A)800-500 µm microcapsules (B)500-400 µm microcapsules (C) 315-80 µm microcapsules
Figure (4): Drug release by different mechanisms calculated using matrix method and fixed m value from microcapsules prepared by using 66 % TDC and:
(A) (B)
(C)
Figure 5: Drug release by different mechanisms calculated using matrix method from table 6.
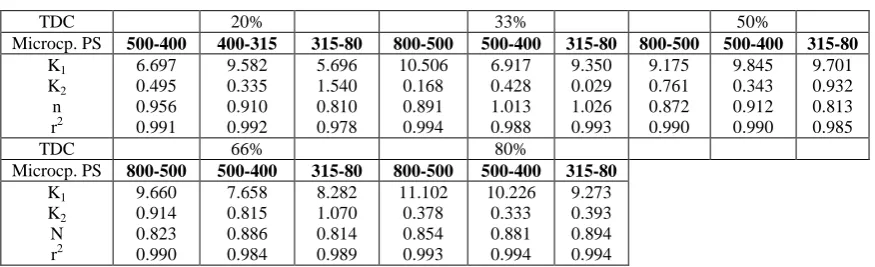
The second trial is calculation of the values of Peppes-Sahlin model constants (k1&k2) and
the exponent m using DDSolver software. The results are represented in table (7). From the table it can be noticed that the values of the correlation coefficient (r2 ›0.97) are high enough to evaluate the drug dissolution behaviors according to Peppes-Sahlin model. From the table
(7), it can be noticed that, the value of k1 is very low comparing with that of k2 and is also
negative for drug release from microcapsules prepared on using 20% TDC (500-400 &
400-315 µm) 33% TDC (800-500 & 400-315-80 µm), 50% (500-400 µm) and 80% TDC (800-500 &
500-400 µm). This interpretable data indicates that there is no contribution for the Fickian
diffusion drug release mechanism from that microcapsules prepared with the same or
different TDC but it is a polymer chain relaxation one as an overall drug release mechanism.
Concerning the values of the exponent (n) of Krosmeyer-Peppas equation it can be concluded that the drug release mechanism from the above microcapsules prepared with the same or
different TDC is Super Case II transport. These results are in agreement with what stated by
the author about the drug release mechanism from the above stated microcapsules (zero order
kinetics). On contrary these results are not in agreement with the obeying of the release data
to Higuchi models since there is no Fickian diffusion role[23].
Figure (5): Drug release by different mechanisms calculated using matrix method and fixed m value from microcapsules prepared by using 80 % TDC and.
[image:13.595.78.519.70.373.2]Table (7): Calculated values of Peppes-Sahlin constants using DDSolver software
TDC 20% 33% 50%
Microcp. PS 500-400 400-315 315-80 800-500 500-400 315-80 800-500 500-400 315-80
k1
k2
m
r2
-3.642 12.243 0.490 0.984
-1.658 10.509 0.496 0.984
3.226 3.651 0.680 0.965
-3.940 13.598 0.436 0.989
4.118 3.090 0.738 0.986
-5.260 13.498 0.469 0.987
3.400 6.040 0.598 0.982
-0.211 9.568 0.514 0.980
4.980 5.402 0.590 0.970
n* 0.956 0.910 0.810 0.891 1.013 1.026 0.872 0.912 0.813
TDC 66% 80%
Microcp. PS 800-500 500-400 315-80 800-500 500-400 315-80
k1
k2
m
r2
6.809 3.779 0.645 0.982
4.682 3.592 0.682 0.973
6.154 3.166 0.671 0.982
-0.908 11.540 0.468 0.986
-0.814 10.547 0.484 0.989
0.382 8.552 0.520 0.988
n* 0.823 0.886 0.814 0.854 0.881 0.894
n* is the exponent value of Krosmeyer-Peppas model from reference[23].
On the other side and also from table (7), the contribution of the effects of Fickian diffusion
and polymer chain relaxation on the overall drug release mechanism can be noticed from the
constants values (k1&k2) of drug release from microcapsules prepared on using 20% TDC
(315-80 µm), 33% TDC (500-400 µm), 50% TDC (800-500 & 315-80 µm), 66% TDC (all
particle size ranges) and 80% TDC (315-80 µm). At the same time and based on the limit
value of the exponent (n = 0.85 for Case II transport) of drug release mechanism from spheres, it can be noticed that the drug release mechanism from microcapsules prepared on
using 20% TDC (315-80 µm), 50% TDC (315-80 µm) and 66% (800-500 & 315-80 µm) is
anomalous which is in agreement with the calculated values of the drug release constants
(k1&k2). As a trial to explain the above findings, it was found that it is important to correlate
these results with both zero order constant (K0) and Higuchi constant (KH) of the drug
release. These data are represented in tables (8 A-C). In addition to the image of
microcapsule structure suggested by the author as a result of instrumental analysis [21, 26].
Table (8A): Calculated Zero order rate constant (k0) and Higuchi model constant (kH) for drug release data which has anomalous drug release mechanism according to (n)* values.
TDC % PS (µm) K0 KH Tlag FH
20% 315-80 9.336 32.635 2.198 -26.769
50% 315-80 9.731 34.410 1.292 -24.950
66% 800-500
315-80
9.888 9.301
34.945 32.738
1.323 1.358
-25.410 -24.273 (*) Data in the above table is from[23]
From table (8A), it is clear the similarity of the Zero order rate constant of the drug release
from the microcapsules have different particle size and also containing different actual drug
drug release is independent on the drug concentration in the formulation and the drug release
rate is constant over a period of time (Zero-order release kinetics)[26]
.
Also the closed Higuchirate constants indiacte the contribution of the Fickian diffusion on the overall drug release
mechanism since the polymer used is insoluble but swellable one in the dissolution media
(Phosphate buffer 7.4). The above results is also in aggreement with the image of the
microcapsule structure since both forms of drug entrapment mechansims are reported[21]. One
of them is solid solution form which normally explained by Higuchi drug release model and
reservoir type which explained by Zero order kinetics[27]. The results indicate the
interpertable data in relation to different drug release mechansims which is also related to the
microcapsule structure.As a deep explanation, Zero order drug release rate constant and also
Higuchi constant rate are similar for drug dissolution rate from microcapsules which have the
same particle size (315-80 µm) and prepared on using 20% and 66% TDC where the drug
content in the second microcapsules is nearly double to that in the first one[19]. Mady O.,[21],
reported that the microcapsule prepared on using 20% TDC, the smaller particle size ranges
contains higher drug content than that larger one and that is due to the presence of minute
drug crystal beside amorphous form. At the same time increasing the TDC in the product
prepared on using 66% led to increasing the drug crystal form in the bigger microcapsules
and solid solution form in the smallest one which is the reflection of the effect of division
mechanism. Accordingly it can be expected the similarity in the physic-chemical structure of
both microcapsules which have the same size range but prepared with different TDC. Also
the microcapsules prepared on using 66% TDC contain more drug crystal form which it has
to be logic and this reflect on the value of Tlag specially the retarding polymer used is
insoluble but swellable in the dissolution media. These two forms of drug entrapment
mechanisms look completely logic and are also in agreement with suggested drug release
mechanisms. On contrary and also based on the limit value of the exponent (n = 0.85 for Case II transport) of drug release mechanism from spheres, the drug release mechanism from
microcapsules prepared on using 33% TDC (500-400 µm), 50% TDC (800-500 µm), 66%
TDC (500-400 µm) and 80% TDC (315-80) is Super Case II as an overall drug release
mechanisms (Table 7). These results are not in agreement with the calculated values of the
drug release constants (k1&k2) which indicating the contribution of Fickian diffusion and non
Fickian on the drug release mechanism (table 7). Mady O[15] discussed this phenomena and
concluded that, the value of the kinetic constant (n) from Krosmeyer-Peppas equation has a
of k1and k2 of Peppas-Sahlin model have to be explain in correlation to the kinetic exponent
constant (n). At the same time and as a deep explanation may be as the following: it was reported that in the anomalous process of drug release, Fickian diffusion through the hydrated
layers of the matrix and polymer chain relaxation-erosion are both involved[28, 29]. Peppes et
al documented that the contribution of these two mechanisms to the overall release are
considered to be additive[11].
Table (8B): Calculated Zero order rate constant (k0) and Higuchi model constant (kH) for drug release which has Super Case II drug release mechanism according to (n) values.
TDC % PS K0 KH Tlag FH
33% 500-400 10.793 37.897 2.314 -32.887
50% 800-500 10.493 37.037 1.371 -28.853
66% 500-400 9.982 35.081 1.433 -28.132
80% 315-80 9.409 33.426 1.316 -25.571
Abhijit Gokhale[26], as a trial to Achieving Zero-Order Release Kinetics, He used Multi-Step
Diffusion-Based Drug Delivery. He prepared two core tablets contain a water-soluble
excipient (lactose anhydrous) and gelling polymer (hypromellose). The cores contains
release-controlling polymers Eudragit RS and Eudragit RL along with TEC as a plasticizer.
The author reported the combination of release mechanisms, the drug released from the core
tablets via multi-step diffusion-erosion of the core tablets (due to water-soluble filler) and
diffusion through the network of gelled hypromellose and Eudragit. This diffusion was also
explained using the Korsemeyer-Peppas model which was found to fit the drug-release
profile after examining cores. The results indicated the combined effect of diffusion and
erosion mechanisms. Because the dissolution profiles of the core tablets showed pseudo
zero-order release, the core tablets in both formulations were further coated to 5% w/w using a
combination of Eudragit RS and Eudragit RL. Due to this coating, the drug was released via
ternary diffusion mechanism. This release was explained using the Sahlin-Peppas model, as it
accounts for the combination of drug release through the hydrated matrix core and polymer-
chain relaxation of the Eudragit coating. By optimizing these release-controlling polymers,
reduction of the diffusional exponent of the tablet core to the Fickian diffusion was achieved
(n = 0.45), and hence zero-order release was obtained. Accordingly and as a result of what is
found that the overall drug release mechanism is Super Case II as the value of drug release
release constants (k1&k2) which normally used to indicate the contribution of Fickian and
polymer relaxation mechanisms. Then it can be suggested the additive effect of Fickian
diffusion and polymer chain relaxation mechanisms which may be responsible about the
determined Super Case II mechanism. These results are completely in agreement with the
image of the microcapsule structure suggested by the author[21]. Also based on the fact that
the diffusion-based drug release can be either Fickian or non-Fickian and in Fickian
diffusion, the rate of release is independent of the drug concentration in the tablets[26]. From
table (8B), it can be noticed that, the similarity of Zero order drug release constant and also
Higuchi rate constant of drug release from microcapsules prepared on using 33% and 50%
TDC. Since both microcapsules contain different actual drug content[19] accordingly it can be
concluded the role of Fickian diffusion mechanism. Also the difference between both
concerning to the drug release rate is only the Tlag. That is may be due to the method of drug
entrapment (33% TDC is solid solution and vey minute drug crystal but 50% more drug
crystal form than solid solution form). These results can be also noticed in case of
microcapsules prepared on using 66% and 80% TDC with no difference in Tlag (table 8B).
That is may be due the drug entrapment mechanism which is mainly solid dispersion one[21].
Table (8C): Calculated Zero order rate constant (k0) and Higuchi model constant (kH) for drug release which has Super Case II mechanism according to (k1&k2) values.
TDC % PS K0 KH Tlag FH
20% 500-400
400-315
10.694 9.810
38.006 34.877
1.346 1.311
-30.615 -27.088
33% 800-500
315-80
9.169 10.353
32.812 36.924
1.217 1.351
-23.970 -29.954
50% 500-400 10.087 35.853 1.318 -27.691
80% 800-500
500-400
9.690 9.526
34.582 33.951
1.219 1.264
-24.841 -25.198
An interesting finding from table (7) can be also noticed that on studying the overall drug
release mechanism from microcapsules prepared on using 20% TDC (500-400 & 400-315
µm) 33% TDC (800-500 & 315-80 µm), 50% (400 µm) and 80% TDC (800-500 &
500-400 µm) which is Super Case II transport concerning the values of the exponent (n) for the Korsmeyer-Peppas equation. At the same time on applying Peppas-Sahlin model the
interpretable data indicate that there is no contribution for the Fickian diffusion drug release
mechanism. Studying the Zero order rate constants table (8C) shows the release rate constants
that of 50% TDC (500-400 µm) have the same values indicating polymer chain relaxation
mechanism which is in agreement with Super case drug release mechanism. Decreasing the
Higuchi rate constants from that microcapsules indicating decreasing the solid solution form
of the drug and increasing solid dispersion one which is in agreement with the image
suggested by the author[21]. At the same time the neglection of the effect of Fickian diffusion
mechanism in the drug release in the above cases although the microcapsule structure and
also the agreement of the drug release with Higuchi model lead to concluded the
disagreement between the different models which normally explain each other’s.
As a summary, the objections from the using the values of (k1, k2 & m) calculated by
DDSolver soft wares are two things: first is, sometimes disagreement between exponent
value of drug release mechanism (n) of Krosmeyer-Peppas equation and the coefficient constant values of Peppas-Sahlin model (k1, k2). Also the disagreements with the fixed
applicable models for drug release presentations like Zero order kinetics and Higuchi model.
Second is, the result also sometimes is not in agreement with the physic-chemical structure of
the product.
On trying to estimate the percent of drug release by different mechanisms at each time
intervals, the amount of drug release % could be calculated using the values of coefficient
constants (k1, k2 &m) which calculated by using DDSolver software and then substitution in
Table 9: Calculation the % of drug released by different mechanisms from Eudragit RS100 microcapsules prepared by using 20% TDC & the calculated (K1,K2&m) by DDSolver.
PS µm 500-400 400-315
Time diffusion erosion total(calcu.) total(det.) diffusion erosion total(calcu.) total(det.)
0.5 1 1.5 2 3 4 5 6 7 8 -2.59 -3.64 -4.44 -5.12 -6.24 -7.18 -8.01 -8.76 -9.45 -10.09 6.21 12.24 18.22 24.15 35.93 47.63 59.28 70.87 82.43 93.95 3.61 8.60 13.77 19.03 29.69 40.45 51.26 62.11 72.98 83.86 8.49 9.01 10.26 17.11 25.59 41 56.68 63.64 75.99 79.24 -1.18 -1.66 -2.02 -2.33 -2.84 -3.27 -3.65 -3.99 -4.30 -4.59 5.28 10.51 15.64 20.73 30.84 40.89 50.88 60.83 70.75 80.64 4.11 8.85 13.61 18.40 28.00 37.61 47.23 56.84 66.45 76.05 8.4 10.01 11.68 13.39 26.79 38.09 53.06 60.44 68.95 74.39
PS µm 315-80
Time diffusion erosion total(calcu.) total(det.)
0.5 1 1.5 2 3 4 5 6 7 8 2.01 3.23 4.25 5.17 6.81 8.28 9.64 10.91 12.12 13.27 1.42 3.65 6.34 9.37 16.27 24.06 32.59 41.75 51.49 61.75 3.44 6.88 10.59 14.54 23.08 32.34 42.22 52.66 63.61 75.02 9.39 9.51 9.81 12.59 16.55 28.75 45.35 59.8 66.08 69.68
From the tables, it can be noticed that, the amount of drug release % by diffusion mechanism
for all drug release time of different particle size ranges microcapsules prepared by using the
same or different TDC is depend on the sign of the value of diffusion constant (k1). Also the
determined amount of drug release % after half an hour, which represents the initial drug
release and indicates if there is burst effect or not, in every case is markedly higher than that
calculated one. In addition, it can be noticed that the calculated total % of drug release which
is the summation of the amount % of drug released by diffusion and dissolution is not
completely similar to the experimental determined total percent of drug release even that till 6
hours release time which represent the time for 60% drug release[15]. All of these finding was
also reported on using fixed (m) value which may be the reason by which the model suggested researchers (Peppas-Sahlin) were not using the constant values of (k1&k2) for
further calculation of the amount of drug released by each mechanism at each unit time and
[image:19.595.83.513.132.385.2]Table 10: Calculation the % of drug released by different mechanisms from Eudragit RS100 microcapsules prepared by using 33% TDC & the calculated (k1, k2 &m) by DDSolver.
PS µm 800-500 500-400
Time diffusion erosion total(calcu.) total(det.) diffusion erosion total(calcu.) total(det.)
0.5 1 1.5 2 3 4 5 6 7 8 -2.91 -3.94 -4.70 -5.33 -6.36 -7.21 -7.95 -8.60 -9.20 -9.75 7.43 13.60 19.37 24.89 35.44 45.55 55.33 64.87 74.20 83.36 4.52 9.66 14.66 19.56 29.08 38.34 47.38 56.26 65.00 73.61 7.99 10.28 11.9 15.54 28.41 40.7 49.05 59.28 64 71.53 2.47 4.12 5.55 6.87 9.26 11.46 13.51 15.45 17.31 19.11 1.11 3.09 5.62 8.60 15.64 23.91 33.24 43.50 54.61 66.51 3.58 7.21 11.18 15.46 24.90 35.37 46.74 58.95 71.93 85.62 6.48 7.83 10.93 14.07 24.65 35.78 41.6 61.55 78.28 81.13
PS µm 315-80
Time diffusion erosion total(calcu.) total(det.)
0.5 1 1.5 2 3 4 5 6 7 8 -3.80 -5.26 -6.36 -7.28 -8.81 -10.08 -11.19 -12.19 -13.10 -13.95 7.05 13.50 19.74 25.86 37.83 49.55 61.08 72.47 83.75 94.92 3.25 8.24 13.38 18.58 29.02 39.47 49.89 60.29 70.65 80.98 5.98 7.79 11.11 18.41 26.94 42.41 45.7 66.19 71.5 77.85
Table 11: Calculation the % of drug released by different mechanisms from Eudragit RS100 microcapsules prepared by using 50% TDC & the calculated (k1, k2 &m) by DDSolver.
PS µm 800-500 500-400
Time diffusion erosion total(calcu.) total(det.) diffusion erosion total(calcu.) total(det.)
0.5 1 1.5 2 3 4 5 6 7 8 2.25 3.40 4.33 5.15 6.56 7.79 8.90 9.93 10.88 11.79 2.64 6.04 9.81 13.84 22.47 31.70 41.40 51.49 61.91 72.63 4.88 9.44 14.14 18.98 29.03 39.49 50.30 61.41 72.79 84.42 10.39 11.36 11.99 13.06 27.4 42.01 49.16 67.15 73.04 81.39 -0.15 -0.21 -0.26 -0.30 -0.37 -0.43 -0.48 -0.53 -0.57 -0.62 4.69 9.57 14.52 19.51 29.60 39.79 50.04 60.36 70.72 81.13 4.54 9.36 14.26 19.21 29.23 39.35 49.56 59.83 70.15 80.52 7.86 11.28 12.99 13.61 28.14 41.71 46.7 66.85 71.58 76.26
PS µm 315-80
Time diffusion erosion total(calcu.) total(det.)
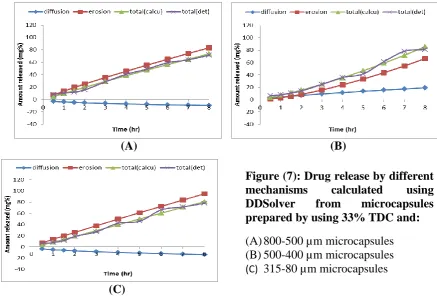
An exploratory data analysis was also done for the calculated % of drug release by different
mechanisms from Eudragit RS100 microcapsules prepared by using different or similar TDC
& the calculated (k1,k2 &m) using DDSolver from tables (9-13) which will be figures (6-10).
The figures indicate the amount of drug release by each mechanism and the relation between
the calculated and determined total drug release % at each time interval. From the figure it
can be notice the effect of the sign of constants value (k1&k2) on the amount of drug released
by each mechanism i.e. the amount of drug released by Fickian is negative when the value of
k1 is negative.
Also from the figures it can be concluded the same results noticed stated before about the
constant variable which is the time. This indicates the same objections on using of drug
mechanisms constants of Peppes-Sahlin model (k1&k2) for comparison or for determination
the mechanism of drug release[15].
Table 12: Calculation the % of drug released by different mechanisms from Eudragit RS100 microcapsules prepared by using 66% TDC & the calculated (K1,K2&m) by DDSolver.
PS µm 800-500 500-400
Time diffusion erosion total(calcu.) total(det.) diffusion erosion total(calcu.) total(det.)
0.5 1 1.5 2 3 4 5 6 7 8 4.35 6.81 8.84 10.64 13.82 16.64 19.22 21.62 23.88 26.03 1.55 3.78 6.38 9.25 15.60 22.61 30.15 38.15 46.54 55.29 5.90 10.59 15.22 19.89 29.43 39.25 49.37 59.77 70.42 81.31 11 11.16 13.84 15.88 29.55 42.02 44.09 64.65 72.03 78.95 2.92 4.68 6.17 7.51 9.91 12.05 14.03 15.89 17.65 19.34 1.40 3.59 6.25 9.25 16.08 23.80 32.27 41.38 51.06 61.26 4.31 8.27 12.42 16.76 25.98 35.85 46.30 57.27 68.71 80.60 8.21 11.54 12.34 13.85 17.35 41.6 44.79 61.05 70.15 77.53
PS µm 315-80
Time diffusion erosion total(calcu.) total(det.)
0.5 1 1.5 2 3 4 5 6 7 8 3.87 6.15 8.08 9.80 12.86 15.60 18.12 20.48 22.71 24.84 1.25 3.17 5.46 8.03 13.83 20.35 27.45 35.06 43.12 51.58 5.11 9.32 13.53 17.82 26.69 35.95 45.57 55.54 65.83 76.42 10.86 11.11 11.76 13.31 24.85 39.86 42.68 57.73 67.99 74.2
From above it can be concluded that the exponent coefficient value (n) which used as an indication for the drug release mechanism[11] is an overall additive value which can be
divided into two values, one for drug release by Fickian diffusion and second for non-Fickian
Table 13: Calculation the % of drug released by different mechanisms from Eudragit RS100 microcapsules prepared by using 80% TDC & the calculated (K1.K2&m) by DDSolver.
PS µm 800-500 500-400
Time diffusion erosion total(calcu.) total(det.) diffusion erosion total(calcu.) total(det.)
0.5 1 1.5 2 3 4 5 6 7 8 -0.66 -0.91 -1.10 -1.26 -1.52 -1.74 -1.93 -2.10 -2.26 -2.40 6.03 11.54 16.87 22.08 32.27 42.24 52.05 61.74 71.32 80.82 5.38 10.63 15.77 20.82 30.75 40.50 50.12 59.64 69.06 78.41 9.74 10.94 13.15 17.55 27.54 42.51 54.41 61.17 70.18 75.1 -0.58 -0.81 -0.99 -1.14 -1.39 -1.59 -1.77 -1.94 -2.09 -2.23 5.39 10.55 15.62 20.63 30.55 40.36 50.09 59.75 69.37 78.94 4.81 9.73 14.63 19.49 29.16 38.76 48.31 57.82 67.28 76.71 8.81 9.89 12.35 16.68 26.8 40.1 50.41 60.24 68.95 72.98
PS µm 315-80
Time diffusion erosion total(calcu.) total(det.)
0.5 1 1.5 2 3 *4 5 6 7 8 0.266 0.382 0.472 0.548 0.676 0.785 0.882 0.970 1.051 1.126 4.159 8.552 13.038 17.586 26.810 36.161 45.606 55.128 64.713 74.354 4.426 8.934 13.510 18.134 27.486 36.946 46.488 56.097 65.764 75.481 8.49 9.34 11.29 15.79 24.53 38.3 47.59 59.38 67.55 71.65
(A) (B)
(C)
Figure 6: Drug release by different mechanisms calculated using matrix method from table 9.
Figure (6): Drug release by different mechanisms calculated using DDSolver from
microcapsules prepared by using 20% TDC and:
[image:22.595.75.521.132.724.2]
(A) (B)
(C)
Figure 7: Drug release by different mechanisms calculated using matrix method from table 10.
(A) (B)
(C)
Figure 8: Drug release by different mechanisms calculated using matrix method from table 11.
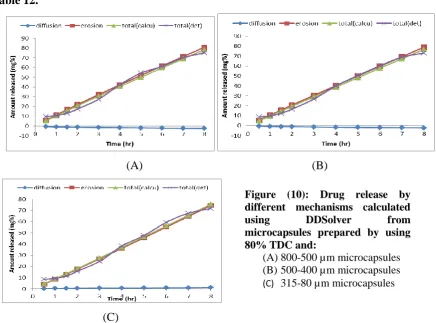
Figure (8): Drug release by different mechanisms calculated
using DDSolver from
microcapsules prepared by using 50% TDC and:
(A)800-500 µm microcapsules (B)500-400 µm microcapsules (C) 315-80 µm microcapsules
Figure (7): Drug release by different mechanisms calculated using DDSolver from microcapsules prepared by using 33% TDC and:
[image:23.595.71.509.70.366.2] [image:23.595.71.520.430.714.2]0 20 40 60 80 100
0 1 2 3 4 5 6 7 8
A
m
ount
r
e
le
ase
d
(m
g%)
Time (hr)
diffusion erosion
(A) (B)
(C)
[image:24.595.73.517.74.366.2]Figure 9: Drug release by different mechanisms calculated using matrix method from table 12.
(A) (B)
(C)
Figure 10: Drug release by different mechanisms calculated using matrix method from table 13.
Figure (9): Drug release by different
mechanisms calculated using
DDSolver from microcapsules
prepared by using 66% TDC and:
(A)800-500 µm microcapsules (B)500-400 µm microcapsules (C) 315-80 µm microcapsules
Figure (10): Drug release by different mechanisms calculated
using DDSolver from
microcapsules prepared by using 80% TDC and:
[image:24.595.77.514.395.718.2]It was reported that Peppas-Sahlin’s equation is valid for the first 60% of drug released. In
this equation k1 is the kinetic constant for Fickian contribution of drug release and k2 is the
kinetic constant for Case II contribution, and m is the diffusional exponent. m is equal to n
when the case II mechanism is negligible in the semi- empirical model for the analysis of
release data of Ritger-Peppas equation. As in the example of a thin polymer film, m would be 0.50 for a pure diffusional release mechanism and in this situation 2m would equal 1[30]. Fassihi et al, on studying the in vitro release modulation from crosslinked pellets for
site-specific drug delivery to the gastrointestinal tract used n value of Korsmeyer-Peppas to be used in Peppas-Sahlin model[31]. Mady[15], in a new mathematic approach for determination
of the mechanisms and percent of drug release of each used the exponent n value of Korsmeyer-Peppas equation to be equal the m value of Peppas-Sahlin model. Accordingly, the third trial is to calculate the values of Peppes-Sahlin model constants (k1&k2) using the
exponent n value of Korsmeyer-Peppas equation equal to m in Peppas-Sahlin model and matrix method. The results are represented in table (14). From the table it can be noticed that
the values of the correlation coefficient (r2 ›0.97) are high enough to evaluate the drug dissolution behaviors according to Peppes-Sahlin model. Also the results shows the
contribution of the effects of Fickian diffusion and polymer chain relaxation on the overall
drug release mechanism which can be noticed from the constants values (k1& k2) of drug
release from microcapsules prepared using different or the same theoretical drug content and
different particle size. Based on the two facts that, first, in case of the homogenous
distribution of the drug in the matrix (solid solution or dispersion) then the drug release can
be describe by Higuchi model and that reservoir type the drug release can be describe by Zero
order kinetics. Second, Mady O., proved by using instrumental analysis that these two forms
of drug entrapment mechanisms were found in different products dependingon the TDC used
[image:25.595.80.518.619.752.2]in the preparation of the microcapsules and also the microcapsule particle size[21].
Table 14: Calculated values of Peppes-Sahlin constants using matrix method and n = m.
TDC 20% 33% 50%
Microcp. PS 500-400 400-315 315-80 800-500 500-400 315-80 800-500 500-400 315-80
K1
K2
n
r2
6.697 0.495 0.956 0.991
9.582 0.335 0.910 0.992
5.696 1.540 0.810 0.978
10.506 0.168 0.891 0.994
6.917 0.428 1.013 0.988
9.350 0.029 1.026 0.993
9.175 0.761 0.872 0.990
9.845 0.343 0.912 0.990
9.701 0.932 0.813 0.985
TDC 66% 80%
Microcp. PS 800-500 500-400 315-80 800-500 500-400 315-80
K1
K2
N
r2
9.660 0.914 0.823 0.990
7.658 0.815 0.886 0.984
8.282 1.070 0.814 0.989
11.102 0.378 0.854 0.993
10.226 0.333 0.881 0.994
Accordingly, it can be concluded the logic correlation between the microcapsule structure
and the contribution of the Fickian and Case II transport on the drug release process in each
case. This conclusion can be supported with the results reported in table (8 A-C) which
indicate that the overall drug release follows both Zero order kinetics and Higuchi model.
Also from table (14) it can be noticed the alternative effect strength between Fickian
diffusion and polymer chain relaxation i.e. increasing the value of k1 led to decreasing the
value of k2 in all cases except both values (k1&k2) increased in case of products prepared on
using 50% (315-80 µm), 66% TDC (315-80 µm) and decreased in 66% (500-400 µm). At the
same time the products prepared on using 80% TDC it can be noticed the slight decreasing in
the values of k1 with nearly constant values of k2 on decreasing the particle size ranges. These
results can be explained as the following:
Mady O.,reported that the products prepared on using 20% TDC, decreasing the particle size
led increasing the ADC.[19] Since the drug present in solid solution form[21], accordingly it can
be expected the increasing of the Fickian diffusion mechanism in the drug release process
with increasing ADC and decreasing the particle size. Also the presence of special chemical
interacted form between the drug and the polymer in the microcapsules structure which has
particle size range 315-80 µm may be responsible of increasing the value of k2[21] and
decreasing the value of k1 since the polymer used is Eudragit RS100. That is due to the
presence of quaternary amino group by which swelling occurs and any interaction between
the drug and the polymer will lead to increase the polarity and the polymer relaxation. The
same results can be also noticed in case of products prepared on using 33% TDC except
increasing the value of k1 and decreasing the value of k2 in case of particle size range 315-80
µm. That is may be due to the appearance of very minute drug crystal form dispersed in the
microcapsule structure[21].
The similarity of the values of k1 of the product prepared on using 50% TDC (where real drug
crystal appeared in microcapsules structure), k2 of product prepared on using 80% TDC
(where the product mainly drug crystal form), decreasing the value of k1 with decreasing the
particle size of the product prepared on using 80% TDC and the irregular values in the other
cases may be due to the ratio of the drug entrapment forms in the microcapsule structure.[21]
These ratios could be expected to be controlled by the division process of the emulsified
The drug release kinetics of either Zero order kinetic or Higuchi model or both will
controlled by the presence of the drug in solid solution form, solid dispersion form, special
interacted form between the drug and the polymer and crystals dispersed form. This would be
reflected on the values of k1 & k2 i.e. the violent effect of Fickian diffusion and polymer
relaxation mechanism of drug release.
These explanation would be supported with a very interested finding which is, there is a
constant correlation value between Higuchi dissolution rate constant (kH) and Zero order rate
constant (kO) which is equal to 3.5 for the drug release from different particles size
microcapsules prepared by using the same or different TDC (Table 15).
Table (15): The correlation between Higuchi and Zero order rate constant of drug release from the same or different particle size range microcapsules prepared using different or the same TDC.
TDC % PS range K0 KH
kH/kO Ratio
20%
500-400 400-315 315-80
10.694 9.810 9.336
38.006 34.877 32.635
3.554 3.555 3.496
33%
800-500 500-400 315-80
9.169 10.793 10.353
32.812 37.897 36.924
3.579 3.511 3.567
50%
800-500 500-400 315-80
10.493 10.087 9.731
37.037 35.853 34.410
3.530 3.554 3.536
66%
800-500 500-400 315-80
9.888 9.982 9.301
34.945 35.081 32.738
3.534 3.514 3.520
80%
800-500 500-400 315-80
9.690 9.526 9.409
34.582 33.951 33.426
3.569 3.564 3.553
From table 14, it can be noticed the disagreement between (n values) which indicate that the overall drug release mechanism is either anomalous, Case II or Super Case II and the
Peppas-Sahlin constant values (k1&k2) which indicate the drug release mechanism is anomalous one.
The disagreement was consider as failure in case using fixed value of m on using Peppas-Sahlin model or that calculated by using DDSolver software. But this disagreement should be
1. The value of n indicates the overall drug release mechanism which is an additive one for different mechanisms of drug release process[11] (this fact can be also considered in the
other cases of using m values) and it was found the complete agreements between the drug release mechanism determined according the exponent n value and both Higuchi model and Zero order release kinetics.
2. According to table (14), it can be notice that in every case there is a contribution of
Fickian diffusion mechanism and polymer relaxation one in the overall drug release from
all microcapsules prepared on using different TDC and having different particle size.
3. This theoretical data are completely in agreement with the microcapsule structure image
which is concluded as a result of instrumental analysis which indicated the different
method of drug entrapment.
Table 16: Calculation the % of drug released by different mechanisms from Eudragit RS100 microcapsules prepared by using 20% TDC & the calculated (K1&K2) at m = n value by matrix method.
PS µm 500-400 400-315
Time diffusion erosion total(calcu.) total(det.) diffusion erosion total(calcu.) total(det.)
0.5 1 1.5 2 3 4 5 6 7 8 3.45 6.70 9.87 12.99 19.14 25.20 31.20 37.14 43.03 48.89 0.13 0.50 1.08 1.86 4.05 7.02 10.75 15.23 20.45 26.40 3.58 7.19 10.94 14.86 23.19 32.22 41.94 52.37 63.48 75.29 8.49 9.01 10.26 17.11 25.59 41 56.68 63.64 75.99 79.24 5.10 9.58 13.86 18.00 26.04 33.83 41.45 48.93 56.30 63.57 0.09 0.34 0.70 1.18 2.47 4.18 6.27 8.74 11.56 14.75 5.19 9.92 14.56 19.19 28.51 38.01 47.72 57.66 67.86 78.32 8.4 10.01 11.68 13.39 26.79 38.09 53.06 60.44 68.95 74.39
PS µm 315-80
Time diffusion erosion total(calcu.) total(det.)
Table 17: Calculation the % of drug released by different mechanisms from Eudragit RS100 microcapsules prepared by using 33% TDC & the calculated (K1&K2) at m = n value by matrix method.
PS µm 800-500 500-400
Time diffusion erosion total(calcu.) total(det.) diffusion erosion total(calcu.) total(det.)
0.5 1 1.5 2 3 4 5 6 7 8 5.67 10.51 15.08 19.48 27.96 36.13 44.08 51.85 59.49 67.00 0.05 0.17 0.35 0.58 1.19 1.99 2.96 4.09 5.39 6.83 5.71 10.67 15.42 20.06 29.15 38.12 47.03 55.94 64.87 73.84 7.99 10.28 11.9 15.54 28.41 40.7 49.05 59.28 64 71.53 3.43 6.92 10.43 13.96 21.05 28.17 35.32 42.48 49.66 56.85 0.11 0.43 0.97 1.74 3.96 7.10 11.16 16.14 22.06 28.91 3.53 7.35 11.40 15.70 25.01 35.27 46.47 58.62 71.72 85.77 6.48 7.83 10.93 14.07 24.65 35.78 41.6 61.55 78.28 81.13
PS µm 315-80
Time diffusion erosion total(calcu.) total(det.)
0.5 1 1.5 2 3 4 5 6 7 8 4.59 9.35 14.17 19.04 28.86 38.77 48.75 58.78 68.85 78.96 0.01 0.03 0.07 0.12 0.28 0.50 0.79 1.15 1.57 2.07 4.60 9.38 14.24 19.16 29.14 39.27 49.54 59.92 70.42 81.02 5.98 7.79 11.11 18.41 26.94 42.41 45.7 66.19 71.5 77.85
4. The constant correlation between Higuchi constant model and Zero order constant
indicate the role of both mechanisms in the drug release process which is in agreement
with the image of the microcapsule structure. This agreement support the theoretical
calculated finding form application of Peppas-Sahlin equation about the contribution of
Fickian diffusion and polymer chain relaxation mechanisms since the polymer used is
swellable one in the dissolution media used.
On trying to estimate the percent of drug release by different mechanisms at each time
intervals, the amount of drug release % could be calculated using the values of coefficient
constants (k1,k2) which.