ESTIMATION OF IMIDAPRIL HYDROCHLORIDE BY UV - VISIBLE
SPECTROSCOPIC METHOD IN DIFFERENT SOLVENTS
P. Prapulla*, B. Babu, T. Maheshwari, K. Paramesh, G. Swathi and K. Madhavi and K.
Hemamalini1
*Swami Vivekananda Institute of Pharmaceutical Sciences, Vangapally, Yadagirigutta,
Yadadri-Bhongir- 508286, Telangana, India.
1
Principal, Swami Vivekananda Institute of Pharmaceutical Sciences, Vangapally,
Yadagirigutta, Yadadri-Bhongir- 508286, Telangana, India.
ABSTRACT
The objective of the project work was to developed and validated
simple, accurate, rapid, precise, reproducible and cost effective
spectrophotometric method for the quantitative estimation of Imidapril
HCl in different solvents like 0.1N HCl, Distilled water and 0.1N
NaOH in bulk based on measurement of absorption at maximum
wavelength and validated as per ICH guidelines. Imidapril
hydrochloride is a angiotensin-converting enzyme (ACE) inhibitor
with IC50 of 2.6 nM, used for the treatment of hypertension. Imidapril
HCl showed absorption maximum (λmax) in different manner in
different solvents like 0.1N Hydrochloric acid, Distilled Water and
0.1N Sodium Hydroxide Solution at 217 nm, 293 nm, and 236 nm
respectively. The drug exhibited maximum wavelength (nm) in
distilled water, 293 nm when compared with other solvents due to the effect of solvent and
chromophoric group. Thus the conclusion was made that the proposed UV
Spectrophotometric method were found to be simple, rapid, accurate, precise, linear and more
economical method has been developed for the quantitative estimation of imidapril HCl in
bulk. Hence, this method can be successfully and suitably acquired for routine quality control
analysis of imidapril HC in bulk form.
KEYWORDS: Imidapril HCl, Method development, UV Spectrophotometer, Validation.
Volume 7, Issue 10, 572-582. Research Article ISSN 2277– 7105
Article Received on 19 March 2018,
Revised on 16 April 2018, Accepted on 06 May 2018
DOI: 10.20959/wjpr201810-12269
*Corresponding Author
P. Prapulla
Swami Vivekananda
Institute of Pharmaceutical
Sciences, Vangapally,
Yadagirigutta,
Yadadri-Bhongir- 508286,
INTRODUCTION
Ultraviolet spectroscopy is concerned with the study of absorption of UV radiation which
range from 200 to 400 nm. But compounds which are colorless absorb radiation in the UV
region. [1] In both UV as well as visible spectroscopy, only the valence electrons absorb the
energy, there by the molecule undergoes transition from ground state to excited state. This
absorption is characteristic and depends on the mixture nature of electron present. [2] The
intensity of absorption depends on the concentration and path length as given by beer-
Lambert’s law. According to the Beer’s-Lambert’s Law, absorbance is proportional to
concentration, and Absorbance versus concentration plot is a straight line. [3]
The expression of Beer-Lambert law is-
A = log (I0/I) = ECl
Where,
A = absorbance, I0 = intensity of light incident upon sample cell
I = intensity of light leaving sample cell, C = molar concentration of solute
L = length of sample cell (cm.), E = molar absorptivity.
Fig.1: UV-VISIBLE double beam spectrophotometer.
The study makes an attempt to establish sensitive and accurate novel analytical method for
Spectrophotometric estimation of Imidapril Hydrochloride in different solvents in bulk. UV-
VISIBLE Spectrophotometer in different solvents like 0.1N Hydrochloric acid, Distilled
Water and 0.1N Sodium hydroxide solution.[4] The method also validated for various
analytical parameters according to ICH guidelines. To applied the proposed method for the
analysis of drug in their bulk. Imidapril hydrochloride is a angiotensin-converting enzyme
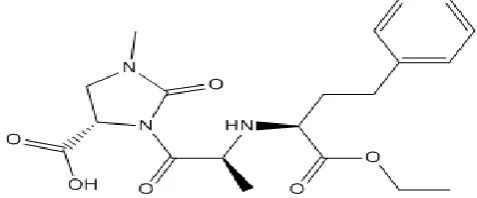
Fig. 2: Chemical structure of Imidapril hydrochloride.
MATERIALS AND METHODS
Instrument
Analytical Technologies double beam spectrophotometer with UV Probe software version 2
was used to develop the analytical method. The above instruments had automatic wavelength
accuracy 0.1 nm and matched quartz cells with 1 cm cell path length, Ultra Sonicator and
Weighing balance (Shimadzu, Japan) were used for this work.
Material
Imidapril hydrochloride was gifted from Aurabindo Pvt Ltd Hyderabad, India. The
commercially available marketed tablets tindamax 500 mg, mankind, India Ltd. were
obtained from the market. Hydrochloric acid, Ethanol, and sodium hydroxide was used as
solvents were obtained from Amul Scientific, India. The Distilled water was used obtained
from Water purification unit.
Method development
Preparation of Standard solution
A spectrum of the working standards was obtained by scanning from 200-400 nm against the
solvent as blank to fix absorption maximum using double beam UV-Visible
spectrophotometer. Here using various solvents like 0.1N Hydrochloric acid, Distilled Water
and 0.1N Sodium hydroxide solution for the estimation of Imidapril hydrochloride. A
Standard stock solution was prepared by accurately weighed 100 mg of Imidapril
hydrochloride in 100 ml of volumetric flask and dissolved in 0.1N HCl to obtain a
concentration 1 mg/1ml or 1000 µg/ml (Standard Stock I). Pipette out 10 ml of stock solution
- I and make up to the volume 100 ml with 0.1N HCl to get desired concentration of 100
µg/ml (Stock II solution). From the stock –II solution prepared various concentrations; the
same procedure repeated with other solvents like Distilled water and 0.1N Sodium hydroxide
Selection of wavelength for analysis of Imidapril hydrochloride
Accurately measured 1.0 ml of standard stock II solution was transferred into 10 ml
volumetric flask and diluted to 10 ml to give concentration of 10 µg/ml and it was used for
initial spectral scan in the UV range of 200-400 nm to detect maximum wavelength and
further dilutions for linearity were prepared from the stock solution by allegation method.[5]
Preparation of serial dilutions
The serial dilutions were prepared from the standard stock II solution to get a respective
concentration of 2, 4, 6, and 8 up to 20 µg/ml.[6]
Method validation
The proposed method was validated for various parameters such as linearity and range,
accuracy, precision, robustness, ruggedness, sensitivity and specificity according to ICH Q2
(R1) guideline and USP guidelines.[4]
Linearity and range
The linearity of an analytical procedure is its ability (within a given range) to obtain test
result which are directly proportional to the concentration of an analyte in the sample. The
range of an analytical procedure is the interval between the upper and lower concentration of
an analyte in the sample for which it has been demonstrated that the analytical procedure has
a suitable level of precision, accuracy and linearity. The linearity of the analytical method
was demonstrated over the concentration range investigated by triplicate analysis (n = 3) at a
concentration range of 2-20 µg/ml. The absorbance obtained at respective concentration was
recorded, and the graph is plotted as concentration (µg/ml) versus absorbance. The linear
regression equation and the coefficient correlation were obtained from the UV probe
software.[9]
Accuracy
The accuracy of an analytical procedure expresses the closeness of agreement between the
value which is accepted either as a conventional true value or an accepted reference value and
the value found. This is sometimes termed trueness. The accuracy of proposed method was
determined on the basis of recovery study. Recovery study was carried out by spiking
standard working solution to sample solution (formulation) at three different levels 80%,
the amount; three determinations were performed. The percentage recovery was calculated as
mean ± standard deviation.[10]
Precision
The precision of an analytical procedure expresses the closeness of agreement (degree of
scatter) between a series of measurements obtained from multiple sampling of the
homogeneous sample under the prescribed conditions. The precision of the method was
demonstrated by intra-day and inter-day variation studies. In the intra-day precision study,
three different solutions of same concentration were prepared and analysed in the same day
(morning, noon and evening), whereas in the inter-day precision study, the solutions of same
concentration were prepared and analysed, for three consecutive days, and the absorbance
were recorded. All study was performed in triplicates. The result was indicated by calculating
percentage RSD.[11]
Robustness
The robustness of an analytical procedure is a measure of its capacity remains unaffected by
small, but deliberate variations in method parameters and provides an indication of its
reliability during normal usage.[12]
Ruggedness
The ruggedness is a degree of reproducibility of test result under verification of condition like
a different analyst, different instruments and different days.[13]
RESULTS AND DISCUSSION
Selection of wavelength
It was concluded that the drug, Imidapril HCl showed absorption maximum (λmax) in different
manner in different solvents like 0.1N Hydrochloric acid, Distilled Water and 0.1N Sodium
Hydroxide Solution at 217 nm, 293 nm, and 236 nm respectively. Therefore the observed
λmax values were used for further work to analyze the test samples. Among the three solvents
0.1N Hydrochloric acid showed greater absorbance, it was 1.099 at the concentration of 20
µg/ml, the maximum absorbance was 217 nm which is due to the effect of solvent like 0.1N
Hydrochloric acid on Imidapril HCl when compared with other solvents like 0.1N Sodium
hydroxide solution, and Distilled water. The lowest absorbance was 0.604 at the wavelength
of 236 nm which is due to the effect of solvent like 0.1N Sodium hydroxide solution; the
water. The drug of Imidapril HCl exhibited different wavelength and absorbance in different
solvents because of the change of chromophoric groups; it is called as the effect of solvent on
absorption maximum of Imidapril HCl.
Fig.3: Absorption maximum (λmax) of Imidapril HCl in pH 1.2 (0.1N HCl-217 nm).
Fig.4: absorption maximum (λmax) of Imidapril HCl in Distilled Water (293 nm).
Linearity and range
The linearity for the developed method was investigated by replicate analysis (n=3) at seven
concentration levels (2-20 µg/ml) of reference standard Imidapril HCl. The absorbance
obtained at respective concentration was recorded and graph was plotted shows good linear
correlation coefficient from the UV probe software. The linearity was shown in table 1, 2,
and 3 and fig. 6, 7 and 8.
Table.1: Standard calibration curve of Imidapril HCl in 0.1N HCl.
Flask No.
Volume of Stock-II (ml)
Volume made up to (ml)
Concentration (µg/ml)
Absorbance at 217 nm
1 0.2 10 2 0.149
2 0.4 10 4 0.261
3 0.6 10 6 0.373
4 0.8 10 8 0.476
5 1.0 10 10 0.591
6 1.2 10 12 0.689
7 1.4 10 14 0.781
8 1.6 10 16 0.891
9 1.8 10 18 0.991
10 2.0 10 20 1.099
Fig.6: Standard calibration curve of Imidapril HCl in 0.1 N HCl.
Table.2: Data of Standard graph of Imidapril HCl in Distilled water at 319 nm.
Flask no
Volume of Stock-II (ml)
Volume made up to (ml)
Concentration (µg/ml)
Absorbance at 319 nm
1 0.2 10 2 0.036
2 0.4 10 4 0.109
3 0.6 10 6 0.175
4 0.8 10 8 0.252
5 1.0 10 10 0.324
6 1.2 10 12 0.398
8 1.6 10 16 0.523
9 1.8 10 18 0.599
10 2.0 10 20 0.678
Fig.7: Standard graph of Imidapril HCl in distilled water at 319 nm.
Table.3: Data of Standard graph of Imidapril HCl in 0.1N NaOH at 236 nm.
Flask no
Volume of Stock-II (ml)
Volume made up to (ml)
Concentration (µg/ml)
Absorbance At 236 nm
1 0.2 10 2 0.04
2 0.4 10 4 0.091
3 0.6 10 6 0.161
4 0.8 10 8 0.215
5 1.0 10 10 0.282
6 1.2 10 12 0.351
7 1.4 10 14 0.397
8 1.6 10 16 0.453
9 1.8 10 18 0.525
10 2.0 10 20 0.604
Method precision
The precision of proposed method was determined by Intra-day and Inter-day precision, and
it was expressed in terms of percent relative standard deviation (% RSD). For Inter-day and
Intra-day percentage RSD were found in the range of 0.048 at 4 µg/ml, 0.036 at 8 µg/ml and
0.070 at 4 µg/ml, 0.052 at 8 µg/ml respectively as shown in table 4.
Table.4: Determination of Precision.
Amount taken (µg/ml)
Intraday precision Inter day precision
Amount found % RSD* Amount found % RSD*
4 3.99 0.070 3.95 0.048
4 3.96 0.070 3.92 0.048
4 3.97 0.070 3.93 0.048
8 7.98 0.052 7.96 0.036
8 7.96 0.052 7.94 0.036
8 7.98 0.052 7.95 0.036
*RSD: Relative standard deviation
Table.5: Summary of analytical parameters of Imidapril HCl in different solvents.
Parameter 0.1N HCl* Distilled Water 0.1N NaOH*
Absorption maximum (λmax) nm* 217 293 236
Beer’s range (µg/ml) 2-20 2-20 2-20
Correlation co-efficient (R2) 0.998 0.998 0.997
Regression y = 0.053x
+ 0.037
y = 0.034x + 0.022
y = 0.030x + 0.018
Intercept 0.037 0.022 0.018
Slope (m) 0.053 0.034 0.030
*HCl- Hydrochloric Acid, *NaOH- Sodium Hydroxide, *nm- Nano meter
CONCLUSION
The drug of Imidapril HCl exhibited different wavelength and absorbance in different
solvents because of the change of chromophoric groups; it is called as the effect of solvent on
absorption maximum of Imidapril HCl. Thus the conclusion was made that the proposed UV
Spectrophotometric method were found to be simple, rapid, accurate, precise, linear and more
economical method has been developed for the quantitative estimation of Imidapril HCl in
bulk. The method is validated as per the ICH guidelines, and it is found that the developed
method is robust and sensitive. Hence, this method can be successfully and suitably acquired
ACKNOWLEDGEMENT
We express our sincere thanks to Aurabindo Pvt Ltd Hyderabad, India. For providing gift
sample of drug. We also express our gratitude to the Principal, Management of Swami
Vivekananda Institute of Pharmaceutical Sciences, Vangapally, Yadagirigutta,
Yadadri-Bhuvanagiri-508286, Telangana, India, for providing all facilities during the study.
REFERENCES
1. Beckett A. H. and Stenlake J. B., 4th Edt, “Practical Pharmaceutical Chemistry”, vol. 2,
CBS, NewDelhi, India, 1997; 67-70.
2. Skoog et al., 5th edition “Principles of instrumental analysis”, 7, 13.
3. Chatwal GR, and Anand SK. Instrumental Methods of Chemical Analysis. 5th Revised
and Enlarged ed., Himalaya Publication House, Mumbai, 2002; 2: 630.
4. International Conference on Harmonization (ICH), Q2A. “Validation of Analytical
Procedures: Methodology”. Geneva, 1994.
5. Lopez Nigro MM, Carballo MA: “Genotoxicity and cell death induced by Tinidazole”
(TNZ). Toxicological Letters, 2008; 30(1): 46-52.
6. Shah U., Kavad M., and Raval M., “Development and Validation of UV
spectrophotometric method for estimation of paracetamol and flupirtine maleate in bulk
and pharmaceutical dosage form,” International journal of Pharmaceutical Technology
and Research, 2013; 5(3): 1007–1113.
7. Matsyagiri Lenkalapally, Kiran Kumar Vangala, Santoshi Takkadapalliwar, Saritha
Bandapalli, Pranathi Pasham, “Spectrophotometric Method for the Estimation of Abacavir Sulphate in Bulk and Pharmaceutical Dosage Forms in Different Solvents”
Vedic Research International- Phytomedicine, 2013; 1(3): 64-68.
8. Tripathi KD. 6th Edt, “Drugs for Central Nervous System, Essentials of Medical
Pharmacology”. New Delhi: Jaypee, 2013; 485.
9. Selvakumar S, Ravichandran S, Matsyagiri L. “Development and Validation of analytical
method for Simultaneous estimation of Ornidazole and Cefixime trihydrate tablet dosage
forms by UV spectroscopy”. Asian Journal of Pharmaceutical Analysis, 2016; 6(4):
246-252.
10.Arti Mohanr and S.K.Ghosh, “Development and Validation of UV/Visible
Spectrophotometric Method for the Estimation of Lamotrigine in Bulk and
Pharmaceutical Formulations” American Journal of Phytomedical and Clinical
11.Kamala kannan D., Jambulingam M., Ananda Thangadurai S., Dhanam S., Jeyanthi R.,
Parvin banu M., Vasanthi M., Vinodha Rashini J. and Haritha siva Ganga Lakshmi D.
“New simple spectrophotometric estimation of clobetasol propionate in bulk and pharmaceutical dosahe form”, Der Pharmacia Letters, 2014; 6(4): 52-57.
12.Lakshmana Rao A., P.S.R.CH.N.P. Varma D and S.C. Dinda, “Simultaneous
determination of metformin and vildagliptin in solid dosage form by stability indicating
RP-HPLC Method” International Research Journal of Pharmacy, 2013; 4(1): 122-128.
13.Nityanand Zadbuke, Sadhana Shahi, Ajit Jadhav, Santosh Borde “Development and
validation of uv-visible spectroscopic method for estimation of carbamazepine in bulk
and tablet dosage form” International Journal of Pharmacy and Pharmaceutical