SUSCEPTIBILITY PATTERN OF
SALMONELLA TYPHI C
AUSING
ENTERIC FEVER TOWARDS DIFFERENT ANTIMICROBIALS
Pradeep Paudel*, Deepa Dhungana, Sukriti Ghimire and Bhumika Khatri
Department of Pharmacy National Model College for Advance Learning, Tribhuvan University, NEPAL.
ABSTRACT
Resistant to therapeutic regimen of enteric fever is a global problem.
Such a resistance has led to treatment failure of Enteric fever. Therefore, it is necessary to study the sensitivity and resistance pattern of the drugs used in Enteric fever. This study was conducted to determine the susceptibility pattern of Salmonella Typhi causing
enteric fever towards different antimicrobials. In this study, out of 145 isolates, 108 were confirmed to be S. Typhi by different Gram’s staining and along with different biochemical tests. In this study, S. Typhi was tested for 5 antibiotics i.e. Ciprofloxacin, Ofloxacin,
Levofloxacin, Ceftriaxone and Chloramphenicol. This study showed the highest sensitivity for Chloramphenicol (97.22%), Ceftriaxone (79.62%), levofloxacin (68.51%), Ofloxacin (50.92%) and
Ciprofloxacin (2.77%). Ciprofloxacin was the most resistant drug against S. Typhi. A total of 19 isolates were found to be multi drug resistant isolates (MDR). The MIC value for ciprofloxacin ranged from 55µg/ml to 100µg/ml. Among the 10 isolates, all the isolates were resistant to Ciprofloxacin (MIC ≤1µg/ml). The MIC value ranged from 12.5µg/ml to
100µg/ml for ofloxacin. All the 10 isolates were resistant to Ofloxacin as CLSI standard (≤2µg/ml). MIC for Ceftriaxone was found to be 25µg/ml. Three out of ten isolates were
found to be sensitive, 5 were intermediate and 2 isolates showed resistant MIC value(<8µg/ml sensitive). Resistance to most antibiotics is a major problem worldwide and is becoming a challenge to treat the infections. Hence, antibiotic susceptibility should be done periodically to provide the rational treatment of enteric fever.
KEYWORDS: Sensitivity, Fluroquinolones, Ceftriaxone, Chloramphenicol, MIC.
Volume 4, Issue 5, 1140-1167. Research Article ISSN 2277– 7105
Article Received on 22 Feb 2015,
Revised on 13 March 2015, Accepted on 05 April 2015
*Correspondence for Author
Pradeep Paudel
Department of Pharmacy
National Model College
for Advance Learning,
Tribhuvan University,
INTRODUCTION
Enteric fever is an important public health problem in developing countries including Nepal. A changing antibiotic susceptibility pattern of Salmonella Typhi and emergence of multi drug resistance has increased to a great concern. Enteric fever is a systemic infection caused
by the human‐adapted pathogens Salmonella Typhi and Salmonella Paratyphi A, B, and C. These organisms are important causes of febrile illness in crowded and impoverished populations with inadequate sanitation that are exposed to unsafe water and food (Whitaker et al., 2009). Salmonella Typhi is the gram-negative enteric bacillus belonging to the family Enterobacteriaceae. It is a motile, obligate, facultative anaerobe (Denyer et al., 2008).
Multidrug-resistant S. Typhi (MDRST) is epidemiologically defined as strains resistant to any two antimicrobials in vitro even if the antimicrobials tested are known to be clinically ineffective. A more useful definition of MDRST is reserved for strains of S. Typhi resistant to all three first-line antityphoidal antimicrobial agents, namely ampicillin, chloramphenicol, and trimethoprim-sulphamethoxazole (Khanal et al., 2007).
Traditional drugs such as chloramphenicol, ampicillin and co‐trimoxazole were the most effectively used first line drugs for the treatment of enteric fever. However, during the late
1980s and early 1990s the occurrence of multidrug‐resistant (MDR) S. Typhi strains resistant to chloramphenicol, ampicillin and co‐trimoxazole, led to the use of fluroquinolones,
particularly ciprofloxacin and third generation cephalosporin for the treatment of enteric fever (Adhikari et al., 2012).
The quinolones used in therapy of enteric fever are ciprofloxacin, levofloxacin and ofloxacin. Extendedspectrum cephalosporin, such as cefipime, cefpodoximeproxetil, ceftriaxone and cefixime, have shown promise as therapies for the treatment of enteric fever. Resistance is also emerging to extended-spectrum cephalosporin: ceftriaxone, cefixime, cefipime (Capoor and Nair, 2010).
patterns reported for S.Typhi, it is important to constantly monitor it so as to provide suitable guidelines for treatment(Madhulika et al., 2004).
Enteric fever, a systemic infection caused by the bacteria Salmonella Typhi and Salmonella Paratyphi A, is endemic in Kathmandu, Nepal. Kathmandu, the capital city of Nepal, has been previously coined an enteric fever capital of the world. Several studies have poignantly emphasized the significant burden of enteric fever within the local population and in travellers visiting the area. The population of Kathmandu is increasing and available figures suggest that enteric fever caused by S.Typhi show no significant signs of decreasing (Karkey et al., 2008).
Improved understanding of the pathogenesis, immune control and microbiology of S. Typhi infection can help accelerate the development of improved vaccines and diagnostic tests necessary for disease control (Hohmann et al., 2010).
Antibiotics are the most prescribing medicines to wide variety of diseases. Hence irrational use of antibiotic leads to resistance day by day. Multiple-drug resistance occurs when bacteria are resistant to more than one antibiotic. This is generally the rule rather than the exception among resistant bacteria. This situation has largely occurred through the sequential use of multiple different antibiotics. The first antibiotic began by selecting a single resistance gene. Eventually, however, bacteria resistant to the first antibiotic picked up resistance to others as they were introduced into the environment. Antibiotics are used tremendously without any microbiological evidences of suspected organisms; hence antibiotic resistance is increasing day by day. Hence, susceptibility pattern of is necessary for better therapy of the infectious diseases.
importance for the treatment of enteric fever in recent years. Now, different studies showed the reduced susceptibility to fluoroquinolones. Now this is seen in third generation cephalosporin also. Antibiotic-resistant strains of S.Typhi are becoming prevalent throughout the world; this has resulted in modifications of treatment approaches. Therefore, considering all these problems, this study is carried out to find the susceptibility pattern of clinical isolates of S. Typhi against antimicrobials.
METHODS AND METHODOLOGY METHODS
This study was conducted at National Model College for Advanced Learning (NMCAL) Microbiology Labotarory, Kathmandu from 2070/2/12 to 2070/7/11. A total of 145 samples were collected from Kathmandu Model Hospital, Bagbazaar and 108 clinical isolates were identified for Salmonella Typhi in our laboratory.
ANTIBIOTIC SUSCEPTIBILITY TESTING
The antimicrobial susceptibility testing of the isolates towards various antimicrobial discs was done by modified Kirby- Bauer disc diffusion method as recommended by Clinical and Laboratory Standards Institute (CLSI) using Mueller Hinton Agar (MHA).
Using a sterile loop a single isolated colony of which the sensitivity to be determined was touched and inoculated into nutrient broth tube and incubated at 37°C for 4 hours. After incubation, the turbidity of the suspension was matched with the turbidity standards of Mc-Farland No. 0.5.
Using sterile swab, a plate of Mueller Hinton Agar was inoculated with the bacterial suspension using carpet culture technique. The plate was left for about 5 minutes to let inoculums to dry. Using sterile forceps, appropriate antimicrobial discs 6mm diameter was placed on the inoculated plates. After overnight incubation, the diameter of each zone of inhibition in mm was measured and results were compared with the standard zone interpretative chart provided by company. The organisms showing resistant to two and more two groups of antibiotics were taken as Multi drug resistant isolates.
2.4 DATA ANALYSIS
FLOW CHART OF METHODOLOGY
Clinical isolates of Salmonella Typhi Subculture in nutrient agar and incubated at 37οC Gram staining and Biochemical tests for verification Antibiotic susceptibility test on MHA by Kirby Bauer technique
Determination of zone of inhibition
MIC determination of isolates by Tube dilution method
RESULT
IDENTIFICATION OF ISOLATES
Out of 145 clinical isolates, 108 of them were confirmed to be S.Typhi using Gram’s staining along with different biochemical tests such as catalase, oxidase, Triple Sugar Iron Agar (TSIA), urease, citrate, Sulphide, Indole, Motility (SIM), Methyl Red (MR), Voges-Proskauer (VP). For S.Typhi the confirmatory tests were obtained as below.
Gram stain: Gram –ve Catalase test: +ve Oxidase test: -ve
Triple Sugar Agar (TSIA : Alk/Acid Gas: -ve
Urease: -ve Citrate test: -ve Sulphide: +ve Indole test: -ve Motility: motile Methyl Red (MR): +ve
Voges-Proskauer (VP) test: -ve O/F: Fermentative
ANTIBIOTIC SUSCEPTIBILITY PATTERN
DISC DIFFUSION ZONE DIAMETER
The sensitivity pattern of the organism obtained by disc diffusion method for each of the antibiotics is interpreted sensitive or resistant as per Zone interpretative chart. Out of the 5 antimicrobials tested for the S.Typhi isolates using disc diffusion method, Chloramphenicol Showed the highest sensitivity profile. Chloramphenicol showed the 97.22% sensit ive, 0.925% intermediate and 1.85% resistance pattern against S.Typhi whereas Ceftriaxone showed the 79.62% sensitive, 12.03% intermediate and 8.33% resistance pattern. Similarly, levofloxacin showed the 68.51% sensitive, 28.70% intermediate and 2.77% resistance pattern followed by Ofloxacin showed the 50.92% sensitive, 38.88% intermediate and 10.18% resistance pattern. However, Ciprofloxacin was found to be most resistant drug. Only 2.77% of organism was sensitive towards ciprofloxacin, 28.70% were intermediate and 68.51% was
resistant
MDR ISOLATES OF Salmonella Typhi
Out of 108 isolates of S.Typhi, 18 isolates were resistant to 2 groups of drugs and only 1 isolate was resistant to 3 groups of drugs .Therefore those isolates that are resistant to 2 or more groups of drugs were MDR isolates of Salmonella Typhi. Therefore, a total of 19 isolates of Salmonella Typhi were found be Multi drug reistant isolates (MDR).
Minimum Inhibitory Concentration
Minimum Inhibitory Concentration values were determined by broth dilution method for the
10 randomly selected isolates for three antibiotics, (Ceftriaxone, Ciprofloxacin and Ofloxacin). The isolates were interpreted as resistant or sensitive as per CLSI guidelines. Among the 10 isolates, 3 isolates are sensitive to ceftriaxone according to CLSI standard MIC value of Ceftriaxone ≤8 µg/ml and were classified as sensitive, 5 were intermediate
compared to CLSI MIC value 16-32 µg/ml which was classified as resistant and 2 were resistant compared to CLSI standard ≥32 µg/ml (Figure: 2).
For Ciprofloxacin, among 10 isolates all had their MIC value >4µg/ml; hence none of them were sensitive according to CLSI guidelines. MIC value of Ciprofloxacin was ≥4 µg/ml was
classified as resistant (Figure: 2).
For Ofloxacin, among 10 isolates all had their MIC value ≥8µg /ml; hence none of them were sensitive according to CLSI guidelines. MIC value of was≥8 µg/ml for all 10 isolates and was
MIC distribution by scatter plot Scatterplot diagram for ciprofloxacin
Among the 10 isolates, 3 had MIC value of 100µg/ml for ciprofloxacin, 3 had 55µg/ml, 1 had 25µg/ml, 1 had 12.5µg/ml and 1 had 3.125µg/ml. Here, most of the isolates scatter in the range 55µg/ml to 100µg/ml.
Scatterplot diagram for Ofloxacin
Among the 10 isolates, 8 had MIC value of 25µg/ml for Ofloxacin and 2 had 12.5µg/ml. In this plot, most isolates were scatter in the range 25µg/ml.
Scatter diagram for Ceftraixone
Among the 10 isolates, 1 had MIC value of 100µg/ml for ceftriaxone ,1 had 50µg/ml,4 had 25µg/ml, 2 had 12.5µg/ml, 1 had 6.125µg/ml. In this plot, most isolates distribute in the range 25µg/ml.
APPENDIX-I
Gram Staining reaction
Sample no. Grams’ reaction
Biochemical test Sample
no.
Catalase Oxidase O/ F
SIM
M R
V P
Citrat e
Ureas e
TSIA S I M
[O/F= Oxidative/Fermentative, SIM= Sulphide(S), Indole(I), Motility(M), MR= Methyl Red, VP= Voges-Proskauer, TSIA= Triple Sugar Iron Agar
Antimicrobial susceptibility testing Worksheet
Note: S=Susceptible, I= Intermediate, R= Resistance Organis
m Code
Reference Zone of diameter (mm) Observed Zone of diameter (mm)
Details of the Antibiotic Susceptibility Testing:
S.N. Organism
code CTR C CIP OF LE
1 A1 31 30 15 16 18
2 A2 31 30 21 20 20
3 A3 25 30 23 24 25
4 A4 28 30 15 16 29
5 A5 20 28 14 15 -
6 A6 34 33 15 15 17
7 A7 30 32 15 15 19
8 A9 32 30 22 23 22
9 A11 26 30 15 15 11
10 A12 30 34 15 15 20
11 A13 34 27 12 14 15
12 A14 26 27 22 21 23
13 A15 20 26 19 21 26
14 A16 29 28 15 16 17
15 A17 26 27 24 22 26
16 A18 25 31 16 14 17
17 A19 26 27 26 22 25
18 A20 34 32 16 15 19
19 A21 26 30 18 18 22
20 A22 25 30 14 14 18
21 A23 25 33 32 31 29
22 A24 31 27 15 15 16
23 A25 26 27 13 13 17
24 A26 23 30 13 14 19
25 A27 24 26 13 20 21
26 A28 25 29 20 13 16
27 A29 15 29 14 11 16
28 A30 20 26 19 21 21
29 A31 19 29 11 14 15
30 A33 20 26 12 12 15
31 A36 25 24 14 13 16
32 A37 26 - 23 19 21
33 A38 23 26 13 13 16
34 A39 22 20 13 12 16
35 A40 26 29 14 19 17
36 A41 20 21 20 18 19
37 A42 21 26 13 12 16
38 A43 20 32 14 12 15
39 A45 24 24 13 12 14
40 A46 28 25 22 19 22
41 A48 27 27 14 13 16
42 A49 24 28 15 14 18
44 A51 19 25 13 12 16
45 A52 - 26 23 24 25
46 A54 - - 10 - 9
47 A56 25 27 13 14 16
48 A58 25 30 18 14 17
49 A59 25 23 24 22 22
50 A60 26 29 18 14 19
51 A61 26 26 26 20 23
52 A63 29 25 16 12 15
53 A64 31 32 17 15 17
54 A65 20 22 15 12 15
55 A66 24 31 25 21 22
56 A67 25 25 24 19 21
57 A68 23 23 22 21 20
58 A69 25 21 13 18 16
59 A72 25 30 25 20 23
60 A78 26 27 23 22 23
61 A79 25 30 16 14 18
62 A82 26 25 24 19 21
63 A84 23 30 25 21 22
64 A86 25 30 25 21 18
65 A91 26 22 23 19 19
66 A94 26 29 24 22 25
67 A96 24 32 25 18 24
68 A97 27 30 22 20 21
69 A98 28 25 20 22 22
70 A100 22 27 25 19 23
71 A101 23 26 25 17 18
72 A102 25 25 26 24 22
73 A103 26 22 19 14 15
74 A104 21 24 31 19 20
75 A105 25 29 25 20 18
76 A106 30 30 32 15 16
77 A107 26 33 27 22 19
78 A108 40 35 20 19 20
79 A109 28 30 20 17 19
80 A111 29 30 19 16 19
81 A112 24 30 18 18 19
82 A113 25 20 20 19 18
83 A114 28 30 20 18 20
84 A115 30 31 19 18 23
85 A116 20 27 16 13 16
86 A117 29 29 16 14 16
87 A118 38 39 26 22 24
88 A119 31 30 20 15 18
89 A121 32 30 20 16 22
90 A122 25 26 15 12 14
CTR- Ceftriaxone, C- Chloramphenicol, CIP- Ciprofloxacin, OF- Ofloxacin, LE- Levofloxacin
Guidelines of Antimicrobial Susceptibility Testing
Inhibition zone diameter size interpretive standards with equivalent MIC breakpoint for Salmonella Typhi by CLSI (2012) interpretation chart.
APPENDIX-II Working Procedure
Gram-Staining Procedure
First derived by Hans Christian Gram ring the late 19th century, the Gram-stain can be used effectively to divide all bacterial species into large groups: those that take the basic dye,
92 A124 23 25 15 13 16
93 A125 30 28 16 13 16
94 A126 25 23 15 13 21
95 A127 24 30 16 14 16
96 A128 13 21 16 14 17
97 A131 32 31 17 15 18
98 A133 20 30 19 16 18
99 A134 30 30 16 15 16
100 A135 28 29 15 13 16
101 A136 29 28 17 14 16
102 A139 30 15 30 13 15
103 A140 30 30 25 27 24
104 A141 10 19 20 22 24
105 A142 30 30 19 15 19
106 A143 26 25 16 14 15
107 A144 28 28 18 15 19
108 A145 19 29 19 15 19
Antimicrobial agent (Disc potency)
Diameter of zone of inhibition(mm) and Antimicrobial disc equivalent MIC break
point (µg/ml)
Susceptible Intermediate Resistant Chloramphenicol(30µg) (≤8 µg/ml) ≥18mm 13-17mm
(16 µg/ml)
≤12mm (≥32 µg/ml)
Ciprofloxacin (30µg) ≥31mm (≤1 µg/ml)
21-30mm 2 µg/ml
≤20mm (≥4 µg/ml)
Levofloxacin (5µg) ≥17mm (≤2 µg/ml)
14-16mm (4µg/ml)
≤13mm (≥8 µg/ml)
Ofloxacin (5µg) ≥16mm
(≤2 µg/ml)
13-15mm (4 µg/ml)
≤12mm (≥8 µg/ml)
Ceftriaxone(30µg) ≥23mm (< 8µg/ml)
20-22mm (16-32µg/ml)
crystal violet (Gram-positive) and those that allows the crystal dye to was out easily with the de-colorizer alcohol or acetone (negative). The following steps are involved in Gram-stain.
A thin film of the materials to be examined was prepared and dried.
The material on the slide was heat fixed and allowed to cool before staining.
The slide was flooded with crystal violet stain and allowed to remain without drying for 1
minute.
The slide was rinsed with tap water, shaking off excess.
The slide was flooded with iodine solution and allowed to remain on the surface without
drying for twice as long as the crystal violet was in contact with the slide surface. The slide was rinsed with tap water, shaking off excess.
The slide was flooded with alcohol acetone de-colorizer for 10 seconds and rinsed
immediately with tap water until no further color flows from the slide with the de-colorizer. Thicker smear requires more aggressive decolorizing.
The slide was flooded with counter-stain (safranine) for 1 minute and washed off with tap
water.
The slide was blotted between two clean sheets of bibulous paper and examined microscopically under oil immersion at 100X.
Antibiotic susceptibility testing by disc diffusion method Principle
Standardized inoculum of bacteria is swabbed onto the surface of a Mueller Hinton agar (MHA) plate. Filter paper disc impregnated with antimicrobial agents are placed on the agar. After overnight incubation, the diameter of the zone of inhibition is measured around each disc. By referring to the tables in the CLSI disc diffusion standard, a qualitative report of
susceptible, intermediate or resistant is obtained.
Procedure
Bring agar plates and discs to room temperature before use. Agar plates may be removed from refrigerator and placed in 35˚C ambient air incubator with lids slightly ajar to
Using a loop or swab, transfer colonies as follows
Direct colony suspension method: pick several colonies from a fresh (18-24 hr.)
nonselective agar plate to broth or 0.9% NaCl.
Log phase method.
Pick four or five isolated colonies to 3.0 to 5.0 ml of nutrient broth.
Incubate at 35˚C for 2 to 8 hr. until growth reaches the turbidity at or above that of a 0.5
McFarland standards.
For either the log phase or direct colony suspension method, vortex well and adjust
turbidity visually with sterile broth or 0.9% NaCl to match a 0.5% McFarland standard.
Inoculation of agar plates
Within 15 minutes of adjusting turbidity, dip a sterile cotton swab into the inoculums and
rotate against the wall of the tube above the liquid to remove excess inoculums.
Swab entire surface of agar plate three times, rotating plates approximately 60˚ between
streaking to ensure even distribution. Avoid hitting the slides of the plate to avoid aerosols. Finally, run swab around the edge of the agar to remove any excess moisture.
Allow inoculated plate to stand for 3-15 minutes before applying discs.
Application of discs
Apply disc to agar surface with dispenser or manually with sterile forceps.
Apply gentle pressure with sterile forceps or needle to ensure complete contact of disc
with agar.
Do not place discs closer the 24mm from center to center (no more than 12 discs on 150
mm plates and 5 discs on 100 mm plates.
Do not relocate disc once it has made contact with agar surface. Instead place a new disc
in another location on the agar.
Incubation
Invert plates and incubate within 15 minutes of disc application.
Incubate for 16 to 18 hours at 35˚C in an ambient air incubator.
Reading plates
Hold inverted plate a few inches above a black nonreflecting surface.
Illuminate plate with reflected light.
Use a sliding caliper or ruler held on the back of the plate to measure the diameter of
inhibition zone to nearest whole millimeter.
Discrete colonies growing within the inhibition zone may represent a mixed culture or
resistant variants; subculture single colonies from the primary culture plate, and re-test for susceptibility. If the discrete colonies are still apparent, measure the colony- free inner zone.
Interpretation and Reporting
Use criteria specified by the Zone Interpretation Chart to interpret the zone of inhibition for
each antimicrobial agents and report categorical result as either susceptible (S), intermediate (I), or resistant (R).
Precautions
The following sources of error should be investigated to verify that Zone diameters were measured and transcribed correctly;
The turbidity standard has not expired, is stored properly, meets performance
requirements, and was adequately mixed prior to use;
All materials used were within their expiration dates and stored at the proper temperature; The incubator is at proper temperature and atmosphere;
Other equipment’s used (e.g., pipettes) are functioning properly; Discs were stored desiccated and at proper temperature;
Inoculums suspensions were prepared and adjusted correctly; and inoculum for the test
was prepared from a plate incubated for the correct length of time and in no case more than 24 hours old.
Determination of MIC by broth dilution method Principle
Procedure
Preparation of antibiotic stock solutions and dilution range.
Suitable range of antibiotic concentrations was chosen for the organisms to be tested.
Preparation of Inoculum
The inoculum should be adjusted so that it contains 107 and 108cfu/ml. The following procedure describes a method for preparing the desired inoculums by comparison with a 0.5 McFarland standard.
Preparation of the McFarland standard
0.5 ml of 0.048 M BaCl2 (1.17% w/v BaCl2.2H2O) was added to 99.5ml of 0.18 M H2SO4 (1%v/v) with constant stirring. The standard was then distributed into cap tubes of the same
size and with the same volume. The tubes were sealed tightly to prevent loss by evaporation and were stored protected from light at room temperature. The standard was vigorously agitated before use.
Preparation of inoculum
At least four morphologically similar colonies are touched with a sterile loop. It was then transferred to the 2ml nutrient broth with constant shaking and incubated at 35-37˚C for about
2 hours. The turbidity was then compared to the O.5 McFarland standard.
Adjustment of the organism suspension to the density of the McFarland standards
The density of the organism suspension prepared was adjusted to equal that of the 0.5 McFarland standards by sterile distilled water. To aid comparison, the test and standard was compared against a white background with a contrasting black line. Suspensions should contain between 107 and 108cfu/ml.
Preparation of broth dilution tubes
Eleven capped tubes of the same size each containing 2ml nutrient broth were arranged
for each antibiotic.
Two tubes served as a control- negative control and positive control. Remaining was
coded with their numbers.
2ml volumes of each antibiotic dilution were transferred to the tubes except positive
Inoculation
50µL of the prepared inoculums equivalent to a 0.5 McFarland standard were added to
the tubes except negative control. The contents of the tubes were mixed thoroughly.
Incubation conditions
The tubes were incubated at 35-37˚C for 18-20 hour.
Reading and interpretation
The MIC endpoint was read as the lowest concentration of antibiotic at which there is no visible growth.
Precautions
The incubator is at proper temperature and atmosphere.
Inoculum suspensions were prepared and adjusted properly.
All the materials used were within their expiration dates and stored at the proper
temperature.
APPENDIX-III
Methodology of biochemical tests used for identifications of bacteria Catalase Test
This test is performed to demonstrate the presence of catalase, an enzyme that catalyses the release of oxygen from hydrogen peroxide. During aerobic respiration, in the presence of oxygen, microorganisms produce hydrogen peroxide, which is lethal to the cell itself. The enzyme catalase is present in most cytochrome containing aerobic and facultative anaerobic bacteria, the main exception being Streptococcus spp.
Procedure: A small amount of a culture from Nutrient Agar plate was taken in a clean glass slide and about 2-3 drops of 3% H2O2 was put on the surface of the slide. The positive test in indicated by the formation of active bubbling of the oxygen gas. A false positive reaction may be obtained if the culture medium contains catalase (e.g. Blood Agar) or if an iron wire
loop is used.
Oxidase Test
Tetramethyl-p-phenylenediamine dihydrochloride, the cytochrome oxidase oxidizes it into a deep purple colored end product Indophenol which is detected in the test. The test is used for screening species of Neisseria, Alcalignenes, Aeromonas, Vibra, Campylobacter and Pseudomonas which give positive reactions and for excluding the Enterobacteriaceae, all species of which give negative reactions.
Procedure: A piece of filter paper was soaked with few drops of oxidase reagent (Whatman’s No. 1 filter paper impregnated with 1%
tetramethyl-p-phenylenediaminedihydrochloride). Then the colony of the test organism was smeared on the filter paper. The positive test is indicated by the appearance of blue-purple color within 10 seconds.
Indole Production test
This test detects the ability of the organism to produce an enzyme: ‘tryptophanase’ which oxidizes tryptophan to form indolic metabolites: indole, skatole (methyl indole) and indole acetic acid. The enzyme tryptophanase catalyses the deamination reaction attacking the tryptophan molecule in its side chain and leaving the aromatic ring intact in the form of indole.
Procedure: A smooth bacterial colony was stabbed on SIM (SulphideIndole Motility) medium by a sterile stab wire and the inoculated media was incubated at 37oC for 24 hours. After 24 hours incubation, 2-3 drops of Kovac’s reagent was added. Appearance of red color
on the top of media indicated indole positive. Indole if present combines with the aldehyde present in the reagent to give a red color in the alcohol layer. The color reaction is based on the presence of the pyrrole structure present in indole.
Methyl Red test
This test is performed to test the ability of an organism to produce and maintains stable acid end product from the fermentation of glucose to give a red color with the indicator methyl red and to overcome the buffering capacity of the system. Medium used in the study was Clark and Lubs medium (MR/VP broth, pH 6.9). Methyl red is an indicator which is already acid and will denote changes in degree of acidity by color reactions over a pH range of 4.4 – 6.0
was added and mixed well. The positive test was indicated by the development of bright red color, indicating acidity and negative yellow color.
Voges-Proskauer (VP) test
The principle of this test is to determine the ability of some organisms to produce acetyl methyl carbinol, a neutral end product (acetoin) or its reduction product 2, 3 – butanidiol during fermentation of carbohydrates. An organism of the Enterobacteriacease group is usually either methyl red positive and Voges- proskauser- negative or methyl red negative and Voges- Proskauer positive. The Vogesproskauer test for acetoin is need primarily E. coli from Klebsiella and Enterrobacter species.
Procedure: A pure colony of the test organism was inoculated into 2 ml of MRVP medium and was incubated at 37oC for 24 hours. After incubation, about 5 drops of barritt’s reagent was added and shaken well for maximum aeration and kept for 15 minutes, positive test is indicated by the development of pink red color.
Citrate Utilization test
This test is performed to detect an organism utilizes citrate as a sole source of carbon for metabolism with resulting alkalinity. The medium used for citrate fermentation (Simmon’s
Citrate medium) also contains inorganic ammonium salts. organisms capable of utilizing citrate as its sole carbon source also utilizes the ammonium salts present in the medium as its sole nitrogen source, the ammonium salts are broken down to ammonia with resulting alkalinity.
Procedure: A loopful of test organism was streaked on the slant area of Simmon’s Citrate Agar medium and incubated at 37oC for 24 hours. A positive test was indicated by the growth of organism and change of media by green to blue, due to alkaline reaction. The pH indicator
Bromothymol blue has a pH range of 6.0 – 7.6, i.e. above pH 7.6; a blue color develops due to alkalinity of the medium.
Motility test
Procedure: Motility of organism was tested by hanging drop and cultured method. In cultural method, the test organism was stabbed in the SIM medium and incubated at 37oC for 48 hours. Motile organisms migrate from the stab line and diffuse into the medium causing turbidity. Whereas non-motile bacteria show the growth along the stab line, and the surrounding media remains colorless and clear.
Triple Sugar Iron(TSI) Agar Test
The TSI agar is used to determine the ability of an organism to utilize specific carbohydrate incorporated in the medium (glucose, sucrose and lactose in concentration of 0.1%, 1.0% and 1.0% respectively), with or without the production of gas (indicated by cracks in the media as well as an sir gap at the bottom of the tube) along with determination of possible hydrogen
sulfide production (detected by production of black color in the medium). A pH indicator (phenol red) included in the medium can detect acid production from fermentation of these carbohydrates and it gives yellow reaction at acidic pH, and red reaction to indicated an alkaline surrounding.
Procedure: The test organism was streaked and stabbed on the surface of TSI and incubated at 37oC for 24 hours. Acid production limited only to the butt region of the tube is indicative of glucose utilization, while acid production in slant and butt indicates sucrose or lactose
fermentation. The results are interpreted as follows:
Yellow (Acid)/ Yellow (Acid), Gas, H2S Lactose/Sucrose fermenter, H2S producer.
Red (Alkaline) / Yellow (Acid), No Gas, No H2S Only Glucose, not lactose/Sucrose
fermenter, not aerogenic, No H2S production
Red (Alkaline) / No Change Glucose, Lactose and Sucrose non- fermenter.
Yellow (Acid)/ No Change Glucose-Oxidizer.
No Change/ No Change Non-fermenter
Urea Hydrolysis test
This test demonstrated the urease activity present in bacteria which decomposes urea, releasing ammonia and carbon dioxide. Ammonia thus produced changes the color of indicator (phenol red) incorporated in the medium.
shows pink red color due to the breakdown of urea to ammonia. With the release of ammonia the medium becomes alkaline as shown by a change in color of the indicator to pink.
Oxidative/Fermentative Test
In Oxidative/Fermentative test end product that is produced in aerobic and anaerobic process can be detected. Carbohydrates are complex organic molecules containing C, H and O in the ratio (CH2O)n . The carbohydrates are classified as monosaccharide, disaccharides and polysaccharides. Monosaccharide are simple sugars containing 3-7° C atoms e.g. Glucose, Fructose etc. Disaccharides are composed of a monosaccharide unit e.g. Sucrose etc. The polysaccharides contain 8 or more monosaccharide units e.g. Starch, cellulose, glycogen etc. During the process of catabolism i.e. breakdown or degradation of complex organic
molecules, certain amount of energy is released. Most of the microorganisms have the capability of catabolizing carbohydrate.
Both the extra cellular and intracellular enzymes are necessary for the degradation of carbohydrate. Extra cellular enzymes degrade the large complex carbohydrate into simpler compounds which can pass to the cell. The intracellular enzymes catabolize these simpler compounds to generate energy. The end product of this degradation is used in glycolysis for the generation of energy.
Glycolysis is one of the metabolic pathway in which simple sugar is converted in a form of energy as ATP. If glucose, after entering a cell is catabolized aerobically the process is called
oxidative metabolism where molecular O2 serves as the final electron acceptor.
If Glucose is catabolized anaerobically, the fermentative metabolism takes place where organic molecules serve as the final electron acceptor. The metabolic end products of carbohydrate fermentation can either be the organic acids like lactic, formic or acetic or organic acid and gas like H2 or CO2.
Whether an organism is oxidative or fermentative can be determined by using Hugh and Leifson’s medium (O/F medium). In this method, two tubes are used, one open to the air and
the other sealed with paraffin to create anaerobic condition. By utilizing glucose results in production of acid which changes the color of medium to yellow.
nitrogen source, here tryptone. In such case, the medium changes to blue color due to the production of alkaline end products.
Procedure: Two O/F tubes were taken and labelled with the name of given organism. With the help of sterile inoculating wire the organism was stabbed the organism in both O/F medium.one tube was sealed with 1ml of sterile paraffin oil to create anaerobic condition. Then incubation was done in37˚C.The color developed in both tubes after proper incubation was observed.
Fig: 1 Susceptibility pattern of Antimicrobials
Fig: 3 Scatter plot of Ciprofloxacin
Fig: 4 Scatter plot of Ofloxacin
Figure 7: Subculture of S.Typhi
Figure 8: Gram’s staining test S.Typhi
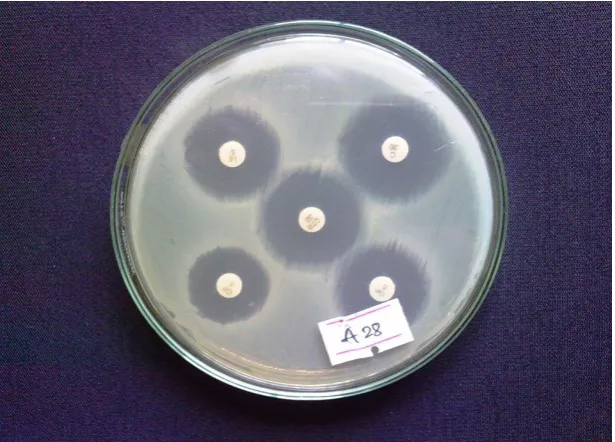
[image:22.595.144.453.522.738.2]Figure 10: Antimicrobial susceptibility of S. Typhi
DISCUSSION
In this study, a total of 108isolates of S.Typhi were identified from different Gram’s staining and biochemical tests collected from blood culture of patients and their antimicrobial susceptibility patterns were determined. The resistance and sensitivity profiles of S.Typhi showed variable results among five anti-microbial agents tested. In this study, out of 108 isolates, only 3 isolates were sensitive to ciprofloxacin, 31 isolates are intermediate and 74 isolates are resistant to ciprofloxacin. In the study only 2.77% isolates are sensitive to ciprofloxacin. A study conducted by Prajapati, et al. 2008 in Kanti Hospital, Nepal found that out of 195 total positive samples, ciprofloxacin was least sensitive among other drugs. (86.6%), this was similar to this study. The sensitivity rates of isolates have shown an increasing trend of resistance to ciprofloxacin indicating wide use of the drug in treating different kinds of infections (Prajapati et al., 2008).
A study by among 388 isolates of S. Typhi , 50 isolates(11.7%), were sensitive , 368 isolates(88.7%) were intermediate and 10 isolates (2.3%) were resistant Ciprofloxacin . They reported a high level resistance of ciprofloxacin against S.Typhi, which can be correlate with this study (Ahmed et al., 2006).
isolates of S.Typhi ,129 ciprofloxacin sensitive which vary from the present study (Madhulika et al., 2004). This variation may be due to the geographical variation.
In contrast to this study, another study from Nepal showed the antimicrobial susceptibility patterns of S. Typhi of 132 isolates in which all the isolates were susceptible to Ciprofloxacin (Khanal et al., 2007).
In this study, Chloramphenicol was the most sensitive drug against S. Typhi. It showed the 97.22% sensitivity against S. Typhi, and 1.85% resistant. Similar result was obtained from previous study in Chennai who reported an 86% sensitivity of Chloramphenicol against S. Typhi. (Krishnan et al., 2009). In the study, in Nigeria by Adabara, et al., 2012 showed that
among 45 isolates all are sensitive to Chloramphenicol which was nearly similar result in the present study i.e. 97.22%.(Adabara et al., 2012). This study was also supported by Amatya, et al., 2007 conducted in Kathmandu Model Hospital of Nepal who showed 97.4% were
sensitive and 2.6% resistant among 78 isolates S. Typhi (Amatya et al., 2007). In contrast to this study, a study conducted in Mexico showed that, out of 493 strians of S. Typhi, 452 (91.7%) were resistant to chloramphenicol. It might be due to the due to the excessive use of Chloramphenicol at that time (Olarte and Galindo, 1973)
In this study, ceftriaxone is also another potent drug. Among 108 isolates, 86(79.62%) isolates were sensitive to ceftriaxone and 9(8.33%) isolates were resistant to ceftriaxone. As similar result was shown by Muthu, et al. 2011 98.5% sensitivity to ceftriaxone among 133 isolates (Muthu et al., 2011). Also from Northern India reported, 87% to 90% sensitivity of ceftriaxone which is similar to the this study (79.62%) (Gautam et al., 2002).
A study conducted in Kathmandu, Nepal showed that 100% sensitive to ciprofloxacin and ceftriaxone agaisnst S.Typhi. This contradicts this study in case of ciprofloxacin which showed only (2.77%). But similar to ceftriaxone (Kansakar et al., 2005).
group with greater spectrum of activity among previous fluroquinolones. In this study, levofloxacin showed 68.51% sensitivity, 31% intermediate and 2.77% resistant.
In this study MIC values were determined in randomly selected 10 isolates for 3 drugs Ciprofloxacin, Ofloxacin, and ceftriaxone. According to CLSI breakpoints ciprofloxacin and ofloxacin were completely resistant. According to scatter plot, MIC value for ofloxacin was found to be 25mcg/ml, for ciprofloxacin was 55mcg/ml-100mcg/ml and for ceftriaxone was 25mcg/ml. Similar result was obtained in over a 5-year period; study from India reported that instances of ciprofloxacin-resistant enteric fever further increased from 0.6 to 15.2 %. The MIC value for ciprofloxacin increased from 0.125mg/ml. Decreased therapeutic efficacy of quinolones is attributed to their widespread and indiscriminate use in humans (Nagshetty et al., 2009).
In this study, ciprofloxacin MIC Value was found to be 55mcg/ml and 100mcg/ml whereas Saha et al., 2006, showed highly ciprofloxacin-resistant (MIC, 512mcg/ml) strains of Salmonela Typhi in Dhaka, Bangladesh, which is very higher value than this study. The
emergence of this highly resistant strain in Bangladesh may be due to the widespread use of ciprofloxacin in a population (Saha et al., 2006).
On contradictory to this study, previous study on Chennai showed the MIC Value for Salmonella Typhi for Ciprofloxacin, Ofloxacin and Ceftriaxone. The MIC of ciprofloxacin, ofloxacin and ceftriaxone were in the recommended range of susceptibility as given by NCCLS, 14 (28%) strains had MIC of ciprofloxacin greater than 0.5 ug/ml with 4 strains having an MIC of 1.56 ug/ml; 25 (50%) strains had MIC of ofloxacin greater than 0.5 ug/ml and 20 (40%) strains had MIC of ceftriaxone greater than 0.5 ug/ml. They account that high levels of MIC of ciprofloxacin may lead to the treatment failure cases. The rising levels of MIC of ofloxacin and ceftriaxone in S. Typhi is also of concern. They recommend that MIC levels of ofloxacin and ceftriaxone should be monitored along with ciprofloxacin in treatment
failure cases of enteric fever (Sekar et al., 2003).
In this study, out of 108 isolates, a total of 19 isolates were found to be multidrug resistant isolates i.e. resistant to fluroquinolnes, Chloramphenicol and ceftriaxone. A Surveillance studies by John A crump et.al demonstrated considerable geographic variation in the proportion of S. Typhi isolates that are MDR in the same region, with sites in India, Pakistan, and Vietnam having higher rates of MDR isolates than sites in China and Indonesia. In the United States, S. Typhi with MDR and decreased ciprofloxacin susceptibility are associated with travel to the Indian subcontinent (Crump and Mintz, 2010).
CONCLUSION
The in vitro susceptibility pattern of 108 isolates of S.Typhi showed highest sensitivity to Chloramphenicol (97.22%), then Ceftriaxone (79.62%), followed by Levofloxacin (68.51%), Ofloxacin (50.92%) and lastly Ciprofloxacin (2.77%). All the 10 isolates showed higher MIC values which were found to be 25µg/ml for Ofloxacin and Ceftriaxone and 55-100 µg/ml for Ciprofloxacin. This showed that Ciprofloxacin was found to be resitant against S. Typhi. Therefore, antimicrobial surveillance should be done periodically to monitor the
current susceptibility patterns in hospitals.
ACKNOWLEDGEMENTS
The authors are thankful to Kathmandu Model Hospital Pvt. Ltd. for providing clinical isolates for the conduction of this study and National Model College for Advance Learning for providing necessary facilities to carry out this work.
REFERENCES
1. Ackers, M.-L., Puhr, N. D., Tauxe, R. V. and Mintz, E. D. Laboratory-based surveillance
of Salmonella serotype Typhi infections in the United States: antimicrobial resistance on the rise. Jama, 2000; 283(20): 2668-2673.
2. Adabara, N., Ezugwu, B., Momojimoh, A., Madzu, A., Hashiimu, Z. and Damisa, D. The Prevalence and Antibiotic Susceptibility Pattern of Salmonella typhi among Patients
Attending a Military Hospital in Minna, Nigeria. Advances in preventive medicine, 2012. 3. Adhikari, D., Acharya, D., Shrestha, P. and Amatya, R. Ciprofloxacin susceptibility of
4. Ahmed, D., D'Costa, L. T., Alam, K., Nair, G. B. and Hossain, M. A. Multidrug-resistant
Salmonella enterica serovar typhi isolates with high-level resistance to ciprofloxacin in Dhaka, Bangladesh. Antimicrobial agents and chemotherapy, 2006; 50(10): 3516-3517. 5. Amatya, N. M., Shrestha, B. and Lekhak, B. Etiological agents of bacteraemia and
antibiotic susceptibility pattern in Kathmandu Model Hospital. Journal of Nepal Medical Association, 2007; 46(167).
6. Brown, J., Shanahan, P., Jesudason, M., Thomson, C. and Amyes, S. Mutations
responsible for reduced susceptibility to 4-quinolones in clinical isolates of multi-resistant Salmonella typhi in India. Journal of Antimicrobial Chemotherapy, 1996; 37(5): 891-900. 7. Crump, J. A. and Mintz, E. D. Global trends in typhoid and paratyphoid fever. Clinical
infectious diseases, 2010; 50(2): 241-246.
8. Capoor, M. R. and Nair, D. (2010) Quinolone and cephalosporin resistance in enteric
fever. Journal of global infectious diseases, 2010; 2(3): 258.
9. Denyer, S. P., Hodges, N. and Gorman, S. P. (2008) Hugo and Russell's pharmaceutical
microbiology, John Wiley & Sons.
10. Gautam, V., Gupta, N. K., Chaudhary, U. and Arora, D. Sensitivity pattern of Salmonella
serotypes in Northern India. Brazilian journal of infectious diseases, 2002; 6(6): 281-287. 11. Hohmann, E. L., Calderwood, S. B. and Baron, E. L. Epidemiology, microbiology,
clinical manifestations, and diagnosis of typhoid fever. UpTo Date® version, 2010; 15. 12. Kansakar, P., Malla, S., Rahman, M. and Basnet, S. Epidemiology of typhoid and
paratyphoid fever in Kathmandu: two years study and trends of antimicrobial resistance. Journal of the Nepal Medical Association, 2005; 44(157).
13. Karkey, A., Aryjal, A., Basnyat, B. and Baker, S. Kathmandu, Nepal: still an enteric fever
capital of the world. The Journal of Infection in Developing Countries, 2008; 2(06): 461-465.
14. Khanal, B., Sharma, S. K., Bhattacharya, S. K., Bhattarai, N. R., Deb, M. and Kanungo, R. Antimicrobial susceptibility patterns of Salmonella enterica serotype typhi in eastern
Nepal. Journal of health, population, and nutrition, 2007; 25(1): 82.
15. Krishnan, P., Stalin, M. and Balasubramanian, S. Changing trends in antimicrobial
resistance of Salmonella enterica serovar typhi and salmonella enterica serovar paratyphi A in Chennai. Indian Journal of Pathology and Microbiology, 2009; 52(4): 505.
16. Madhulika, U., Harish, B. and Parija, S. Current pattern in antimicrobial susceptibility of
17. Muthu, G., Suresh, A., Sumathy, G. and Srivani, R. Studies on Antimicrobial
susceptibility pattern of salmonella isolates from chennai, india.International Journal of Pharma & Bio Sciences, 2011; 2(2).
18. Nagshetty, K., Channappa, S. T. and Gaddad, S. M. Antimicrobial susceptibility of Salmonella Typhi in India. The Journal of Infection in Developing Countries, 2009; 4(02): 070-073.
19. Olarte, J. and Galindo, E. Salmonella typhi resistant to chloramphenicol, ampicillin, and
other antimicrobial agents: strains isolated during an extensive typhoid fever epidemic in Mexico. Antimicrobial agents and chemotherapy, 1973; 4(6): 597-601.
20. Prajapati, B., Rai, G., Rai, S., Upreti, H., Thapa, M., Singh, G. and Shrestha, R. Prevalence of Salmonella typhi and paratyphi infection in children: a hospital based
study. Nepal Med Coll J, 2008; 10(4): 238-241.
21. Saha, S. K., Darmstadt, G. L., Baqui, A. H., Crook, D. W., Islam, M. N., Islam, M.,
Hossain, M., El Arifeen, S., Santosham, M. and Black, R. E. Molecular basis of resistance displayed by highly ciprofloxacin-resistant Salmonella enterica serovar Typhi in Bangladesh. Journal of clinical microbiology, 2006; 44(10): 3811-3813.
22. Saha, S. K., Darmstadt, G. L., Baqui, A. H., Hanif, M., Ruhulamin, M., Santosham, M.,
Nagatake, T. and Black, R. E. Rapid identification and antibiotic susceptibility testing of Salmonella enterica serovar Typhi isolated from blood: implications for therapy. Journal of clinical microbiology, 2001; 39(10): 3583-3585.
23. Sekar, U., Srikanth, P., Kindo, A. J., Babu, V. P. and Ramasubramanian, V. Increase in
minimum inhibitory concentration to quinolones and ceftriaxone in salmonellae causing enteric fever. The Journal of communicable diseases, 2003; 35(3): 162-169.
24. Whitaker, J. A., Franco‐Paredes, C., Del Rio, C. and Edupuganti, S. Rethinking typhoid