www.wjpr.net Vol 4, Issue 4, 2015. 1046
DIRECT AND DERIVATIVE SPECTROPHOTOMETRIC
DETERMINATION OF CU (II) USING ESOMEPRAZOLE
B. Ranganath, D. Rajesh, L. K. Ravindranath and P. Venkata Ramana
Department of Chemistry, Sri Krishnadevaraya University – Anantapuramu-515 003 India.
ABSTRACT
Esomeprazole is a new chromogenic reagent used for the
determination of copper (II) by direct and derivative spectrophotometric method. Esomeprazole forms a yellow coloured complex with copper (II) at pH 3. The method obeys Beer’s law over 0.5 to 10 ppm and sandell sensitivity is 0.022 µg/cm2. The method is useful for determination of copper in biological, alloys, synthetic mixture and water samples.
KEYWORDS: Esomeprazole, Copper (II), Spectrophtometry, Synthetic mixture, Alloys.
INTRODUCTION
Copper is a metal of great biological importance as it is an essential constituent of about thirty enzymes and glycoprotein’s. The concentration of
copper plays a vital role in many biological processes.
Copper is one of the important and essential nutrients for human health as well as the growth of animals and plants.[1-7] Copper is required for normal metabolic processes. Copper combines with certain proteins to produce enzymes that act as catalysts to help a number of
body functions. Copper helps to provide energy required by biochemical reactions. Although copper is an essential micronutrient and is required by the body in very small amounts, excess
copper in the human body can cause stomach and intestinal distress such as nausea, vomiting, diarrhea and stomach cramps. The lowest level at which these adverse effects occur has not been well defined. People with Wilson’s disease, a rare genetic disorder, are more sensitive to
the effects of copper. Copper is also a commonly occurring element in natural waters. Most copper contamination in drinking water happens in the water delivery system, as a result of corrosion of the copper pipes or fittings.[1-9]
Volume 4, Issue 4, 1046-1060. Research Article ISSN 2277– 7105
Article Received on 19 Jan 2015,
Revised on 14 Feb 2015, Accepted on 10 Mar 2015
*Correspondence for
Author
B. Ranganath
Department of
Chemistry, Sri
Krishnadevaraya
University –
Anantapuramu-515 003
www.wjpr.net Vol 4, Issue 4, 2015. 1047
Copper is malleable and ductile, and is used extensively, in products such as; copper wire, copper plumbing, doorknobs and other fixtures in houses, electromagnets motors, esp electromagnet motors, electrical relays and electrical switches, vaccum tubes, cathode ray tubes, and the magnetors in microwave ovens, and wave guides for microwave radiation. There is increasing use of copper in integrated circuits, replacing aluminium because of its superior conductivity, in cookware, especially in the preparation of frying pans.
B.K. Reddy, J.R. Kumar et al.[10] Benzildithiosemicarbazone was used for the extractive spectrophotometric determination of Cu(II) in pharmaceutical and environmental samples in the pH range 1.0 to 7.0. P. Puruchat et al[11] reported univariate, simple optimization and the flow injection method for the spectrophotometric determination of copper using nitroso R salt as a complexing agent. X.Y. Cheng and Z.H. Li[12] developed a method for the determination of copper using solochromecyanine M.S.Kumar et al[13] described Cu(II)-catalysed oxidative coupling reaction of hydroxyacetanilide with
3-methyl-2-benzothiazolinone hydrazone for the spectrophotometric determination of traces of Cu(II).
Khajadapi Thipyapong and Chomehai Suksai[14] employed meso-3,6,6,9-tetramethyl-4,8-diazaundecane-2,10-dione dioxime [meso HMPAO] as a specific analytical reagent for the spectrophotometric determination of Cu(II). The method is based on the formation of a stable 1:1 red-pink colored complex between Cu(II) and meso-HMPAO in
aqueous solution. Huang et al[15] reported a method for the spectrophotometric determination of trace amounts of copper in electroplating wastewater based on its reaction of DBH-PF with Cu(II).
Ghazy et al[16] have developed a very simple, highly sensitive and selective procedure
for the spectrophotometric determination of Cu(II) in natural waters, vitamins and certified steel scrap samples. It is based on the reaction at pH 4-9 between the
www.wjpr.net Vol 4, Issue 4, 2015. 1048
Cu(II) was spectrophotometrically determined by using di-2-pyridylketone benzoylhydrazone(dPKBH).[18] Di et al[19] reported a novel method for the spectrophotometric determination of trace amounts of copper based on charge transfer complex. Wei et al[20] reported a method for the spectrophotometric determination of trace amounts of copper with trimethoxymethylfluoprone in micro emulsion after pre concentration and separation by sulphydryldextran gel.
Dolman et al[21] carried out the spectrophotometric determination of copper in pharmaceutical and biological samples with 3-[2-[2-(2-hydroxyimino-1-methyl-propylideneamino)-(ethyl-amino)]-ethyl-imino]-butan-2one oxime in alkaline medium. A new reagent isonitrosopropiophenone thiosemicarbazone [HINPTC][22] is proposed for the extraction and spectrophotometric determination of copper. The method is applied for the determination of copper in synthetic mixtures and real samples like phaemaceuticals, aluminium alloys and brass ash.
Hussain Reddy et al[23] proposed 2-acetylthiophene-4-phenyl-3-thiosemicarbazone as a reagent for the spectrophotometric determination of copper. The method was applied for the determination of copper in edible oils and seeds. Thimmaiah et al[24] developed a method for the determination of copper using p-anisaldehyde thiosemicarbazone. The method was applied to the analysis of brass, bronze and Cu-Ni alloy. Khasnis and Shinde[25] reported the use of phenanthoquinone mono thiosemicarbazone (PQMT) for photometric determination of copper and claimed that
PQMT is more selective reagent than neocuproin.
Many reports[26-27] are available for the determination of copper in trace quantities based on spectrophotometric technique. Asuero and Cano Pavon[28] developed a method for determining copper in white metal, blend waste water using biacetyl bis
(4-phenyl-3-thisemicarbazone) as a reagent. Theyalsocarriedoutsimultaneous determination of copper and zinc. Cu(II) forms 1:1 and 2:2 intense red coloured complexes with
www.wjpr.net Vol 4, Issue 4, 2015. 1049
usedsynthetic mixture and sea and well water samples for the spectrophotometric determination of copper(II).
In the present work, a sensitive and simple method for the determination of trace amounts of copper(II) by UV-Vis spectrophotometry is described based on the formation of the copper(II)-5-methoxy-2-[[(4-methoxy-3,5-dimethyl-2-pyridinyl)-methyl]sulfinyl]-1H
benzimidazole [ESOMEPRAZOLE]. The influence of some analytical parameters including pH, amount of reagent etc. on the complex formation were investigated.
MATERIALS AND METHODS
All chemicals and solvents used were of analytical reagent grade.
Solutions
Copper (II) Solution
0.052 gm of copper sulphate is dissolved in distilled water in a 100 ml of standard flask and standardized. Working solution is prepared by suitably diluting the stock solution.
Experimental procedure
1 ml of 3.25 x 10⁻⁵ M copper sulphate solution, 1 ml of 2.873 x 10⁻³ M of ESMPZL solution, 10 ml of buffer solution of required pH are taken in a 25 ml volumetric flask. The contents of the flask are made up to the mark with double distilled water. To obtain uniform concentration, contents of the flask are shaken well. The spectrum of the solution is recorded in the wavelength range 300 – 650 nm against the respective blank solution.
Direct Spectroscopy
In each of a set of different 25 ml standard flasks, 10 ml Buffer solution ( pH.3), Various volumes ( 2.5 ml of 3.25x10⁻⁵M ) of Cu (II) solution, 5 ml of Triton-X, DMF ( 1.5 ml ) and 2.5 ml of reagent solution 2.873x10⁻⁴M ) were taken and made up to the mark with distilled water. The absorbance was measured at 390 nm against the reagent blank. The calibration curve was prepared by plotting absorbance against the amount of cadmium.
Derivative Spetrophtometry
www.wjpr.net Vol 4, Issue 4, 2015. 1050
The calibration graphs follow the straight line equation, A = mc+b, where ‘c’ is the
concentration of the solution, A is the measured absorbance (or) derivative amplitude and m and b are constants. By substituting the corresponding data in the above equation. Calibration equations were obtained as A=0.053c - 0.0004, A=0.0150c + 0.0009, A=0.0222c + 0.0003 and A=0.0414c + 0.0001 for first, second, third and fourth derivative data respectively.
INSTRUMENT
Shimadzu 160A microcomputer based UV-Visible spectrophotometer equipped with 1.0 cm quartz cells used for all absorbance studies and amplitude measurements in derivative spectrophotometery. An ELICO LI-120 digital pH meter was used in pH measurements.
Reagent
ESOMEPRAZOLE SOLUTION
Esomeprazole is 5-metoxy-2-[[(4-methoxy-3, 5-dimethyl-2-pyridinyl] methyl] sulfinyl]-1H-benzimidazole. It is white crystalline powder freely soluble in water and its molecular formula is C17H19N3O3S. (M.Wt:345.11). The structure of esomeprazole is given in Fig. 1.
Fig. 1 (S)-5-methoxy-2-[[(4-methoxy-3, 5-dimethyl-2-pyridinyl)-methyl]sulfinyl]-1H benzimidazole (ESOMEPRAZOLE)
N H N
S
O
N
Me
Me O Me
[image:5.595.108.451.403.535.2]www.wjpr.net Vol 4, Issue 4, 2015. 1051 Synthesis and characterization of esomeprazole
Conversion of omeprazole to esomeprazole
OMe N N S O N Me OMe Me H OMe N N S O N Me OMe Me O C O OH Ph OMe N N S N Me OMe Me H O SOCl2
2-NaOH, MeOH, H O, rt2
3-MgCl , H O
1-separation of diastereomers 1-HOCl
2-3(-R)-mandlic acid NaOH,Bu NHSO CHCl , H O,reflux2
2 2 3 4 4 Omeprazole Esomeprazole 38 %
Esomeprazole was characterized by IR, 1H-NMR and Mass spectral data.
IR (KBr) νmax: 3346, 3168, 2961, 2928, 2683, 1657, 1597, 1449, 1255, 1218,1092, 876, 710
cm-1 1
H NMR (DMSO-d6, 500 MHz) :δ 2.20 (s, 3H, CH3), 2.22 (s, 3H, CH3), 3.73 (s, 3H, OCH3), 3.88 (s, 3H, OCH3), 4.60 (d, 1H), 4.77(d, 1H), 6.97, 6.99 (m, 2H, Ar-H), 7.65 (m, 1H, Ar-H), 8.25 (s, 1H, Pyridine ring), 9.57 (s, 1H, NH) ppm.
MS m/z: found 345.11 [M+]; calcd. 345. Anal C17H19N3O3S.
RESULTS AND DISCUSSION
a. Absorption spectra
www.wjpr.net Vol 4, Issue 4, 2015. 1052
and the contents of both the flasks were made up to the mark with distilled water. The absorbance of the two solutions was measured in the wavelength region 340 – 540 nm against the corresponding blanks and plotted against the wavelength (Fig. 2). The yellow coloured Cu (II)-[ESMPZL] complex showed maximum absorbance at 390 nm where the reagent blank has considerably low absorbance. Hence further analytical studies were made at 390 nm against reagent blank.
b. Effect of hydrogen ion concentration
To evaluate the suitable pH at which the analysis is more sensitive, the effect of pH on the absorbance of experimental solutions was studied using the general procedure. The results are presented in the form of a plot in Fig. 3, which shows that the absorbance of the experimental solution is maximum and constant in the pH range 2.5-3.5. Therefore, the analysis has been carried out at pH 3.0.
c. Effect of reagent concentration
Study on the effect of variation in reagent concentration on the absorbance of the experimental solution was made using the general procedure Table.1. It was observed that a minimum of 30 fold excess of reagent was necessary to get the maximum absorbance and thereby have maximum sensitivity.
d. Effect of surfactants
In the absence of surfactants, it was observed that the reagent blank showed considerable absorbance at 390 nm which did not allow the determination of Cu (II). However, in the presence of some surfactants, the absorbance of the reagent blank was greatly reduced at the same time retaining the maximum intensity for the metal complex. This enabled to develop a spectrophotometric method for the determination of copper. Of the various surfactants studied, sodium dodecyl sulphate was found to show a large difference in absorbance
between the reagent blank and the experimental solution Table.2. Hence, sodium dodecyl sulphate was chosen as suitable surfactant in the present studies. The effect of variable
www.wjpr.net Vol 4, Issue 4, 2015. 1053 e. Effect of foreign ions
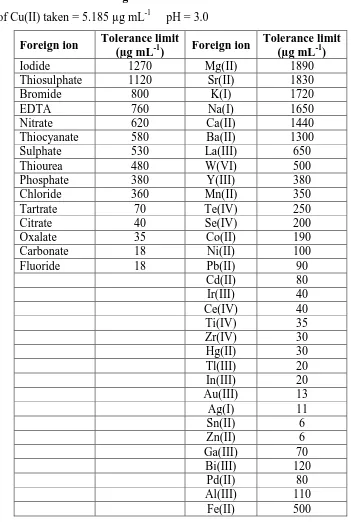
The effect of various anions and cations associated with copper on the absorbance of the experimental solution was studied to calculate their tolerance limits. The results presented in Table.3 revealed that majority of the diverse ions were tolerable in more than 50 fold excess. A few of them were tolerable in the range 7 – 20 fold excess. Some other cations which interfere in less than equal amounts could be masked with suitable masking agents as shown in Table.1 and thereby enhanced their tolerance limits substantially.
Table. 1 Effect of ESMPZL concentration
[Cu (II)] = 2.0 x 10⁻⁵ [SDS] = 0.15%
pH = 3.0 λmax = 390 nm
Cu (II): ESMPZL Absorbance
1 : 5 0.515
1 : 10 0.612
1 : 15 0.708
1 : 20 0.739
1 : 25 0.748
1 : 30 0.789
1 : 35 0.788
1 : 40 0.786
[image:8.595.154.439.261.504.2]1 : 45 0.762
Table. 2 Effect of different surfactants on the absorbance of Cu(II)-ESMPZL complex
Surfactant Type Absorbance
None - 0.722
Triton X-100 Neutral 0.754
Cetylpyridinium chloride Cationic 0.712
Sodium dodecyl sulphate Anionic 0.787
www.wjpr.net Vol 4, Issue 4, 2015. 1054 Table. 3 Tolerance limits of foreign ions
Amount of Cu(II) taken = 5.185 µg mL-1 pH = 3.0
Foreign ion Tolerance limit
(µg mL-1) Foreign ion
Tolerance limit (µg mL-1)
Iodide 1270 Mg(II) 1890
Thiosulphate 1120 Sr(II) 1830
Bromide 800 K(I) 1720
EDTA 760 Na(I) 1650
Nitrate 620 Ca(II) 1440
Thiocyanate 580 Ba(II) 1300
Sulphate 530 La(III) 650
Thiourea 480 W(VI) 500
Phosphate 380 Y(III) 380
Chloride 360 Mn(II) 350
Tartrate 70 Te(IV) 250
Citrate 40 Se(IV) 200
Oxalate 35 Co(II) 190
Carbonate 18 Ni(II) 100
Fluoride 18 Pb(II) 90
Cd(II) 80
Ir(III) 40
Ce(IV) 40
Ti(IV) 35
Zr(IV) 30
Hg(II) 30
Tl(III) 20
In(III) 20
Au(III) 13
Ag(I) 11
Sn(II) 6
Zn(II) 6
Ga(III) 70
Bi(III) 120
Pd(II) 80
Al(III) 110
www.wjpr.net Vol 4, Issue 4, 2015. 1055 Fig.2. Absorption spectra of (a) ESMPZL vs buffer blank (b) Cu (II) – ESMPZL vs reagent blank
[Cu (II)] = 3.25x 10⁻⁵ M [ESMPZL] = 2.873x 10⁻⁴ M
[SDS] = 0.15
Fig.3. Effect of pH on the absorbance of Cu (II) – ESMPZL system
[Cu (II)] = 3.25 x 10⁻⁵ M [ESMPZL] = 2.873 x 10⁻⁴ M
[SDS] = 0.15%
Wavelength = 390 nm
340 360 380 400 420 440 460 480 500 520 540 0.0
0.2 0.4 0.6 0.8 1.0 1.2
b
a
A
bs
or
ba
nc
e
wavelength (nm)
0 2 4 6 8
0.0 0.1 0.2 0.3 0.4 0.5 0.6 0.7 0.8 0.9
A
b
so
rb
an
ce
www.wjpr.net Vol 4, Issue 4, 2015. 1056
Fig.4. Applicability of Beer’s law
[ESMPZL] = 3.25x 10⁻⁵ M [SDS] = 0.15%
pH = 3.0
Wavelength = 390
Fig.5. First order derivative spectra of Cu (II) – ESMPZL
Amount of Cu (II) (μg mL-1
): a. 0.836; b. 1.672; c.2.507;d.3.343; e.4.179
0 1 2 3 4 5
0.0 0.2 0.4 0.6 0.8 1.0
A390 = 0.1908C - 0.0019
A
bs
orbanc
e
e
Amount of Cu(II) (g mL-1)
380 400 420 440 460 480 500 520
-0.08 -0.04 0.00 0.04 0.08 0.12 0.16 0.20 0.24
e
d
c
b
a
d
A
/
d
www.wjpr.net Vol 4, Issue 4, 2015. 1057 Fig.6. Second order derivative spectra of Cu (II) – ESMPZL
Amount of Cu (II) (μg mL-1
): a. 0.836; b.1.672; c.2.507; d.3.343; e. 4.179
Fig.7. Third order derivative spectra of Cu (II) – ESMPZL
Amount of Cu (II) (μg mL-1) :a.0.836; b.1.672; c.2.507; d.3.343; e.4.179
Fig.8. Fourth order derivative spectra of Cu (II) – ESMPZ
Amount of Cu (II) (μg mL-1
): a. 0.836; b.1.672; c. 2.507; d. 3.343; e. 4.179
400 420 440 460 480 500 520 540 560
-0.06 -0.04 -0.02 0.00 0.02 0.04 0.06 e e d d c c b b a a d 2 A / d 2 wavelength (nm)
420 440 460 480 500 520 540
-0.15 -0.10 -0.05 0.00 0.05 0.10 0.15 0.20 d c e b a e d c b a d 4 A / d 4 wavelength (nm)
www.wjpr.net Vol 4, Issue 4, 2015. 1058 Applications
The proposed method was successfully applied for the determination of Copper from various alloys, ores, water samples and pharmaceutical samples. The results found to be in good agreement with those obtained by the standard known method.
Table No 1 Application in different samples Synthetic mixtures
Synthetic mixture Cu(II) standard ppm Cu(II) present ppm
Cu(II) + Cd(II) + Zr(IV) 10 9.82 ( 10 + 10 + 10)
Cu(II) + Pt(IV) + Mn(II) 10 9.75 (10 + 10 + 10)
Cu(II) + Mg(II) + Ni(II) 10 9.90 (10 + 10 + 10)
Table No.2 Alloy Samples
Table No.3 Pharmaceutical samples
Pharmaceutical samples Cu(II) standard ppm Cu(II) present
ppmMultivitamin tablet 5 4.75 Coversyl tablet 4 3.80 Light honey 0.290 0.278 Dark honey 0.560 0.545
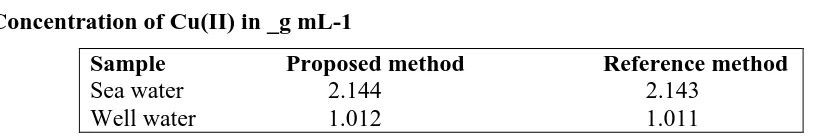
Determination of Cu (II) in Water Samples
100 mL of sea and well water samples were collected and transferred into cleaned polyethylene bottles. The sea and the well water samples were filtered through a Milli- pore 0.45 milli pore size membrane and analyzed within 6 h of collection. Aliquot (0.5 mL) of sea and well water samples was pipetted into a 10 mL standard volumetric flask with 1.8 mL of esomeprazole (0.1%) solution. The contents of each flask were mixed well at room temperature and diluted up to the mark with 1, 4-dioxan. The absorbance of each solution was recorded at 390 nm against the reagent blank prepared similarly except Cu (II). The amount of Cu (II) in sea and well water samples was obtained either from the calibration graph or the regression equation. The amount of Cu (II) was also estimated by the reference method 33.
Sample % Cu(II) Standard method % Cu(II) present method
www.wjpr.net Vol 4, Issue 4, 2015. 1059 Table 4. Determination of Cu(II) in sea and well water samples by the proposed UV spectrophotometric method and the reference method
Concentration of Cu(II) in _g mL-1
Sample Proposed method Reference method
Sea water 2.144 2.143 Well water 1.012 1.011
CONCLUSIONS
The present method is determination of copper (II) using Esomoprazole is a simple, rapid, sensitive and accurate method. This method is not tedious and do not involve Extraction or heating. Copper (II) in microgram and Nanogram quantities can be determined by the present method in different Biological samples, Pharmacuetical samples and Synthetic mixture of Alloys and various Water samples.
REFERENCES
1. A. Kumar, M. F. Hussain, M. Satake, B. K. J. Puri. Chin. Chem. Soc, 1984; 31: 55. 2. http://www.e-b-i.net/ebi/contaminants/copper.html (ac- cessed August 2004). 3. J. L. Lin, L. F. J. Chang. Chin. Chem. Soc, 1984; 31: 297.
4. http://www.ly-copper.com/e-tyhj.htm (accessed August 2004). 5. J. L. Lin, M. J. Satake. Chin. Chem. Soc, 1985; 32: 105.
6. http://www.ianr.unl.edu/pubs/water/g1360.htm (accessed August 2004). 7. M. S. Chao, C. S. Chung. J.Chin.Chem.Soc, 1989; 36: 301.
8. A. K. Malik, A. L. J. Rao. J. Chin. Chem. Soc, 1992; 39: 235.
9. M. A. Rauf, Z. Akhter, S. Kanwal. J. Trace Microprobe Tech, 2003; 21: 577.
10.B.K. Reddy, J.R. Kumar, K.J. Reddy, L.S. Sarma, and A.V. Reddy, Anal.Sci., 2003; 19(3): 423.
11.B. Puruchat, S. Liawruangrath, P. Sooksamiti, S. Rattanaphani, and D. Buddhasukh, Anal.
Sci., 2001; 17(3): 443.
12.X.Y. Cheng and Z.H. Li, HunanYi Kc Da Xuc Xuc Bao., 2000; 25(2): 117.
13.M.S. Kumar, P. Nagarjuna, and H.S. Yathrirajan, Anal.Bioanal.Chem., 2003; 375(2): 315. 14.Khajadpai Thipyapong and Chomehai Suksai, Bull.Korean.Chem.Soc., 2003; 24(12):
1767.
15.N. Huang, C .Xia, and X. He, Guang Pu.Xuc Yu. Guang Pu.Fen Xi., 2001; 21(4): 529.
16.S.E. Ghazy, R.M. El-Shazly, M.S. El-Shahawi, G.A.A. Al-Hazmi, and A.A.El-Asmy,
[image:14.595.77.493.110.180.2]www.wjpr.net Vol 4, Issue 4, 2015. 1060
17.L.S. Sarma, J.R. Kumar, K.J. Reddy, and A.V. Reddy, J. Agric. Food. Chem., 2005; 53(14): 5492.
18.J.J. Pinto, C. Moreno and M. Garcia-Vargas, Anal.Bioanal.Chem., 2002; 373(8): 844. 19.J.Di, Y.Wu and Y.Ma, Spectrochim.Acta. A.Mol.Biomol.Spectrosc., 2005; 61(5): 937. 20.Q.Wei, B.Du, D.Wu and Q.Y.Ou, Guang Pu.Xuc Yu.Guang Pu.Fen Xi., 2005; 25(5):
772.
21.O. Dalman, M.Tufeki, S. Nohut, S. Guner and S. Karabocek, J.Pharm.Biomed. Anal., 2002; 27(1-2): 183.
22.R. Archana, Kocharekar, and N.V. Thakkar, Jsirac, 2004; 63(3): 203.
23.N.B.L. Prasad, K. Hussain Reddy, and T. Sreenivasulu Reddy, Indian J. Chem., 2003; 42A: 112.
24.K.N. Thjimmaiah, H. Sanke Gowda, and S. Maqbool Ahmed, Indian J Chem., 1983; 22A: 690.
25.D.V. Khasnis and V.M. Shinde, J. Indian Chem. Soc., 1982; 59: 812.
26.R.S. Lokhande, S. Nirupa and A.B. Chauhary, Asian J. of Chemistry, 2002; 14: 149. 27.R.V. Krishna, R.S. Mutta, R.P. Raveendra and R.T. Sreenivasulu, Chemia. Analityczna,
2001; 46: 687.
28.A.G. Asuero and J.M. Cano Pavon, Analyst, 1978; 103: 140.
29.M.E. Khalifa, M.A. Akl, and S.E. Ghazy, Chem.Pharm.Bull (Tokyo)., 2001; 49(6): 664. 30.E. Sabel, M. Joseph and Stefan Siemann, Analytical Biochemistry Elsevier, 2010; 397:
218-226.
31.R.S. Lokhande, S.K. Patil and S.P. Janwadkar, Ineternational Journal of Pharma Science and Research, 2011; 2(9): 184-188.
32.Lutfullah, Saurabh Sharma, Nafisur Rahman, Syed Najmul Hejaz Azmi, Bashir Iqbal, Maisa Ismail Bilal Bait Amburkb and Zuweina Masoud Hilal Al Barwanib, Journal of the Chinese Chemical Society, 2010; 57: 622-631.
![Fig. 1 (S)-5-methoxy-2-[[(4-methoxy-3, 5-dimethyl-2-pyridinyl)-methyl]sulfinyl]-1H benzimidazole (ESOMEPRAZOLE)](https://thumb-us.123doks.com/thumbv2/123dok_us/795667.586920/5.595.108.451.403.535/methoxy-methoxy-dimethyl-pyridinyl-methyl-sulfinyl-benzimidazole-esomeprazole.webp)