The
Economic
Research
and Social
Institute
A STUDY OF NEW HOUSE PRICES
IN IRELAND IN THE SEVENTIES
IAN J. IRVINE
TI-IE ECONOMIC AND SOCIAl. RESEARCH INSTITUTE COUNCIl., 1983- 198,1
"’1", K. WHITAKER, M.SC.(ECON.). I).ECON., SC., LL.D., President of the
hl.~litule.
* I:’. LYN C H. M.A., M.R.I.A., Chairman of the Council.
R. D. C. BLACK, PH.D., professor. Department of Economic.I, 7Y~e Queen’l
University, BelJmt.
*SEAN CROM I EN, B.A., Second Secretary. Department of Finance. G. DEAN, M.D., E.R.C.P., Director, Medico-Social Research Board.
N.J. GIBSON, B.SC.(ECON), PH.D., Professor, Department q]’Economics, New
University of Ulster. Coleraine.
PATRICK A. HALL. B.., M.S., DIP.STAT., Director of Research, hutitute of
Public Administration.
*\V. A. I-IONOHAN, M.A., F.I.A.
*KIERAN A. KENNEDY, M.ECON.SC., B.PHIL., PH.D.. Director of the
hlslilttte.
MICHAEl. J. KILLEEN, B.A., B.COMM., LL.D., ChairTnan, Irish Di.stiller.~
Group.
T. P. LINt-HAN, B.I-.. B.SC., Director, Central Statistics office.
*D. I". McALEESE, B.COMM., M.A., M.ECON.SC., PH.D., H/hately Professor
oJ Political F.cononO’. Trinity College, Dublin.
CI-IARLES McCARTHS, PH.D., B.L., Professor of Industrial Relations, Trinity
College, Dublin.
*EUGENE McCARTHY, M.SC.(ECON.), D.ECON.SC., Director, Federated
Union of Employers.
JOHNJ. McKAY, B.SC., D.P.A., B.COMM., M.ECON.SC., Chief Executive
Officer. Co. Cavan Vocational Education Committee.
*j. F. MEENAN, M.A., B.L.
* D. N EVI N, General Secretary’ Irish Congress of Trade Unions.
*TOb.,I,~S F. 0 COFAIGI-I. GoverTtor, Central Bank.
jOVCE O’CONNOR, B.SOC.SC., M.SOC.SC., PH.D., Director, Social Research
Centre, College of Humarzities. National b~titute jbr Higher Education, Limerick. E. O’DRISCOLL, B.SC., M.ENG.. Managing Director, Wang Laboratories
Ireland, B.V., limerick.
I. 0 FIONNGHALAIGI-I, Secretary, Department of Labour.
D. P. O’MAHONY, M.A., PH.D., B.L., Professor. Department of Economics,
Univer.~it)’ College. Cork.
LABHRAS 0 NUALLAIN, I). ECON.SC.
B. PA’IT"ERSON, B.A., M.I.I.E., A.I.P.M., Director General, Irish Managemo~t
ln.~titute.
S. SHEEHY. B.AGR.SC.. PH.D.. Professor, Department of Applied
A.gricultural Ecottomics. University College. Dublin.
T. C. TONER, B.COMM., M.B.A., Managing Director, BWG Ltd.
*B. M. WALSH. B.A., M.A., PH.D., Professor, National Economics of Ireland attd Applied Economics. Univer.~ity College, Dublin.
T. WALSH, M.AGR.SC., PH.D., D.SC., M.R.I.A.
*RI-V. C. K. WARD, B.A., S.T.L., PH.D., Professor, Department of SocialScience.
Univer.lity College. Dublin.
P. A. WHITE, B.COMM.. D.P.A., Managing Director, Ind|Lstrial Development
Altthority, Dublin.
A STUDY OF NEW HOUSE PRICES
IN IRELAND IN THE SEVENTIES
Copies of this paper may be obtained from The Economic and Social Research Institute (Limited Company No. 18269). Registered Office: 4 Burlington Road, Dublin 4.
Price IR£5.5o
A STUDY OF NEW HOUSE PRICES
IN IRELAND IN THE SEVENTIES
©THE ECONOMIC AND SOCIAL RESEARCH INSTITUTE DUBLIN, 1984
I have benefited widely in the course of writing this paper from advice and help from very many sources. This task of undertaking research in an area which is new has been made considerably less difficult by the willingness of many people to discuss particular issues, to supply me with data, to point to work ah’eady undertaken, to read and
comment tlpon lily various dl,~fts and to show me their own, as yet uncompleted, research.
In the first place 1 am grateful to Peter Bacon and Terry Baker who provided extensive comments on the first draft of the paper. Their criticisms forced me to deal with many issues which 1 would otherwise have left untouched. The external rel~ree’s comments on a second draft of the paper likewise widened my horizons greatly. Had I followed all of his plentiful suggestions I would have written more than one research paper. In the course of writing the paper I received help from Bob Jennings (Foras Forbartha) who also commented upon the completed paper, Bill Licken (Department of the Environment), Donal de Buitleir (Commission on Taxation), Brendan Dowling (J. anti E. Davy), Declan Walsh, Eithne Fi~gerald, Michael Green (Construction
Industry. Federation), Patrick Honohan and Liam O’Reilly (Cenu~l Bank). Among my colleagues at the ESRI I am grateful to all members who participated at the seminars and particularly to John FitzGerald and Denis Conniffe fi’om whom 1 got numerous ideas. Paddy Geary, John Kennan and Adrian Rafter), also gave advice, particularly on the estimation aspects of the paper. 1 am also indebted to other researchers in the area: Brian Nolan, Martin Kenneally and J. McCarthy and Rodney Thorn. 1 have drawn considerably upon their work and have avoided some pitfalls as a result. While I share
not all of their conclusions (as will be evident upon reading this paper) the results I report have been strongly influenced by their endeavours.
1 am also indebted to the secretarial staffand the administration at the ESRI. To the former for their production in orderly form of my manuscripts and to the latter for the opportunity to spend a most enjoyable and productive year in Dublin. Lastly to Concordia Universiu, who granted me a year’s leave and also financed my travel to enable me to write the final draft in Dublin.
CONTENTS
GENERAL SUMMARY
page ix
Chapter
1. INTRODUCTION
I Purpose and Motivation for the Study I1 Economic Concepts
AN OVERVIEW OF THE MARKET I Trends in the Seventies
II Quality Changes in New Housing Ill The Rate of Return to Investments
IV lnconae Taxation and tile Demand for Housing V Space Invaders and the Optimal Amount of Housing
3. THE COST OF CAPITAL AND THE COST OF HOUSING
I Introduction
11 Gross and Net Costs - The Effects of tile Tax System Ill The Cost of Capital for House Buyers - Theory IV The Cost of Capital: Measurement
4. ECONOMETRIC MODELS
A POLICY ORIENTED ANALYSIS OF THE STRUCTURE OF THE HOUSING MARKET
I Introduction
11 A Theoretical Model
II1 Controlling the Price of Housing: Kenny, CRVs and the Price of Land
CONCLUSIONS AND RECOMMENDATIONS I Housing Quality
II Taxation
III Cost of Capital and Subsidies IV Econometric Work
V The Housing Market and Controls.
1 3
7
9
17 20 22
27 28 33 36
43
50 51
57
61 61
LIST OF TABLES Table
2.1 Behaviour of Key Variables in the Seventies 2.2 Composition of Housing Output
2.3 Characteristics CompositionofHousing 3.1 Rates on Taxable Income 1974-1981 3.2 IncomesofMortgage Loan Recipients
3.3 Estimated Average Marginal Tax Rates for New House Buyers, 1969-1980
3.4 Cost of Capital for New Housing
page 8 9 11 30 31
LIST OF FIGURES
Figure
1.1 Resource Allocation in the Housing Market
2.1 Area of New Private Houses for which Planning Permission has been granted.
2.2 Housing Price and Cost Indices 2.3 The Real Price of New Houses
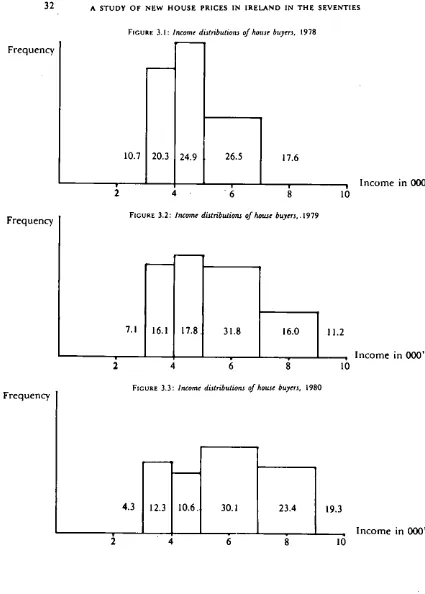
2.4 Capital Allocation in a Two Sector Economy 3.1 Income Distributions of House Buyers, 1978 3.2 Income Distributions of House Buyers, 1979
3.3 Income Distributions of House Buyers, 1980 4.1 The Market for Private Housing
5.1 ThePricing of the Housing Stock
55132J t Price and Quantity in the Long Run
5.4 Determination of the Price of Land
page 5
10 13 17 19 32 32 32 45 53
53
GENERAL SUMMARY
1. Introduction
The housing market in h’eland in the 1970s could be characterised as follows: --Snbstantial increases ill the price
9f
new and secondhand houses were registered. Accompanying these were large increases in land prices. The rate of growth in both hmd and house prices generally outstripped the rate of increase in tile consunler price index.--Major changes in legislation governing building and in the direct and
indirect subsidlsation of housing were implemented by successive governnlents.
--The houses buih in the late ’seventies were very different in size, design and type ("estate" versus "one-ofF’) fi’om those buih in the early ’seventies. --The number of new houses built each year in the ’seventies was ahnost
double the number buih in the early and mid-sixties.
The purpose of this paper is, broadly, to examine tile reasons for these
stylised facts. Further, the purpose is to analyse the events of the ’seventies with a view to offering some conclusions on tile eft]caw of government policies in relation to stated objectives. It is not the objective of the paper to analyse all aspects of the housing market. Tile focus of attention here is primarily upon the new private housing sector with an emphasis upon causative and ctuantifiable behaviour.
The motivation for this study springs from several sources. First, concern
over housing prices has played a major role in public policy making, as witnessed by the many changes in legislation which have taken place. Second, the granting of substantial subsidies to tile housing sector raises questions regarding the intent and effects of such subsidisation. Third, the absence of
quantitative analysis in certain areas has made the evaluation of government policies veW difficult.
The major findings of this study relate to (a) the tax system (b) the cost of home ownership (c) an examination of econometric modelling of the housing market (d) an analysis of the interrelationships between the different segments
of the market and the place of price controls in this system (e) the evolution of housing quality and (t’) tile utilisation of space.
A STUDY OF NEW HOUSE PRICES IN IRELAND IN THE SEVENTIES
2. Economic Concept5
Possibly the most difficult hurdle to scale in conducting public discussion on the government’s role in housing is to forntulate concepts through which such a discussion can be moderated. Consistent policies cannot be formulated if one group in society uses only norms ofecotlornic efficiency while another uses only
norms of equity.
When economists invoke the concept of an efficient allocation of resources they refer to conditions of operation in the economy such that resources are not wasted. In technical terms, an efficient use of a resource is one in which it is used
to a point where the marginal cost to society equals the rnarginal value placed upon it. If solely notions of efficiency were of concern the major justification for government intervention would be to counter market failure. But this is rarely the case. Few, if any, societies have a minimalist role for governrnent and a feature of most is a stated concern with’equality.
Thus the formulation of housing policy must seek to balance the efficient allocation of resources with considerations of equity. And in these
circumstances the economist cannot always say that a certain policy is "right" or "wrong" or "inappropriate" without invoking some normative standard. Unfortunately, in some instances the formulation of policy seems to have been undertaken in an environment in which such trade-offs were not ahvays recognised.
3. The Income To~x. System
The income t,’Lx system provides incentives for home ownership in ~vo imt)ortant ways. First, the imputed income from home ownership is not taxed. Second, within varving limits, mortgage interest has been tax deductible. It has been a widely held belief that households have faced increasing marginal income tax rates during the ’seventies and that as a consequence there has been an increasing incentive to purchase housing because of the provisions of the
inconle tax code.
GENERAL SUMMARY xi
While the t,-ex rate thus increased substantially, it is to be emphasised that this provision alone was not sufficient to encourage investment in housing rather than any other asset. The general provision for interest deduction (rather than just mortgage interest) would insure investment in a variety of forms were it not
for the fact that housing provides a very good form of collateral and has been perceived as an asset which would likely yield a higher noo-t,xxable capital gain.
4. The Cost of Home Oumership
Rising house prices have led to considerable concern on the part of successive governments over the ability of families to afford housing. The consequences of such concern have been in the form of purchase incentives and subsidies. What has been absent in this process is a clear formulation of what the cost of home ownership has been. In Chapter 3 of the study cost estimates are developed for typical purchasers of new houses for the period 1970-1980.
At the outset a distinction is made between the purchase price oft house and the cost of ownership (which is termed the cost of capital in the text). The cost of ownership for any time period is defined as the mortgage cost plus maintenance, depreciation and property taxes minus capital gains and tax savings attributable to the non-taxation of imputed income and mortgage interest. The estimates so obtained show that the cost for new home purchases has been strongly negative for several years in the ’seventies. This fact has been
due primarily to substantial capital gains and to the savings on income taxes. These negative costs raise at least two questions. First, is it necessa~’y to subsidise housing to the extent then undertaken? Second, what are the mechanics of the operation of the market which have resuhed in almost continual capital gains?
It seems that subsidisation is undertaken because of the recognition of the high car~2,’ing costs relative to income despite the restdting gains to households at all ranges of the income distribution. If carrying costs concerns are the reason for subsidisation it is unclear why the government has not been more active in mortgage poliq’ by providing incentives to mortgage granting instittulons to vary the type of mortgages offered. The availability of alternative
insnunlents wonld obviate some of the perceived need for the present costly subsidisation which cause very regressive income distributional effects.
While recent governments have made movements in this direction, in the
A STUDY OF NEW HOUSE PRICES IN IRELAND IN THE SEVENTIES
rates are severe. When, further, tile historic practice of permitting mortgage interest deductions to be naade at the marginal rate of tax is considered together with the interest subsidisatioll policies, a pattern of subsidies emerges which is unusually regressive.
The second question, collcerning the equilibration of markets is addressed in Chapters 4 and 5. Here it is argued that restricted mortgage availability, the consu’aining role of current rather than life cycle incomes and possibly inaccurate price forecasts have prevented immediate equilibration.
5. Ojzality Changes in New Housing
While house prices registered substantial increases during the period under consideration, some of the increase is attributable to the fact that the houses buih at the end ol’the period were larger and better constructed than the houses buih al the beginning. Reasons for this trend are proposed in Chapter 2. It is proposed th;u, in addition to the effects of higher incomes and an expanding population, Ihe evolution of size and quality has been attributable to the structure of state grants, the existence and subsequent abolition of rates
together with regulations governing their sliding scale remission when operative, the structure of developntent of building sites, the housing market recession of 1974/75, the cost of working capital, the role of price controls and to die general battel3’ of incentives to purchase housing.
6. Econometric Models
The existing rather small body of econometric work on the housing market is examined in Chapters 4 and 5. While substantial insights into the operation of Ihe market and into the nmdelling diffictdties have been generated as a resuh of this work, un[orttmately the statistical estimates arrived at in some of the work are unsatisfactoW. While some of the problems here are solvable, the major difficuhy in economeu’ic modelling lies in the numerous changes in circumstances and legislation governing the market. These continual changes make the outlook for econometric work dim.
7. The Optimal Amount of Housing and the Utilisation of Space
GENERAL SUMMARY F, iii
maintenance of the existing stock, has led to a less than ideal pattern of
development. In addition, the very high costs associated with moving, in part attributahle to stamp duties, has restricted mobility and thus led IO a less than t\lll utilisation of many houses.
8. The Housing Market, Price Controls and the Kenny Report
In the final chapter of the paper a model of the functioning of the whole housing market is offered. This consists of an examination of the intcrrelationships between the markct For the existing stock of houses, tile flow of new houses and the land market. By recognising the essential difference between stocks and flows and further recognising the fact that new house prices
do not move from one cquilihrium to another instantaneously, it is possible Io draw inferences for current issues of policy. In particular it is illustrated ihat the prima~T effects of price controls are redistributive and that their long-run effect on the price of even new houses is negligible. The clear implication of this conclusion is that the purpose of the system of price controls presently in operation (Certificates of Reasonable Value (CRV)) inust be called into question.
This franlcwork further provides a vehicle for examining the proposals in the "Kennv" report. The principal theme of this chaplet is to illustrale that the deternlination of equilibrium prices must be viewed fi’ont a behavioural rather
than an accounting framework. (One of the most unlbrtunatc aspects of policy making in recent years in relation to controlling prices has been that, even though praiseworthy in intent, the major long-run effects of the system of new house price controls have had little to do with controlling prices). The purpose
of Ihe Kenny report recommendations was to ensure that some of the incre~lse
in land values (primarily due to servicing with water and sewage facilities) bc caplured by the Local Aulhorities. It is proposed in the paper thai, if the
recommendations regarding compulsory purchase are implemented, it is nol necessalT thai the land be resold cheaply to developers in order to benclit home huycrs. Rat}let the land could be sold at full market price and the funds so obtained could be used for whatever purpose the comnaunity or Local
Chapter 1
INTRODUCTION
1. 1. Purpose and Motivation for the Stud),
Tile housing market ill Ireland in the 1970s could be characterised as Ibllows: -- Substantial increases in the price of new and secondhand houses were
registered. Accompanying these were large increases in land prices. The rate o[" growth in both land and house prices generally outstripped tile rate of increase in tile consnHler price index.
-- Major changes in legislation governing building and in the direct and indirect snbsidisation of housing were implemented by snccessive
govel’nlllents.
-- The houses being built in tile late ’seventies were vex~, different in size and
design (which we shallterm "quality") and in type ("estate" versus "one-o11"’) from those built in tile early ’seventies.
--The number of new houses built each year in tile ’seventies was almost double tile nunaber huih in ttle early and mid-sixties.
The purpose of this paper is, broadly, to examine tile reasons for these "stvlised facts". Further, tile purpose is to analyse the events of tile ’seventies witJt a view to oflizring some conclusions oil tile etllcac3/of government policies in relation to stated objectives. It is not the objective of tile paper to analyse all aspects of the housing market. Such a wide-ranging analysis has already been carried ot, I by Baker and O’Brien (1979). Tile focus of attention herc is primarily upon the new private housing sector of the market with an emphasis upon causative and quantiiiable behaviour.
The motivation Ibr undertaking this study springs fi’om several sources. In the first place, concern over housing prices has played a major role in public poll0’ making. The system of grants in place in the mid- 1970s, designed to facilitate the purchase of all types of housing, has undergone changes. These changes have come in the form of increased cash grants, tile abolition of rates, new mortgage interest allowances for income tax purposes and changes in regulations governing qualification for grants. In conjunction with the introduction of more direct house price control methods (Certificates of Reasonable Value) these measures were aimed both at keeping the price of houses within range of a greater number of purchasers and stimulating tile building sector.
A STUDY OF NEW HOUSE PRICES IN IRELAND IN THE SEVENTIES
A second reason tbr examination of Ihe housing market springs [1"o111 the economic cleavage between those families who olm~ houses and those who do not. Those who invested in housing before the period of high inflation gained relative to ot hers. The redistribution of wealth which the inflation brought about has been
exacerbated by higher interest rates and higher deposit requirements; and these developments have made it more difllcult for those on one side of the cleavage to catch up with those on the other. Apart fi’om participation in pension schemes, owning a home is the most widespread vehicle which families have at
their disposal to aecunaulate capital. As a consequence, factors which generate barriers to the attainment of that goal Ibr a large segment of the population can have serious social consequences, particularly as the encouragenlent of home ownership has heen a priority for most governments in Ireland to the extent dmL with a home ownership rate of approximately 75 per cent, h’elaud has one of the highest rates in Europe.
A furdler motivation, and this refers in particular to the measurement problems, is that in conjunction with government concern over the state of housing-- and partly as a response to it -- economists and econometricians have begun to
analyse tile nl;srket. For researchers seeking so]utiol’Is to issues of policy making
Ihrough die construction o[ analytical models, it is of prime importance that
meaningl]al daui series be used. It is thus one of the major objectives of this sludy to develop ;appropriate data series. It will be argued in the paper that data
nleastlrelncnl errors in soule ol" the existing ecououletric work are serious enough to casl doubt on the conclusions of these studies. This applies in pilrtictll:lr IU 1he ineastlrenlent OJ" tax alld quality adjusted price variables (Chapter 2) and the cost of capital (Chapter 3).
Fourlh, the motivation for examining the housing market springs from a concern expressed in recent years regarding the allocation of investment in different sectors of the economy. With rates of investment which are vet3, high by international standards it might be expected that the long-term outlook for the economy would be vet3’ favourable. But with slow growth the overall allocation
O[ invesuneut warrants examination.
Finally, it is hoped that the current paper will serve as an input to polio, making in at least two ways. First, data series are developed which have to this point in
INTRODUCTION 3
The present paper is not the first to address the private housing market. A series of studies have been done oil the role of subsidies (e.g., McKeon and Jennings (I 978) or N ESC (1977)}, tile behaviour of the mortgage market (Hewitt
and Thorn (1979) or O’Loughlin (I 980)), the land market (Jennings (1980)) and tile housing systmn in general (Baker and O’Brien (1979)). In addition, econometric work, to be reviewed in Chapter 4, has been done on the market for private new houses by Nolan (1980), Keneally and McCarthy (1982) and Thont (1983). One of the distinguishing features of the present paper is its focus upon the role which government has played in the private house building market. It thus bears similarity in philosophy and intent to the latter named papers but has a different focus.
In concluding this introduction it should be noted that the period covered in the study effectively ends at 1981. This is because the (first draft) of the work was completed in 1982 and while there have been several changes of an institutional type in the interim, time and finance have not permitted me to examine these in
detail. In light of the changes in market conditions in the early ’eighties it would be fl’uitt\~l to update the work on the cost of capital and the behaviour of tax rates in particular. However, it is hoped both that the methodology defining such a’n undertaking has been made clear enough to facilitate such updating, and that the principles underlying the functimling of the various segments of thc market have likewise been sufficiently clearly stated to facilitate an unclerstanding of the effects of the institutional changes.
Throughout the paper constant attention is paid to the notions of efficient3, and equip: (discussed in Chapter 2.1). In particular, emphasis is placed upon the efl]cient use of resources and an efficient use of the existing stock. Since 1982
eeonmnic conditions have slackened with resuhing excess supply in the construction industW. Should government policy be directed towards
stimulating this sector of theeconomy, it is to be hoped that such a stimulus would recognise the quasi irreversibility of new housing investment and that encouragement to the sector would pay heed to the needs of an orderly long-term development of the market rather than be dictated by the stage of the
economic wcle in which we now find ourselves.
I. II Economic Concepts
A STUDY OF NEW HOUSE PRICES IN IRELAND IN THE SEVENTIES
When economists invoke the concept of an efficient allocation of resources they
refer to conditions of operation in the economy such that resources are not wasted. In technical terms an efficient use of a resource is one where it is used to a point where the marginal cost to society equals the marginal value which society places upon it. If the value exceeds the cost, more of the resource should
be used in production, if the cost exceeds the value, less should be used. It is important to emphasise that optimal resource allocation shotdd be defined in terms of social costs and wdues. If there are no externalities generated by the activity social and private measures are equivalent. (An example of an externality in this sphere would be the building of a block offlats overlooking small houses and thus robbing them of daylight).
When elt]ciency is defined in terms of marginal equivalences it is
straightforward to see that, by intervening in the market place through the granting of subsidies and the le~,ing of taxes, the government might distort the allocation process and thus engender a misdirection of scarce resources. For
example, by granting income tax relief on mortgage interest the government lowers the effective cost of house purchase and thus encourages individuals to purchase more housing than they would in the absence of such a policy. Some economists (though not dais one) would thus argue that there is no role for the government in the market place.
The principle can be seen very easily by means of Figure 1.1. The curve D represents some individual’s demand. It could also be termed the individual’s marginal evaluation curve (Silberberg (1978) p. 350-362). The curve S is the supply curve and in a competitive industry will generally represent the marginal cost of producing the good (here housing). With a free market the h0 units of housing are purchased. At this point marginal private cost and value are equal, as are the marginal social cost and value in the absence of externalities.
With the introduction of, for example, a subsidy to the supplier cost, to the
purchaser falls to S~ and it is now optimal for the individual to purchase h ~ units of housing. However, this is no longer a social optimum. The reason is that the cost to society of h~ units of housing is given by Rt whereas the cost to the individual is given by Pl. There is thus an efficiency loss in the sense that the
resources would be valued more highly if put to another use. The ensuing loss is referred to as a "deadweight" loss or a loss in producer’s and/or consumer’s "surplus" and is brought about by the existence of a "wedge" between social costs and private costs.
INTRODUCTION
[image:19.495.66.379.211.466.2]If solely notions of efficient3’ were of concern tile only justification for government interventiou would be to counter market failure, i.e., to help tile market to function in its role of resource allocation in those instances where--for reasons perhaps of externalities -- it is preveZnted from so doing. But this is rarely the case. Few, ifany, societies have a minimalist role for government and a feature of most is their stated concern with equality. A more equitable distribution of economic wellbeing than that resulting fi’om tile interplay of market forces and some given distribution of inherited position can be motivated by a variety of reasons.
FIGURE I. I : Resource allocation in the housing market
h, h, quantity of
housing
One is that the ability to purchase goods and setwices and even to accumulate human capital is heavily dependent upon social and economic background. In such a situation it is argued that the further absence of equal access to education implies that subsidies and taxes are necessary to attempt to redress the social imbalances. Thus, for example, the subsidisation of housing for those at the lower end of tile income distribution would, in this view, be a legitimate way of moderating inequality.
A STUDY OF NEW HOUSE PRICES IN IRELAND IN THE SEVENTIES
capital markets would not be reasons for laissez-faire. Tile perception of the distribution of individual abilities and position as being unknown would lead individuals in an imaginary’ pre-materialisation to rationally formulate maximum type redistribution rules.
Yet a further approach is to use non-indlvidualistic criteria. Rather than formulating policy on tile basis of a social welfare function defined in terms of the stun of the wellbeiug of individuals (which is the approach implicit in the previous paragraphs where effectively different weights are assigned to different individuals), society decides that certain goods should be available in minimum quantities to all individuals. Such goods are referred to as "merit wanu" (Tobin (1970)). Examples today are health care or free public transit for the aged.
Housing, likewise, could be defined as a merit good, perhaps because the standard of health depends upon the qualit3’ of accommodation or that the interests of children are ai stake.
In stun, there are a variety of reasons why the allocation of resources resuhing from the functioning of the marketplace could be deemed to be less than socially desirable- even if the marketplace were functioning efficiently in the sense previously described.
Thus ihc formulation of housing policy must seek to balance the efficient allocation of resources with considerations of equity. And in these circumstances the economist cannot always say that a certain policy is "right" or "wrong" or "inappropriate" without invoking some normative standard.
However, it will be argued in this study that in some instances the formulation of policy would seem to have been undertaken in an environment in which such trade-offs were not recognised. In this sense, as pointed out earlier in the chapter, the provision of information and data defining the choices for policy
making is one of the study’s major objectives.
Fl’om this point the paper proceeds as follows. In the next chapter we review
the major trends in the ’seventies and examine the rate of return to housing, the evoht6ou of the tax system, changes in housing quality and the general behaviour of the market for private new houses. In Chapter 3 the cost of ownership of a new house is examined with particular focus upon the role of intlation, government incentive schemes and land. Chapter 4 deals with the economelric literature on housing in Ireland. In Chapter 5 the functioning of the whole market for housing is examined within a consistent framework. The interrelationships between the key elements in the system (land, new houses, secondhand houses and mortgages) are examined and some important conclusions are drawn both for the role of price controls and tile direction iu which future econonmtric work should go. In the final chapter the conclusions of the various parts of the study are drawn together and some
Chapter 2
AN OVERVIEW OF THE MARKET
In this chapter an overall view is presented of the new house market in the ’seventies. This involves two things: First, a presentation of information and an
examination of quality changes in new houses (Sections 2.I and 2.II). Second, an analysis of the behavioural aspects of the housing market. Thus in Sections 2.111 through 2.IV the rate of return to housing is examined, the effects of the income tax system are analysed and this is followed by a discussion of the appropriate amount of housing to be supplied.
2.1 : Trends in the Seventies
In contrast to the 1960s housebuilding in the ’seventies expanded very rapidly in tile early part of the decade and stayed at a plateau -- with some
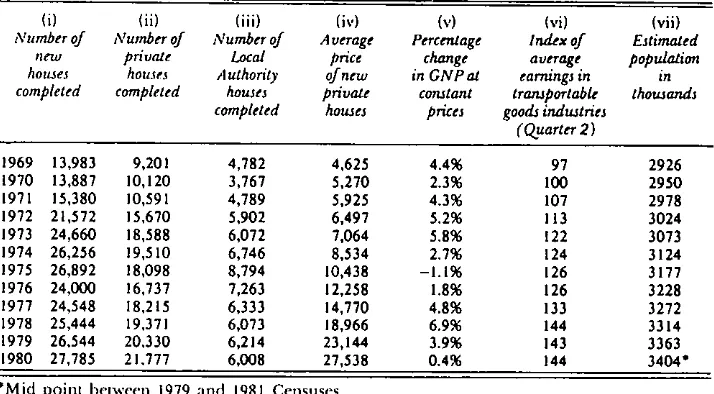
variations--fi’om 1974 onwards. This plateau corresponded to a level of output about ta~’ice that produced in the previous decade. As can be seen fi’om Table 2.1 the growth
in output has not always been smoothly increasing. The construction of Local Authority (LA) houses expanded up to 1975 when a peak of almost 9,000 was reached and then declined to a figure in the neighbourhood of 6,000 in 1978-1980. Privately constructed houses, on the other hand, have not witnessed such a contraction. After a significant growth in 1971 the output of private houses-with the exception of a dip around 1976 -- has progressed from 9,201 in 1969 to 21,777 in 1980.
In terms of numbers’of houses built, output in the industry has thus increased by about 100 per cent. In real value terms the increase has been greater than this, as we shall argue in Section 2.1V that there have been significant quality improvements in the industry. The increase in real output has considerably outstripped the real growth rate in the economy as a whole. The figures in Col. (v) of Table 2.1 indicate that real GNP growth over the same period has been of the order of 44 per cent.
A STUDY OF NEW HOUSE PRICES IN IRELAND IN THE SEVENTIES
Table 2. I : Behoviour of kO’ variables in the "seventies
(i) (it) (iii) (iv) (v) (vi) (vii)
Number of Number of Number of Average Percentage Index of Estimated
new private Local price change auerage populaZion
houses houses Authority of new in GNP at earnings in in completed completed houses private constant transportable thousands
completed houses prices goods industries (quarter 2)
1969 13,983 9,201 4,782 4,625 4.4% 97 2926
1970 13,887 10,120 3,767 5,270 2.3% 100 2950
1971 15,380 10,591 4,789 5,925 4.3% 107 2978
1972 21,572 15,670 5,902 6,497 5.2% 113 3024
1973 24,660 18,588 6,072 7,064 5.8% 122 3073
1974 26,256 19,510 6,746 8,534 2.7% 124 3124
1975 26,892 18,098 8,794 10,438 -1.1% 126 3177
1976 24,000 16,737 7,263 12,258 1.8% 126 3228
1977 24,548 18,215 6,333 14,770 4.8% 133 3272
1978 25,444 19,371 6,073 18,966 6.9% 144 3314
1979 26,544 20,330 6,214 23,144 3.9% 143 3363
1980 27,785 21.777 6,008 27,538 0.4% 144 3404*
*Mid point I)er,+.,een 1979 and 1981 Censuses.
’Source.l: (i) - (iv) Quarterly Bulletin of Housing Statistics.
(v) 1969 - 1979 National Income and Expetutiture 1980 ESR[ Quarterly Commentary, July 198 I. (vi) Irish Stntistical Bitlletin.
The fact that a good, the quantity produced of which has risen to such an extent, can experience a price increase of this magnitude indicates that very strong influences have been at work in the market place to bring such price changes about. While a detailed analysis of some of these influences (tax
regulations, quality change, government grants, inflation) is presented later, we note just two factors at this point. The first refers to the growth in incomes. The GNP index and the index of earnings in transportable goods industries in Table 2. I indicate that purchasing power expanded considerably -- particularly in the two phases 1971-1973 and 1977-1978. Scheffman and Slade (1981) have argued that the growth in real income has played a major role in the demand for housing in their study of house prices in Britain, Canada and the US. ID addition to this, the demographic expansion of the ’seventies, which fat" exceeded anything in recent history, meant that housing demand increased to cater for the greater number of family units. The average annual population growth in the ’sixties was about 16,000 (.05 per cent) while in the ’seventies it was of lhe order of 46,000 (1.4 per cent). Accompanying the greater population in the latter period was a greater tendenc3, for households to "undouble".
Blackwell (t981) estimates that, of the increase in the number of households between 1971 and 1979, 35 per cent was due to an increase in headship rates, though it must be recognised that such undoubling may not be independent of the size of the housing stock and is certainly not independent of growth in
AN OVERVIEW OF THE MARKET
2.II Odtality Changes in New Housing
In tile preceding section it was illustrated that a ver’y strong increase in house prices was registered during the period under consideration. In this section we start by examining tile available evidence on quality changes. From this two questions emerge. The first concerns why the changes have taken place, the second how quality changes can be quantified. A detailed treatment of the latter"
issue is to be found in Jennings (1983, a).
The major sources of information are the studies by Duff3, ( 1979, 1980) based upon stu’vey data gathered by An Foras Forbartha for the year’s 1976, 1978, 1979, 1980 and planning permissions data published in the Irish Statistical Bulletin. The hitter part of the ’seventies is characterised by more information than the early
part -- since both the Duffy studies and planning permissions data are pertinent, whereas only the planning data are useful for the early part.
One of the important trends over the period has been a gradual movement away from estate type houses towards single houses. Table 2.2 contains a breakdown, by category, for 1976-1979. This trend is more attributable to differential regional rates of growth in house building than to major changes ira the ratio of single to estate type houses within regions (Duff’y, 1980, p. 4). For example, the replacement of many farmhouses in the rural areas explain some of this pattern as do changes in regional population and employment patterns.
Overall, the ’seventies seem to be characterised by two distinct phases: The early years, up to 1974/75, when average housing size was falling and the
[image:23.506.39.407.490.601.2]subsequent years when a much stronger counter trend materialised (see Figure 2.1). Data on approved planning applications (which do not always reflect actual construction) indicate that average floor area decreased from 1,106 square feet ira 1970 to 1,062 square feet in 1974 (a decline of 4 per cent) and increased to 1,214 square feet by 1979 (an increase of 14 per cent). Duff), (1980, pp. 40/41) shows that this pattern for" the latter part of the period was similar for both estate p,.’pe and single houses.
Table 2.2 Composition of housing output.
Catego~ 1976 1978 1979
I. Loc;ll Authol’it~ :lnd otllel"
Slate financed houses 7,398(31%) 6,127(24%) 6,239(29%)
2. Privzlte estate houses 10,320(43%) 11,170(44%) 10,323(39%)
3. Pl’iv:ue single houses 5,538(23%) 7,379(29%) 9,095(34%) 4. Private aparullents in new blocks 294(1%) 318(1%) 437(2%)
5. Conversions 450(2%) 450(2%) 450(2%)
Tola]s 24,000 25,444 26,544
10 A STUDY OF NEW HOUSE PRICES IN IRELAND IN THE SEVENTIES
FIGUI~ 2. I : Area of new private houses for which planning permission has been granted. Square
feel
120O
110O
1970 1972 1974 1976 1978
Source: Irish Statistical Bulletin,
1980
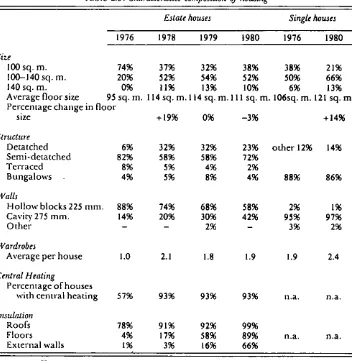
More detailed inlbrmation on quality change (for which floor size may be considered a good measure) is contained in Table 2.3 for the years 1976-1980. As can be seen, a significant movement away from semi-detached to detached structures was witnessed up to 1979 with some reversion in 1980. This is consistent with the general direction of floor space.
Accompanying the shift towards larger single structures has been a general improvement in the materials used in the design and finishing of new houses. Cavity type walls were used to a much greater extent, particularly in estate houses, in 1980 compared with 1976. The change in single houses has been minimal. Complementing this has been an increase in the amount of brickwork and stonework in the finish. The percentage of new houses not equipped with central heating has dropped fi’om 43 per cent to 7 per cent for estate houses. The l)ercentage of houses with some type of insulation in the roofs, floors and external walls is shown in Table 2.3. Here again the quality of insulation has improved substantially. Much of this trend towards better insulated houses was as a resuh of government legislation, though a considerable move towards insulating roofs in particular was made in the mid-seventies as a result of the energy’ crisis.
AN OVERVIEW OF THE MARKET I 1
Table 2.3 : Characteristics composition of housing
Estate houses Single houses
1976 1978 1979 1980 1976 1980
Size
100 sq. m. 74% 37% 32% 38% 38% 21%
100-140 sq. m. 20% 52% 54% 52% 50% 66%
140 sq. m. 0% 11% 13% 10% 6% 13%
Average floor size 95 sq. m. 114 sq. m. 114 sq. m. 111 sq. m. 106sq. m. 121 sq. m. Percentage change in floor
size +19% 0% -3% +14%
SlTUcture
Detatched 6% 32% 32% 23% other 12% 14%
Semi-detatched 82% 58% 58% 72%
Terraced 8% 5% 4% 2%
Bungalows 4% 5% 8% 4% 88% 86%
l’Val/.~
Hollow blocks 225 ram. 88% 74% 68% 58% 2% 1%
Cavity 275 mm. 14% 20% 30% 42% 9$% 97%
Other - 2% - 3% 2%
Wardrobes
Average per house 1.0 2.1 1.8 1.9 1.9 2.4
Central Heating
Percentage of houses
with central heating 57% 93% 93% 93% n.a. n.a.
Insulation
Roofs 78% 91% 92% 99%
Floors 4% 17% 58% 89% n.a. n.a.
External walls 1% 3% 16% 66%
Source: Duff)’ (1980) Appendices.
12 A STUDY OF NEW HOUSE PRICES IN .IRELAND IN THE SEVENTIES
I n brief, there has been a great cllange in the type of houses which have been built in the ’seventies. The trend in the early years was towards smaller houses
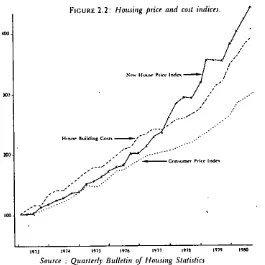
wi~ereas in the later years it was towards larger, more completely finished houses, using better materials. It is thus unreasonable to suppose that average house prices recbrded over that Ome are purely a measure of price change. (One of the corollaries of this is that the relationship between house prices and building costs must be interpreted with care. In particular, the fact that published figures indicate that costs and prices have changed at different rates must not be construed to mean that profit margins have changed radically in house building. See Figure 2.2).
Consider now what reasons may have been responsible for the shift in quality. In the first place it is obvious that all of the factors which are
responsible for generating an increased demand for house numbers -- i.e., govertmaent incentives, inflation, income’ growth, etc. -- are likewise responsible for generating a demand for large and better houses. Some additional factors relating to supply conditions have apparently also been at
work h o’~vever.
The small decline in housing size in the early ’seventies may be attributable to the type of grant structure which came into existence with the 1970 Housing Act. Previousb.’ grants had been payable on the basis of the number of rooms in the
house. With the new regulations the largest grants were given for houses with a floor area between 75 and 100 square metres (807-1,076 square feet) and no grants were payable for house sizes above 1,249 square feet. The grants receivable fi’om the then Department of Local Government were paid directly to the builder with a supplementary grant from the Local Authorit3, payable to the purchaser. With Ihe replacement of this system in 1977 by the single lump sum grant of £ 1,000 payable to the buyer and the accompanying relaxation of floor size requiremems there was no longer the incentive to build houses in the 75- 100
square illetre range.
Of particular interest in the 1970-1975 period is why uouse sizes remained low despite the surge in incomes in the 1971/73 period. The explanation for this would seem to lie in the pattern of building site development at that time and
the role of mortgage availability. With a greater tenden~, for builders to lay foundations for a complete development and finish the building process gradually, a given stimulus to build particular sized houses would have a longer lasting effect than in a situation such as existed in the late ’seventies, when working capital was more expensive and the tendenc3’ was for sites to be completed in blocks. Coupled with this was the general shortage of mortgage funds in 1974 which postponed the sale of some houses until the following year.
AN OVERVIEW OF THE MARKET 13
IOQ
[image:27.506.70.335.77.342.2]i00.
FIGURE 2.2: HolLIing price and cost indicia.
1971 197,t 197~ 1976 1977 197! t97’~ 19~ Source : Quarterly Bulletin of Housing Statistics
second time buyers to be constrained in their choice of size of house. The abolition of property taxes ("rates") on residential housing effective fi’om January 1978, meant that yet another check on house size was lifted. Prior to this owners of new houses below 1,250 square feet were subject to rates on a sliding scale whereas owners of houses above this were subject to full taxation. For the former one-tenth of the full amount was payable in the first year of ownership two-tenths in the second year, etc., until year 10 when the full amount was payable. With the abolition of rates the incentive generated by the differential treatment of different sized houses no longer existed.
Quite apart from these specific changes, the general incentives for more households to purchase housing (such as inflation induced capital gains, favourable tax treatment, higher real incoz’nes, etc., which will be discussed in later chapters) equally were incentives for individual households to purchase larger sized houses.
The effect of all of these changes together likely meant that there was an imbalance in the desired stock as between large and small house --.and their imbalance would have required more than just one year to redress given that
the flow of new houses is such a small percentage of total stock.
14 A STUDY OF NEW HOUSE PRICES IN IRELAND IN THE SEVENTIES
When a change in consumer preferences induces a movement towards a product which differs from what was formerly being consumed suppliers will generally respond -- perhaps with a lag, or with the inducement of a change in relative prices -- to this type of shift. In this sense the demand considerations are sufficient to explain tile movement towards larger, higher quality housing in the mid/late-seventies. But, though less easy to quantify, there have been
reasons for the suppliers likewise to prefer the emerging demand pattern. Relative to the latter part of the decade, builders of estate type houses in the early ’seventies were geared to building relatively larger numbers of low cost housing. Profits were perceived to depend upon fast turnover or low holding costs. During the period 1967168 - 1973174 the total number of houses completed rose from 12,017 to 25,365. This expansion meant that the building
industry was geared to a much higher rate of production at the end of the period than at the beginning, and when d~e slowdown in the effective demand
for houses materialised in 1974176 due to the general slowdown in economic activity, builders were forced to hold larger than customary stocks of unsold
houses.
The demand slowdown was compounded by a shortage of mortgage funds from thc major [ending institutions. In 1974 the government advised the building societies to concentrate their loans upon new house purchases. This had unfortunate effects on both the secondhand and new markets. With secondhand houses more difficuh to sell, many purchases of new houses by existing owners, condhiona] upon the sale of their previous house, did not
materia]ise. With the recognition of the impossibility of separating the markets for new and secondhand houses the government requirement was rescinded.
This slowdown, after a period of great expansion, in conjunction with higher interest rates, led to a preference for smaller stockholding by builders. This in turn implied that a certain naovelnent to larger houses in smaller numbers with a switch from estate type to one-off’type houses was seen by some builders as a way of avoiding risk without an undue fall in profits. This period also witnessed a tendencv for larger builders to concentrate upon site development and then sell the sites to smaller builders for construction.
In subsequent ),ears it is arguable that the spread of Certificates of Reasonable Value (CRV) Scheme caused some shifts in the market. The certificates were introduced in an effort to control the price of new houses and
the reqtfirement of a certificate has gradually expanded to one in which (at the time of writing) ahnost all new mortgage financed houses require a CRV or equivalent exemption certificate (details are contained in the notes in various
issues of the Q~tarterly Bulletin of Housing Statistics, (O,.BHS)).
AN OVERVIEW OF THE MARKET 15
considerable savings to housebuyers have resulted from the effective roll-back of prices requested by builders for new houses. For example, a total of 3,122 certificates for 11,626 dwellings were issued in 1980 and price reductions were effected on 1,464 houses. The amount the buyers were "saved" amounted thus to £3.9 million. (Of course it can be argued that such a notion of saving is meaningless. For example, if builders had applied for £5m more the "savings" would have been £8.9m). In addition 6,904 Certificates of Exemption (CE) were issued. A different view of CRVs has been expressed by M. Greene (The Irish Times, 7 June 1980). He argued that delays in obtaining certificates are costly and that many contractors switched to the upper end of the market to avoid the administrative work associated with obtaining the Certificate.
There is a dilemma here for the policy maker. On the one hand, the plethora
of incentive schemes in existence - which are part of the philosophy of encouraging home ownership - certainly increases demand (and her~ce prices), while, on the other hand, schemes such as the CRV are intended to dampen the tendency for prices to increase.
When making an assessment of schemes such as the CRV it is essential to distinguish between two notions of cost - a distinction which was not wholly recognised in the above referenced views. When the Department of the Environment (DOE) refers to a reduction in prices of£3.9 million it is referring to a redistribution of purchasing power within the economy, not to a net saving of society’s resources. Greene’s argument, on the other hand, refers to real net social losses as a result of increased working capital requirements, an increased
amount of resources devoted to implementing the scheme and a redirection of resources within the indust~’. While a loss in real resources in return for a more equitable distribution of wealth may be desirable, it would seem that, in this instance, not only has such a balance not been examined, but the trade offmay not have been recognised.
It will be argued in Chapter 5 and in the conclusion of this paper that the design of the Certificate of Reasonable Value scheme and the functioning of the housing market is such that price controls can only be effective in the short run and that in the long run the scheme has negligible effects as far as controlling prices is concerned. Furthermore, the general philosophy behind the
implementation of price control schemes in an industry which is characterised by low concentration, considerable competition among builders, and relative
freedom from entry barriers, warrants elaboration. While intetweution in markets may be desirable on account of incomplete information or capital market imperfections, it would seem that intervention via CRVs has been motivated, not by these considerations, but out of a belief that such intervention can permanently affect the level of prices.
16 ^ STUDY OF NEW HOUSE PRICES IN IRELAND IN THE SEVENTIES
the construction of an index which can be utilised to correct the price index of all new houses. A reasonable way of doing this is to examine the change in
house size over the period and let this serve as a proxy for quality. This is reasonable to the extent that the price of housing is a proportionate function of size. (It is not being proposed here that prices are determined by ~:osts plus mark-up rather than in a supply-demand framework; only that within the housing market at any given time different sized houses will command different prices). While there is evidence that an increase in floor area alone does not
increase costs on a one to one basis (jennings (1983,a)) the fact that bigger houses require more fixtures and finishing implies that, in practice, an increase in size brings about an approximately equal proportionate increase in cost-which is paid for by the purchaser.
Tile quarterly index of size for planning approvals can thus be used as a quality index, subject to some adjustment. The adjustment is made necessary because of the fact that plans approved in one quarter will not result in houses until several quarters later and it is the later quarter for which the house price
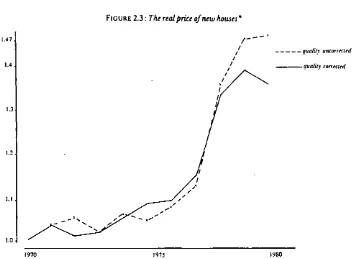
index is defined. Kenneally and McCarthy (1982) suggest that the median lag between starts and completions is five quarters. Assuming that another quarter lag exists between approval and starts a moving average of floor size of houses for which planning permission has been granted, centred six quarters back, thus sem,es as a quality correction index. The resulting quality corrected real price index is g!ven in Figure 2.3.
The information contained in Figure 2.3 underlines very much the conclusions which were arrived at by Duff3’ (1980), whose data -- though limited time wise -- are more reliable. The data points are annualised averages of the quarterly figures obtained from the Quarterly Bulletin of Housing Statistics deflated by the Consumer Price Index and standardised by the planning approvals index. It is clear that the uncorrected data considerably overstate the degree to which house prices have been rising. Any statistical analysis of the housing market which examines the behaviour of prices must thus be cogniscent of this.
AN OVERVIEW OF THE MARKET [7
L.47 1,4
1.2
1.1,
[image:31.506.53.406.57.316.2]1,0,
FIGURE 2.3 : The real price of new houses"
...quality untorrected quality torteted
1970 1975 [980
*Tile real price is defined as the price of houses relative to the consumer Price Index: 1970 = 1.0 1980 = 1.47
2.111 The Rate of Return to Investments
An understanding of the forces which determine asset prices in the spectrum of markets is important because it facilitates a recognition of why certain patterns emerge in these markets. It is also important because it casts incentive formation in a behavioural as opposed to an accounting framework. An example of this is the following. The increase in land prices which has accompanied the increase in housing prices, if viewed in an account framework, would indicate that land prices have caused the increase in house prices-- since land is an input into the production of houses. A behavioural view would recognise that the demand for land is a derived demand, dependent upon the market for the final good. Schemes designed to moderate rising house prices could thus either take the extremely different forms ofsubsidising the owners of land or abolishing the subsidies to house purchasers, depending upon the approach adopted.
18 A STUDY OF NEW HOUSE PRICES IN IRELAND IN THE SEVENTIES
that returns tend to be equalised. This tenden~, is made possible through variation in asset prices. To illus’trate this consider the simple two sector model developed by Harberger (1964) illustrated in Figure 2.4.
In equilibrium the return in each sector (abstracting from risk premia) is given by r0 with the resources KS and Kb invested in each. The schedules A and B define the (diminishing) returns to different amounts of capital invested in each sector. Say now that the rate of return in sector b increases as a result of some government incentive. The rate of return schedule thus increases from B to B L With only Kb invested in this sector the private returns in sector B exceed those in sector A. Resources are thus shifted to the sector with the highest returns
until the post tax returns are once again equalised at rv In Figure 2.4 resources to the amount of K, Ka t have been moved to sector B.
The similarity between this and the mechanism described in Section I.ll should be apparent. Investors reallocate resources so as to maximise private returns. But in this example the social returns available on investment not unclertaken in sector A exceed those on the marginal investments actually undertaken in sector B.
What is meant by capital invested ? This capital allocatioll can refer either to a physical movement of resources from one sector to another or, in the case of fixed capital, to a change in the value of the resources tied up in the different sectors. If this model is interpreted in terms of capital invested in housing (sector B) and capital invested elsewhere (sector A the mechanism which equalibrates post tax returns in the economy requires that, since accretions to
the physical stock take place very slowly (the rate is about 2+ per cent per annum at present), measures which benefit all owners of housing (for example, tile abolition of property taxes) will be capitalised in theprice of the house. Does this then mean that measures which increase the return on new houses will affect onty the amount of physical resources allocated to them and not their price? Clearly not, since such measures will induce a switch in demand away fi’om secondhand to new houses where the return is now higher, the price of new houses will be bid up until a uniform return again obtains. In the long run the allocation of real resources between the sectors will depend upon the price elastici~, of supply of land if other factors are supplied perfectly elastically. If
higher house prices become capitalised in higher land prices there will be no
tendency for more real resources to drive down tile rate of return o11 housing, whereas with an elastic supply curx,e of land an increased amount of real
AN OVERVIEW OF THE MARKET
FZGURE 2.4: Capital allocation in a two sector economy
19
I
\A
I
K. Ko Capital In,’estcd
rI
20 A STUDY OF NEW HOUSE PRICES IN IRELAND IN THE SEVENTIES
To return to the original question posed at the start of this section: It is important to distinguish between accounting and theoretical approaches to pricing mechanisms. Rising prices cannot ultimately be countered in a market context by. subsidisation to purchasers. The effects of subsidisation, while perhaps decreasing the net cost of purchase, are to increase the gross price of the product benefiting from the subsidy, with the exact degree of such an increase depending upon the supply elasticity.
2.IV Income Taxation and the Demand for Housing
The system of income taxation in Ireland, under which, for the period in
question, almost all mortgage interest payments have been deductible in computing taxable income, is widely believed to be a strong incentive to purchase housing. This is particularly true for the non-agricultural sector where the incidence of income tax is highest. With growing inflation in the
’seventies and limited de facto indexation of the income tax schedule, households have been pushed into higher marginal tax brackets as a result of increases in income which, in many cases, were no more than the rate of inflation. (This aspect of the income tax schedule has been documented by
Dowling (19"/7), and Hughes (1982)). Thus, one way of having a lower marginal tax rate (i.e., a higher real income) has been to increase the amount of interest payments on a mortgage.
In this section the notion that mortgage interest deductibility has been a reason for stimulating house purchase is examined. In the following chapter
(which deals with the various aspects of the cost of housing) evidence is presented on the degree to which potential house purchasers have faced an increasing marginal tax rate over the period in question. While ’the results of the latter substantiate the belief that increasing marginal income tax rates have materialised, it will be argued here that the view, that this reason for more housing investment, does not stand up under close examination.
The argument embodied in the conventional wisdom briefly outlined above has very limited validity once it is recognised that, until 1982, there was effectively no distinction in the income tax code between interest deductibility for house investment purposes and any other type of investment. Indeed interest payments incurred to finance consumption expenditures were equally deductible. Hence, there has ostensibly been nothing in the income tax treatment of mortgage interest to encourage investment in housing over any other type of expenditure. Why then has the belief grown up that housing
investment has been given special status in the tax system?
AN OVERVIEW OF THE MARKET 21
bonds or stocks, for example, yield an income stream which is taxable whereas the consumption ofshelter (imputed income) is almost completely tax free since the abolition of rates in 1978. Investment in housing has been the major
" method of avoiding double taxation of savings in this period.
A second reason why housing, rather than other forms of investment, should be encouraged relates to the degree of perfection of the capital market. Not all
investments are equally attractive forms of collateral. Summers (1980, p. 430) points out:
Tile fact that mortgage debt is the principal or only financial liability of many households suggest that housing investments are easier to borrow against than other ahernatives. This may be because of their risk characteristics or of institutional constraints.
This is a key constraint. While in some instances stocks can be used as collateral for borrowing to invest in them they are a less attractive collateral than a house from the financial intermediary’s, standpoint due to their greater short-term variabilip,- in price. For example, what would the optimal policy be for a lender
if the leverage of the borrower/investor goes to infinity (equity goes to zero) due to a pf’ice fall in the stock ? Variation in house prices is rarely sufficient to reduce the owners equity to zero due to the down payment requirements (which vary with the state of both the housing and mortgage markets). Likewise, institutions exist in Ireland (building societies) which have the specific goal of investing in housing. Their rapid sustained growth has enabled them to become the largest single source of housing finance. If the structure of the financial system were different the structure of loans would likely be different.
Third, the tax system has had an effect on housing investment through its treatment of building societies. Mortgage rates tend to be lower than rates charged to potential investors in stocks. This is due to the higher post tax returns which depositors in building societies can obtain (even though the nominal return may be lower than from other forms of liquid asset investments) because of the relatively favourable tax treatment of building societies. By being able to attract funds at a lower rate than most institutions they can correspondingly lend at a lower rate. (At various times some other institutions have also benefited from the non-taxation of interest paid upon small deposits -- for example the Post Office).
Fourth, the non-taxation of capital gains on housing has set it apart fi’om other
22 A STUDY OF NEW HOUSE PRICES IN IRELAND IN THE SEVENTIES
corporate taxation rises with inflation. Feldstein and Poterba have argued that, in the United States, the effective rate of corporate taxation rose from 55 per cent in 1965 to 75 per cent in 1979. With post tax returns changing asset prices will respond. However, with the effective instantaneous write off allowances on corporate investment in Ireland this has not been a factor over the period.
It has further been frequently suggested that, in times of inflation, investors prefer a physical rather than a paper asset and hence the demand for housing has increased relative to the demand for stocks. But this claim has only apparent meaning since stocks do represent a claim on physical capital. The real question concerns why Tobin’s "q" might fall in times of inflation. (Tobin’s "q" is the ratio of the market valuation of assets to their replacement cost.) The only validity to this type of argument is that in time of uncertainty investors prefer a real asset to one which has a return denominated in fixed terms.
- In conclusion, ~,~,ehavear-gue-d-here that interest deductibility for income tax payments is not, per se, and contrary to popular belief, the reason
why
investors have found housing to be such a desirable asset. The taxation system, in various ways has favoured house purchase. Housing has become a desirable asset for reasons of non-taxation of imputed rent and capital gains, inflation, suitable collateral and differemlal tax treatment of the financial institutions which supply funds to potential investors. If it is deemed desirable to influence investment behaviour in different assets it must be recognised that these are the factors in the current institutional set up which have generated the high returns to housing and that, while interest deductibility engenders high returns to housing, it is not sufficient to guarantee such returns.2.V Space Invaders and the Optimal Amount of Housing
One of the most important aspects of housing policy -- and one which has received little attention -- concerns whether or not there exists a structure which promotes the efficient use of space. For example, do policies exist which enable households to consume the amount of housing services they desire at given prices or do policies exist which encourage households to live in houses which are too small or too large?
A clear distinction needs to be made between two concepts of need. The first is one which is defined in a strongly normative sense. For example, it might be decided that a desirable allocation of housing in the economy is one in which space is distributed such that each person should have 1.5 rooms or400 square
AN OVERVIEW OF THE MARKET 23
needs if they facilitated the consumption of the desired amount of housing.
Such a goal would likely irnply that policies would be efficient if high income families have bigger houses than low income families given that housing has a positive income elasticity of demand. In essence such "policies" would consist
of little intervention other than to eliminate market imperfections.
(a) Financial Issues
The evolution of events in the ’seventies has been such as to provide incentives to households to hold larger mortgages. Many observers have (incorrectly) equated this with the notion of "trading up".
Consider a family which has paid offmuch of its mortgage and wishes to avail
of greater interest deductions on its income tax payments. This it could do, in theory, by moving to a different house of exactly the same size and price, divert some of the equity from the previous house to another purpose, thereby taking a larger mortgage on the new property and benefit from the interest relief. All without gearing up to a larger house. In this way, a family could continually take advantage of almost the full deduction without ever purchasing a larger house if the family were willing to move with sufficient frequency. But if this is so why has it been argued that the search for greater income tax deductions, in the form of mortgage interest relief, has led to a demand for bigger houses as opposed to different houses with a higher mortgage?
In addition to the reasons already discussed in the text as to why individuals move "vertically rather than laterally (i.e., expected capital gains, income growth, mortgage interest deduction, etc.) the following institutional considerations are inaportant. In the first place, the "siphoning" of mortgage funds to non-invesunent purposes would seem to be minimal in Ireland. Evidence exists for the US that substantial amounts of money designed to finance housing have found their way to other destinations. This is done simply,