Ab initio
study of the magnetostructural properties of MnAs
Ivan Rungger and Stefano SanvitoSchool of Physics, Trinity College, Dublin 2, Ireland
共Received 24 January 2006; revised manuscript received 12 May 2006; published 31 July 2006兲
The magnetic and structural properties of MnAs are studied withab initiomethods and by mapping total energies onto a Heisenberg model. The stability of the different phases is found to depend mainly on the volume and on the amount of magnetic order, confirming previous experimental findings and phenomenologi-cal models. It is generally found that for large lattice constants the ferromagnetic state is favored, whereas for small lattice constants different antiferromagnetic states can be stabilized. In the ferromagnetic state the structure with minimal energy is always hexagonal, whereas it becomes orthorhombically distorted if there is an antiferromagnetic alignment of the magnetic moments in the hexagonal plane. For the paramagnetic state the stable cell is found to be orthorhombic up to a critical lattice constant of about 3.7 Å, above which it remains hexagonal. This leads to the second-order structural phase transition between paramagnetic states at about 400 K, where the lattice parameter increases above this critical value with rising temperature due to the thermal expansion. We also evaluate the magnetic susceptibility as a function of temperature, from which a semiquantitative description of the MnAs phase diagram emerges.
DOI:10.1103/PhysRevB.74.024429 PACS number共s兲: 75.80.⫹q, 64.70.⫺p, 71.70.Gm
I. INTRODUCTION
MnAs is an extremely promising material for magneto-electronics, since it can grow epitaxially on GaAs 共Ref. 1兲 and Si 共Ref. 2兲, forming clean and atomically sharp interfaces.2 MnAs/ GaAs heterojunctions have been exten-sively studied experimentally,1,3–5 and spin injection from MnAs into GaAs has been demonstrated.6 However, one of the major drawbacks for the use of MnAs in devices is the fact that bulk MnAs has a phase transition at 318 K, where the magnetic state changes from ferromagnetic to paramag-netic. Moreover, when grown on GaAs, this temperature changes depending on the growth direction. This is mainly attributed to the induced strain.1,3,7,8The aim of this paper is to useab initiodensity functional theory共DFT兲calculations to develop an understanding of the phase transitions of MnAs, which can be compared with experiments and with existing phenomenological models.
First a review of the experimental properties of MnAs is presented and a brief description of the existing phenomeno-logical models is given. Then the results of our ab initio calculations are presented and compared to experiments and models. Within the scope of a Heisenberg model the ex-change coupling constants are calculated for different dis-torted unit cells, and the Curie temperature and its depen-dence on the lattice parameters are evaluated in the mean-field approximation. We also predict the ground-state volume and lattice structure for the paramagnetic state, demonstrat-ing that the phase transitions of MnAs can indeed be ex-plained byab initio calculations. Finally a simple model for the susceptibility as function of temperature is given and a qualitative description of the phase diagram of MnAs will emerge.
II. EXPERIMENTAL PROPERTIES AND EXISTING MODELS
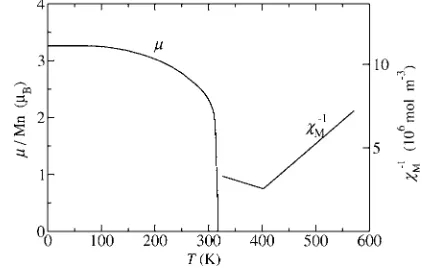
MnAs is a ferromagnetic metal at low temperature but it becomes paramagnetic atTp= 318 K, when the magnetic
mo-ment abruptly vanishes 共Fig. 1兲, the resistivity increases discontinuously,9 the volume is reduced by 2.1%, and the lattice structure changes from hexagonalB81共NiAs type兲to orthorhombic B31 共MnP type兲.10–14 A latent heat of 7490 J / kg is associated with this transition.11 Hysteresis is present with a phase transition temperature of 307 K upon cooling and of 318 K upon heating.13 All these properties clearly indicate a first-order phase transition.
AboveTpthe distortion reduces continuously, until it
van-ishes at Tt⬇398 K,10 where the crystal structure changes
back toB81. There is no latent heat, but only a discontinuity
in the heat capacity of the material; i.e., this phase transition is of second order. For temperatures betweenTp andTt the paramagnetic susceptibility has an anomalous behavior. It increases with increasing temperature until it reaches a maxi-mum at Tt. Above Tt it decreases and has a Curie-Weiss
behavior 共Fig. 1兲. Moreover, at Tt there is a point in the
specific heat.15Application of a magnetic field transforms the B31 structure back toB81above a critical field.9,16–19
Figure2shows the phase diagram. If pressure is applied, Tp is lowered whileTtincreases. Above the critical pressure
[image:1.612.329.540.549.683.2]of 4.6 kbar the ferromagnetic B81 structure becomes un-stable, and the material remains in theB31 structure for all temperatures belowTt. At high pressures and low
tempera-tures different types of ordered magnetic structempera-tures are found, with a reduced saturation magnetic moment with re-spect to the zero-pressure ferromagnetic phase. Canted spin structures, similar to the helimagnetic structures of MnP,20 are found at a pressure of 4.75 kbar below 210 K, with a local magnetic moment of about 3B. A hysteresis region
lies between the ferromagnetic and canted regions, where both states can be stabilized.
When the magnetic order breaks down and the system becomes paramagnetic, MnAs maintains the B31 structure for all pressures. As the temperature is further increased the structure of the cell continuously changes back towardsB81,
until at Tt it has again the B81 structure, with Tt/P⬎0, wherePis the pressure.
The magnetocrystalline anisotropy is quite strong in MnAs, with thec axis being the hard axis, so that the mo-ments prefer to lie in the hexagonal plane.12 Measurements of the magnetoelastic coupling21indicate that the coupling is stronger in the hexagonal plane than perpendicular to it.
Figure3 shows the unit cells of MnAs in the hexagonal B81 and in the orthorhombic B31 crystal structures and it
defines the unit cell vectorsa,b 共bh for the B81 structure兲,
andc. TheB81structure consists of stacked hexagonal layers
of Mn and As atoms, and the unit cell contains two Mn and two As atoms. The B31 structure has twice the volume of B81 due to symmetry lowering and contains four Mn and
four As atoms. The lattice is nearly hexagonal and the atoms are moved out of the hexagonal symmetry points along theb
andcdirections关Fig.3共b兲兴.
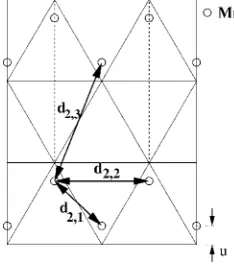
The Mn atoms are mainly displaced in the hexagonal plane along thebdirection forming chains共Fig.4兲, while the As atoms are displaced along thecaxis. In each unit cell one of the planar As atoms is moved upwards and the other downwards with respect to the original position in theB81
structure, so as to keep the Mn-As distance nearly constant. The displacementu of the Mn atoms in the hexagonal plane lies between 0 and 0.05b共b=兩b兩兲, depending on the tempera-ture and pressure, and the displacementv of the As atoms along thec axis lies between 0 and 0.05c共c=兩c兩兲. TheB81
structure is a special case of the B31 structure, where b =
冑
3aandu=v= 0. Therefore we choose the unit cell vectors in such a way thataandchave the same direction for both theB81 andB31 structures. In contrast the directions of thevectorsbh 共兩bh兩=兩a兩=a兲for the hexagonal cell andbfor the
orthorhombic cell are different.
The lattice parameters of MnAs as a function of temperature10,18,22,23 are shown in Fig.5. They increase with temperature due to normal thermal expansion, although the in-plane parameter a decreases when the temperature gets nearTp and it jumps from 3.717 Å to 3.673 Å. The
perpen-dicular parametercincreases continuously with temperature. At Tt there is an inflection in the slope of a and c as a function of temperature, and at about Ts= 450 K 共410 K in
other measurements23兲the slope changes discontinuously. The exact temperature at which the distortion disappears is somewhat uncertain, and fluctuations may play a role for small distortions. The given temperature for the disappearing of the distortion corresponds to Tt= 398 K.10,23 However,
measurements for small distortions are difficult and such a temperature can only be inferred. As pointed out in Ref.24 the distortion should appear at temperatures slightly above Tt. Throughout this work we assume that the disappearing of
the distortion occurs at Ts, which is the temperature where
[image:2.612.79.271.55.194.2]the thermal expansion coefficient of MnAs changes abruptly. FIG. 2. Temperature共T兲versus pressure 共P兲 phase diagram of
MnAs共adapted from Ref.14兲, indicating alsoTpandTtas functions of pressure.
FIG. 3. 共a兲 B81 unit cell
[image:2.612.51.374.550.736.2]Early theories25 believed that the phase transition at T
p
was between ferromagnetic and antiferromagnetic order. This, however, was not supported by experiments23and led Bean and Rodbell 共BR兲 to propose a model where the ex-change interaction is ferromagnetic for both theB81andB31
structures, although it is much smaller in B31.11,26 The BR model neglects the microscopic details of the exchange in-teraction and expresses the Curie temperature TC only as a function of the volumeV:
TC=T0
冋
1 +共V−V0兲
V0
册
, 共1兲
whereT0is the Curie temperature at the volumeV0, which is
the volume in the hypothetical absence of exchange interac-tion 共here the volume of the B31 structure above Tp兲. For
certain values of the parameter , Eq. 共1兲 predicts a first-order phase transition between a ferromagnetic and paramag-netic state; however, the model does not explain the second-order phase transition atTtand neither does a refinement of the theory introducing a term proportional to共V−V0兲2.27
The first attempt at explaining the second-order phase transition is from Goodenough and co-workers, who postu-lated a high-spin to low-spin transition associated with the change of lattice structure fromB81toB31.13,14This, how-ever, is not supported by neutron scattering, which measures little variation of the moment with the volume.28The MnAs
unit cell volume in any phase is too big to justify a high-spin to low-spin transition. In MnAs1−xPx the change from high spin to low spin is observed,10,29,30 for volumes around 120 Å3, while the unit cell of MnAs remains always larger than 130 Å3. Another possible explanation of the
second-order phase transition assumes a random distribution of dis-tortions over the mainB81phase.31Again neutron diffraction invalidates this since regularB81 is found aboveTt.23
Several phenomenological Landau-type models have been proposed.24,32,33 In this case the correct thermodynamic be-havior is obtained by construction but the theory contains a number of parameters to fit from experiments. The idea24 is to expand the free energy⌽as a function of the the relative magnetization 共= 1 ferromagnetic state, = 0 paramag-netic state兲and the orthorhombic distortiond,24
⌽共d,;T,H兲=⌽0+c1关T−T0共1 −␦1d2兲兴2+c
24+c36
+c4共T−TD兲d2+c5d4−M0H共1 −␦2d2兲,
共2兲 whereci and ␦i are coefficients, H is an external magnetic field, M0 is the saturation magnetization, T0 is the extrapo-lated Curie temperate of the low-temperature phase, and⌽0
is a constant. Here the distortiondplays the same role as the relative change in volume共V−V0兲/V0 of the BR model and
the terms proportional to d2 and d4 drive the second-order
phase transition. Variations over this scheme yield similar results.32–34
Spin fluctuation theory was also used for explaining the anomalous behavior of the susceptibility between Tp and
Tt.35,36 This qualitatively predicts an increase of the
suscep-tibility when going from theB31 to theB81structure, mainly associated with the fact that TC increases with increasing
temperature.
More recently tight-binding37,38 and first-principles39–47 calculations have been performed for MnAs in theB81
struc-ture showing a general good agreement with experiments. We are aware of only two studies dealing with the B31 structure.48,49 In Ref. 48 a description of the paramagnetic state of theB31 structure is given by assuming that it coin-cides with zero local magnetic moment of the Mn atoms. This in fact describes a low-spin state for Mn and not para-magnetism, which rather corresponds to constant magnetic moments randomly oriented by spin fluctuations.
The present work investigates the magnetic interactions across the various phase transitions of MnAs. An explanation of the magnetostructural properties in terms of first-principles calculations is given, thereby illustrating the origin and providing a justification of the parameters used by the different models.
III. RESULTS
A. DFT calculations
[image:3.612.113.230.58.190.2]First-principles calculations within density functional theory are performed using the pseudopotential code based on localized atomic orbitalsSIESTA.50The generalized gradi-ent approximation共GGA兲as parametrized in Ref.51is used for the exchange correlation potential, since it has been FIG. 4. Two-dimensional representation of one layer of Mn
at-oms in the B31 structure. dij represent the various Mn-Mn dis-tances. The first index i= 2 indicates that all the Mn are second nearest neighbors to each other in theB81 structure. The second index j= 1 , 2 , 3 labels the three distances arising from the B31 distortion.
[image:3.612.55.295.608.706.2]shown to give good structural properties for hexagonal MnAs.39,41,42 In the valence we consider 4s, 4p, and 3d or-bitals for Mn and 4s, 4p, and 4dfor As. For both Mn and As double--polarized local orbitals are used for the s and p angular momenta, whereas for the d orbitals double- is used. The number ofkpoints in the Brillouin zone is speci-fied by a grid cutoff of 20 Å. This corresponds to a 11
⫻11⫻8 mesh for the B81 unit cell, giving approximately
1000kpoints in the full Brillouin zone. For theB31 unit cell such a cutoff yields a 8⫻11⫻7 mesh. The real-space mesh cutoff, which determines the density of the real-space grid, is 300 Ry.
After full relaxation of the unit cell to a pressure below 0.1 kbar and of the atomic positions to a force smaller than 0.01 eV/ Å theB31 unit cell in the ferromagnetic configura-tion relaxes to a B81 structure with a= 3.72 Å and c = 5.58 Å. The experimental values at room temperature are a= 3.724 Å and c= 5.707 Å. Therefore the relative error is below 1% for a and −2% for c. The lattice parameters at 110 K can be extracted from Fig.5 and area= 3.733 Å and c= 5.677 Å. This demonstrates that GGA-DFT reproduces rather well the zero-temperature ground state.
For a fixedc/aratio of 1.54, which is close to the experi-mental value at the first-order phase transition, the energy is minimized for a= 3.695 Å, which compares well with the results of other ab initio calculations.39,41,42 Also the band structure and the density of states are similar to previous calculations. The magnetic moment per Mn atom is 3.4B
and compares well with the measured value of 3.4B.
The unit cell of theB31 structure contains four Mn atoms, allowing for three possible independent antiferromagnetic configurations of the local moments of the Mn atoms. The different antiferromagnetic states are⫹⫹⫺⫺,⫹⫺⫹⫺, and
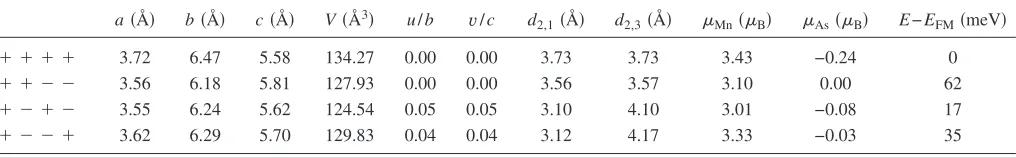
⫹⫺⫺⫹. As a matter of notation⫹⫹⫺⫺means that atoms 1 and 2 in the unit cell have opposite magnetic moment than that of atoms 3 and 4. The indices of the Mn atoms in the unit cell are defined in Fig. 3共b兲. A cell relaxation is per-formed for those three antiferromagnetic configurations. TableIlists the obtained relaxed structures together with the total energies per Mn atom as compared to the ferromagnetic ground-state energy共E−EFM兲. The structure remains of the
B81type if the local moments are ferromagnetically aligned
in the hexagonal plane, whereas it changes to theB31 type if the moments are antiferromagnetically aligned, withu共v兲of the order of 0.05b共c兲. There is also a slight displacement of the Mn atoms alongcof at most 0.01cand of the As atoms alongb of at most 0.01b. Generally it can be observed that the in-plane lattice parameters contract and the cparameter expands for the antiferromagnetic states, resulting in a net reduction of the volumeV.
The calculated lattice parameters are similar to those given in Ref.48, although the absolute value of the magnetic moments differs. This is probably due to the fact that we use a Mulliken population analysis to determine the local mag-netic moment, while in the reference it is obtained by inte-grating the magnetization density over a sphere around the Mn atoms.
The total energy for the ferromagnetic alignment is the lowest, although the⫹⫺⫺⫹configuration is higher of only 17 meV/ Mn. This indicates that the system should evolve to one of the antiferromagnetic states under pressure, since those have a much smaller volume but only a slightly higher energy.
TableI gives also the distances between a Mn atom and its first three nearest-neighbor Mn atoms in the hexagonal planed2,1,d2,2, andd2,3共see Fig.4兲. Note thatd2,2=aand it
is not given explicitly. While these distances are all equal in the hexagonal case, they differ by as much as 1 Å in theB31 structure. Large changes in the distance between the Mn at-oms are possible since the nearest-neighbor Mn-Mn separa-tion in MnAs is well above the interatomic distance 2.61 Å of bulk Mn,52which can be regarded as the minimal possible distance between Mn atoms. The distance between nearest-neighbor Mn and As atoms lies between 2.46 Å and 2.62 Å for all the different configurations and changes therefore much less than the Mn-Mn distance.
The local magnetic moment on the Mn 共Mn兲 and As 共As兲 atoms, calculated using the atomic Mulliken
population,53 is also given in Table I. The local moment on the Mn atoms ranges between 3.43Bfor the ferromagnetic
configuration to 3.01B for the⫹⫺⫹⫺ configuration. This
reduction in the local moment is mainly due to the decrease of the cell volume and the consequent increase of the hybrid-ization between the Mn-dand As-p orbitals.
In summary these calculations show that the distortion to the B31 structure is caused by an antiferromagnetic align-ment of the local magnetic moalign-ments in the hexagonal plane.
B. Fit to the Heisenberg energy
In order to extract the various exchange parameters, cal-culations are performed for three differentB31 supercells in different local magnetic configurations. These supercells contain eight Mn atoms and are obtained by doubling the B31 unit cell along thealattice vector共supercell 1兲, alongb
[image:4.612.52.560.86.165.2]共supercell 2兲, and alongc共supercell 3兲. The calculated total energies are then fitted to a model Heisenberg energy TABLE I. Relaxed lattice parameters, local magnetic moment of the Mn and As atoms, and total energies per Mn atom for different spin configurations.
a共Å兲 b共Å兲 c共Å兲 V共Å3兲 u/b v/c d2,1共Å兲 d2,3共Å兲 Mn共B兲 As共B兲 E−EFM共meV兲
⫹ ⫹ ⫹ ⫹ 3.72 6.47 5.58 134.27 0.00 0.00 3.73 3.73 3.43 −0.24 0
⫹ ⫹ ⫺ ⫺ 3.56 6.18 5.81 127.93 0.00 0.00 3.56 3.57 3.10 0.00 62
⫹ ⫺ ⫹ ⫺ 3.55 6.24 5.62 124.54 0.05 0.05 3.10 4.10 3.01 −0.08 17
Es1,s2,. . .=E0−
1 2
兺
i,jsisjJij, 共3兲
where si is the magnetic moment normalized to 1共兩si兩= 1兲 and theJ’s are coupling parameters. Here we neglect four-moment coupling constantsJijkland the small induced mag-netic moment over the As atoms.E0is a constant that can be associated with the energy of a paramagnetic phase. In fact, if all the local magnetic moments are randomly aligned, the contribution coming from兺i,jsisjJijvanishes.
In mean-field theory the Curie temperatureTCfor classi-cal Heisenberg exchanged magnetic moments is
kBTC=
兺
j
J0j/3 =J0/3, 共4兲
wherekB is the Boltzmann constant. The quantityJ0=兺jJ0,j is the sum of the exchange coupling constants of a given magnetic moment with all the other moments. In the follow-ing sections Eq.共4兲is always used to extract Curie tempera-tures, although it is well known that the mean-field approxi-mation overestimatesTC.54
Calculations are performed for all the independent spin configurations of the supercell 1 and for a randomly chosen subset of those of supercells 2 and 3. Thirty-five different configurations of the magnetic moments are used in total. The energies are then fitted by a least-mean-squares fit to the coupling parameters of Eq.共3兲. Since the system is metallic with thedorbitals having finite density of states at the Fermi level, the magnetic interaction is expected to have a long-range character. For the chosen supercells it is possible to extract coupling constants up to the ninth nearest neighbor. The lattice parameters used are approximately those for fer-romagnetic MnAs in theB81structure at the phase transition
temperatureTp= 318 K 共a= 3.71 Å,c/a= 1.54兲.
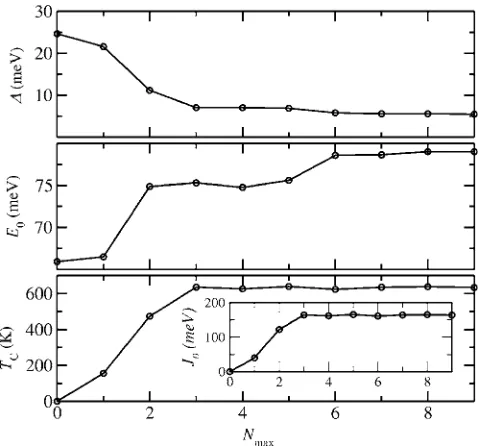
We carefully tested the convergence of our results with the range of the Heisenberg exchange interaction. Figure6 shows the standard deviation⌬of the energies resulting from Eq.共3兲as compared to the calculated DFT energies per Mn atom, the value of E0 per Mn atom, the mean-field Curie
temperatureTC, andJ0 as a function of the number of
cou-pling coefficients,Nmax, included in the fit. The standard de-viation ⌬ decays monotonically, remains roughly constant for Nmax艌3, and then reaches a minimum value of around
5 meV forNmax= 9. This can be considered as the error
re-sulting from neglecting high-moment coupling constants. The value of E0 changes less over the whole range, being something like an average of the energies of the different magnetic configurations.TC reaches a constant value of
ap-proximately 633 K forNmax艌3. This indicates that the main
contribution arises from the first three nearest-neighbor cou-pling constants. The experimental value ofTC for the low-temperature phase lies between Tp= 318 K and Tt= 400 K.
This means that our mean-fieldTCoverestimates the
experi-mental one by a factor between 1.6 and 2.
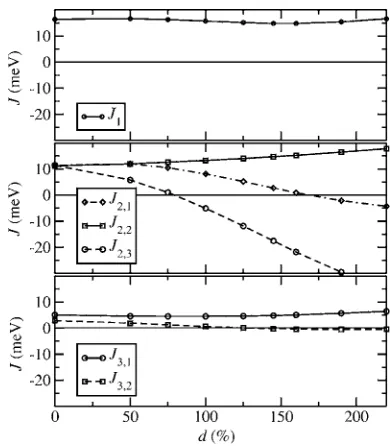
Figure 7 shows the calculated exchange coupling con-stants as a function of the distance for two different fits counting, respectively, third- and ninth-nearest-neighbor cou-pling. The first three exchange constantsJ1,J2, and J3 关see
Fig.8共a兲兴remain nearly unchanged when going from
third-to ninth-nearest-neighbor coupling. Interestingly the cou-pling parameters are positive and therefore ferromagnetic up tod⬃6.5 Å 共fifth-neighbor interaction兲. In what follows we consider only coupling parameters up to third nearest neigh-bors, as they give the main contribution to the properties of the material.
C.B81toB31 distortion atTp
TheB81toB31 structure phase transition at Tp is
inves-tigated by calculating the Heisenberg coupling constants for different distorted cells. We start from B81 with the
experi-mental lattice parameters near Tp 共a= 3.71 Å, b=
冑
3a, c [image:5.612.318.557.55.278.2]= 1.54a, u=v= 0兲 and distort the cell linearly to the B31 structure. The amount of distortion d is given in percent, FIG. 6. Variation of the various exchange quantities as function of the number of coupling coefficients,Nmax, included in the fit.共a兲
Standard deviation⌬of the energies resulting from Eq.共3兲as com-pared to the calculated DFT energies per Mn atom.共b兲E0per Mn
[image:5.612.338.534.553.705.2]atom关Eq.共3兲兴, where the zero of energy is chosen as the energy of the ferromagnetic state.共c兲Mean-field Curie temperatureTC.
FIG. 7. Exchange coupling parameters for Nmax= 3 and Nmax
whered= 0% stands for the lattice parameters of the ferro-magneticB81 cell just belowTp andd= 100% for the para-magnetic B31 cell above Tp 共a= 3.676 Å, b= 1.01
冑
3a,c= 1.556a, u= 2.71⫻10−2b, v= 2.45⫻10−2c兲.23 Calculations are done for distortions between 0% and 220%. Note that the volume decreases with increasing distortion. For these calcu-lations only supercells 1 and 2 are used with a total of 26 different spin configurations. The standard deviation of the fit is approximately constant for all the distortions and is of the order of 5 meV/ Mn.
Figure 8共a兲 shows the Mn atoms of the B81 structure
coupled by first- 共J1兲, second- 共J2兲, and third- 共J3兲
nearest-neighbor interactions. In the distortedB31 structure the three coupling constantsJ1,J2, andJ3 are split into six different
constants due to symmetry loss. While there is still only one J1 coupling, the in-plane J2 splits into three different
cou-pling constantsJ2,1,J2,2, andJ2,3, corresponding to different
distances between the Mn atoms in the hexagonal plane共see Fig. 4兲. Moreover, also the third-nearest-neighbor coupling J3splits into three different constants, although two of them are between Mn atoms separated by approximately the same distance at Tp, and so they are assumed to be identical.
HenceJ3effectively splits only intoJ3,1andJ3,2.
Figure 9 shows the calculated values for the exchange parameters as a function of the distortion. For 0% distortion the values of J2,1, J2,2, and J2,3 are approximately equal,
reflecting the hexagonal symmetry. The values of J3,1 and
J3,2 also should be identical although they differ by about
2 meV共note that in the fit we do not force theB81symmetry, when determining theJ’s for the undistorted structure兲. This can be assumed to be the error over the fit. Additional control fits were also performed for different subsets of the 26 spin configurations. The variation over theJwas of 20%, whereas the variation ofJ0 was always smaller than 6%.
The value ofJ1remains approximately constant for all the
distortions, reflecting the fact that the distance between the quasihexagonal layers remains roughly constant. In contrast the in-planeJ’s change and eventually become antiferromag-netic. In particular the coupling becomes strongly antiferro-magnetic forJ2,1—i.e., for those Mn atoms that get closer in
the hexagonal plane under distortion. Also J2,3, which
couples the Mn atoms increasing their separation, is reduced and becomes antiferromagnetic for large distortions. Finally the coupling parameters J3,1 and J3,2 have only minor changes, with J3,1 becoming weakly antiferromagnetic for
large distortions.
The evolution of the coupling constants with the distor-tion indicates why for the ⫹⫺⫹⫺ and ⫹⫺⫺⫹ spin con-figurations 共see TableI兲, where the spins are antiferromag-netically aligned in the hexagonal planes, the lowest energy is found for theB31 structure. The relaxed structure for both spin configurations is similar to a distortion of about 200%. At this distortion the in-plane coupling constantsJ2,1andJ2,3
become antiferromagnetic, resulting in a reduction of the to-tal energy as compared to the B81 structure for those spin
configurations. In contrast for the⫹⫹⫹⫹and⫹⫹⫺⫺ con-figurations, which have a ferromagnetic alignment of the mo-ments in the hexagonal plane, the B81 structure is stable,
since for that structureJ2,1andJ2,3are positive.
Figure 10 shows the relative change of the mean-field Curie temperature TC共d兲/TC共0兲 for the ferromagnetic state. TC decreases monotonically with increasing distortion. For
100% distortion 共B31 structure at Tp兲 TC共100%兲/TC共0兲
= 0.67, demonstrating that when the phase transition from the B81to theB31 structure occurs, the system in theB31 cell is
already paramagnetic with very little magnetic order. The experimental Curie temperature TCexpt for the hexagonal cell atT=Tp is not known, since the structure changes.
[image:6.612.338.533.53.276.2]Figure10also shows the total energy perB31 unit cell as a function of the distortion in the ferromagnetic共FM兲and in the⫹⫺⫺⫹antiferromagnetic共AF兲configurations. This lat-ter is the antiferromagnetic configuration giving the lowest total energy at its minimum among all the ones calculated along the considered distortion. The figure also shows the FIG. 8. Schematic representation of the atomic positions of the
Mn atoms together with the exchange constants for theB81共a兲and
B31共b兲structures.
FIG. 9. Evolution of the exchange coupling constants when dis-torting the unit cell linearly from theB81structure to theB31 struc-ture. d= 0% represents the B81 structure at Tp= 318 K, d= 100%
represents theB31 structure atTp. A positive共negative兲value ofJ
[image:6.612.114.236.57.230.2]value of E0, the energy of the paramagnetic state 关see Eq.
共3兲兴. The zero in the energy scale is the energy of the ferro-magnetic state ford= 0%.
The ferromagnetic state has its energy minimum for d = 0% and increases parabolically for increasing distortion. This means that the B81 structure is the one with lowest
energy in the ferromagnetic state. In contrast the competing antiferromagnetic configuration has a minimum for about 180% distortion, where the energy is lower than the ferro-magnetic phase. The crossing between the two energy curves occurs at aboutd⬇142%. The ground state of the system is therefore expected to be ferromagnetic below this distortion and to become antiferromagnetic above this distortion.
E0 has a very flat minimum for distorted cells, reflecting
the fact that the total energy increases for the ferromagnetic state, but decreases on average for the antiferromagnetic states. The minimum is found to be at about d⬇100%, which corresponds indeed to the lattice parameters of the paramagnetic state above the phase transition. This is sug-gestive of a structural change from theB81toB31 structure
in correspondence with the onset with the paramagnetic state.
D.B31 toB81distortion atTt
For temperature in betweenTp and Tt the MnAs crystal structure continuously changes from B31 to B81. As
men-tioned in Sec. II the phase transition temperatureTtis usually
identified as the temperature where the susceptibility and specific heat have a maximum. This is at about 398 K. How-ever, the distortion should disappear at slightly higher tem-peratures as pointed out in Ref.24. Therefore, since the exact temperature for this second-order structural phase transition is not known exactly, we introduce an operative definition and assume that the distortion disappears at a temperatureTs, at which the slope of the in-plane lattice constant as a
func-tion of temperaturea共T兲 changes discontinuously 共see Fig. 5兲. According to Fig. 5the lattice constant at Tsisa共Ts兲=˜a
⬇3.699 Å and共a/T兲Ts⬇0. At Ttthe same lattice
param-eter is a共Tt兲⬇3.697 Å, so that the difference in˜a is very
small.
The main reason for the second-order phase transition at high temperatures is related to the lattice thermal expansion. The idea is that upon volume expansion, the ground state of the paramagnetic phase moves towards the hexagonal struc-ture. We verify this hypothesis by calculating the minimum ofE0共E0
min兲
along a distortion of the cell transformingB81to
B31. In the calculation the volume of the cell is kept constant and we repeat the calculation for different volumes. This allows us to evaluate bothE0minand the corresponding distor-tion as a funcdistor-tion of the volume. Since forT⬎Tp MnAs is
always paramagnetic, then the minimum of E0 corresponds
to the stable distortiond0at a given volume. In practice the
change in volume can be described simply by the change in the planar lattice constanta, since both b/a andc/a do not deviate much from their value atTp. Thus we always
con-siderb=
冑
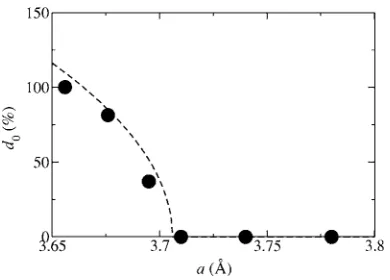
3aandc= 1.556aand the phase transition is inves-tigated as a function ofa only.The equilibrium distortion d0 as a function of a is pre-sented in Fig. 11. Indeed the distortion decreases with vol-ume and it disappears for a between a= 3.695 Å and a = 3.71 Å. Moreover, we find 100% distortion for a ⬃3.66 Å. These values agree rather well with the experi-mental ones, where the distortion disappears at about a共Ts兲
= 3.699 Å and 100% distortion is found ata共Tp兲= 3.673 Å.
In order to interpret these results consider that the distor-tion is symmetric for ±d 关E0共d兲=E0共−d兲兴, and therefore E0
can be expanded in even powers of the distortion, E0共d兲
=r0+r1d2+r2d4. Here ri are parameters to fit to the DFT
calculations. In particular note thatr0 corresponds to the en-ergy of the paramagnetic phase when the crystal is undis-torted; i.e., it has hexagonal structure. In this way the mini-mum of theE0共d兲curve is obtained ford0=
冑
−r12r2 ifr1⬍0,
and ford0= 0 forr1艌0. We now define˜a as the lattice con-stant wherer1= 0. For small distortions the parametersr1and
r2 can then be further expanded around ˜a as r1=r1,1共a−˜a兲
and r2=r2,0+r2,1共a−˜a兲+r2,2共a−˜a兲2. In order to obtain the
[image:7.612.341.536.54.194.2]leading terms in this expansion, we calculate the values ofr0, FIG. 10. Top figure: relative change of the mean-field Curie
temperature关TC共d兲−TC共0兲兴/TC共0兲for the ferromagnetic state.
Bot-tom figure: total energy for oneB31 unit cell for the ferromagnetic configuration 共FM兲, for the ⫹⫺⫺⫹ antiferromagnetic configura-tion共AF兲, together withE0关Eq.共3兲兴, as a function of the distortion
d. d= 0% and d= 100% represent, respectively, the B81 and B31
phases atTp⬇318 K.
FIG. 11. Distortion d0 for the minimum of the paramagnetic
[image:7.612.90.259.57.230.2]r1 and r2 for different lattice constants 共a= 3.656, 3.676,
3.695, 3.71, 3.74 and 3.78 Å兲. We then first calculate˜a and r1,1by mapping r1onto the expansionr1共a兲=r1,1共a−a˜兲, and
with the obtained value of˜a we can then in the same way also calculate the expansion coefficients ofr2. The so
calcu-lated values for the leading terms are ˜a= 3.706 Å, r1,1
= 62.4⫻10−3 meV/ Å, andr
2,0= 1.29⫻10−7 meV共d is given
in percent兲. The equilibrium distortiond0up to first order in
ais then
d0共a兲=␥
冑
a ˜−a
a
˜ ⌰共a˜−a兲, ␥=
冑
˜a r1,12r2,0
, 共5兲
where⌰共x兲 is the Heaviside function. With the values of˜a, r1,1, and r2,0 given above␥= 947 is obtained. The resulting
distortion is presented in Fig.11.
Interestingly, if we use Eq. 共5兲 to fit the experimentally determined distortions at a共Ts兲= 3.699 Å 共d0= 100%兲 and a共Tp兲= 3.673 Å 共d0= 0兲, we obtain ␥= 1184 and ˜a= 3.699,
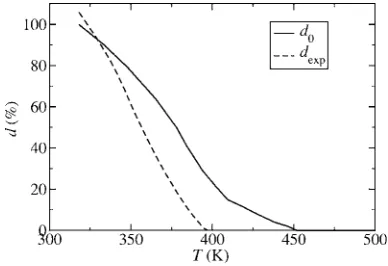
both in good agreement with our calculated values. This sug-gests that the main effects of the distortion to theB31 struc-ture arise from the atomic displacement from the symmetry positions and that small changes of the ratio of the lattice vectors, neglected in our calculations, play only a secondary role. Using the values ␥= 1184 and a˜= 3.699 Å of the two parameters the evolution of the distortion as a function of temperatureTcan be obtained by inserting the data fora共T兲 from Fig.5in Eq.共5兲. The result is shown in Fig.12. It also shows the experimental distortion dexpt obtained from v共T兲 extracted from Fig. 3 of Ref. 10. The main difference be-tween the two curves is that the distortiondexptbecomes zero
at 398 K, whereas in our results this happens only at 450 K. This is due to our choice ofTs= 450 K, which by definition
sets the temperature where the distortion disappears. Close to the phase transition temperature fluctuations play an impor-tant role, so that for very small distortions close to the phase transition the description may not be valid.
By using the computed values ofr0,r1, andr2 the mini-mum ofE0 关E0
min
=E0共d=d0兲兴 is calculated as a function of
the volume of the unit cell, and it is shown in Fig. 13 to-gether with r0. Recalling thatr0 is the energy of the
para-magnetic hexagonal phase, it also can be expanded as a func-tion of the lattice constantr0=⑀0+⑀1共a−a0兲2, wherea0is the
equilibrium lattice constant of the hexagonal phase. This, combined with Eq. 共5兲, gives an expression for the energy minimum as a function of the lattice constanta:
E0min共a兲=⑀0+⑀1共a−a0兲2−⑀
2共a−˜a兲2⌰共˜a−a兲,
⑀2=
r1,12 4r2,0
= 7546meV
Å2 , 共6兲
where⑀0,⑀1, anda0 are to be fitted from the calculations of r0 共Fig. 13兲. The fitted values are ⑀0= 264 meV, ⑀1
= 15 935 meV/ Å2, anda0= 3.65 Å. From Eq.共6兲the energy
minimum is easily found,
amin=a0
冉
1 − ⑀2 ⑀1−⑀2a ˜−a0
a0
冊
, 共7兲
and by using the calculated parameters we estimate amin
= 3.60 Å. Sinceamin⬍a0, we derive the important result that
the distortion allows the volume to be further reduced as compared to the hexagonal phase. Furthermore, the curvature of the energy as a function ofa is
2E 0 min共
a兲
a2 = 2⑀1− 2⑀2⌰共˜a−a兲, 共8兲 which is also reduced by a factor of 2⑀2when the structure is
distorted.
The effect of the thermal expansion on the lattice param-eter can now be modeled as a temperature-dependent posi-tion ofa0,a0=a0共T兲. The change of the lattice constant with
temperature for the distorted phase can therefore be written as
amin T =
⑀1
⑀1−⑀2
a0
T. 共9兲
Since⑀2is smaller than⑀1, the lattice expands with
[image:8.612.339.534.55.196.2]tempera-ture faster for the distorted phase than for the undistorted phase. If the calculated values for ⑀1 and ⑀2 are used, the FIG. 12. Solid line: distortiond0for the minimum of the
para-magnetic ground state as a function of temperature calculated with Eq.共5兲 共with␥= 1184 and˜a= 3.699 Å兲usinga共T兲taken from Fig. 5. Dashed line: experimental distortion extracted fromv共T兲of Fig. 3 in Ref.10.
FIG. 13. Energy expansion coefficientr0andE0,minas a
func-tion of the lattice constant. The dashed line shows⑀0+⑀1共a−a0兲2;
the solid line shows⑀0+⑀1共a−a0兲2−⑀
[image:8.612.76.270.56.189.2]ratio⑀1/共⑀1−⑀2兲is found to be 1.90, which agrees well with
the value of 2.25 extracted from Fig. 5. Near the phase transition—i.e., where d⬇0—phononic effects due to the different curvatures of the energy and fluctuations should be considered. It is especially interesting that the change of the lattice constant with temperature goes to zero near the phase transition temperature.
In the same way as E0 also TC can be expanded as a function of the lattice constant and of the distortion:
TC共a,d兲=TC共a˜兲
冋
1 +Kva−˜a a ˜ −Kdd
2
册
, 共10兲whereKvandKdare parameters andTC共˜a兲is the Curie
tem-perature for the cell with lattice parameter˜a and where the atoms are in the hexagonal positions. The parameters are fitted by a least-mean-squares fit to the calculated values of TC obtained for six lattice constants ranging between
3.656 Å and 3.78 Å and for different distortions. We obtain TC共˜a兲= 573 K, Kv= 6.80, and Kd= 2.62⫻10−5. At d= 100% the relative change of the Curie temperature is TC共a˜,d
= 100%兲/TC共˜a兲= 0.74 and corresponds roughly to the value
of Fig.10. In this case it is slightly larger due to the fact that the volume is kept constant, whereas for the calculations of Fig.10it shrinks with increasing the distortion.
Next we calculate the dependence of the magnetic mo-ment on the distortion and on the unit cell volume. The de-pendence is again expanded to lowest order inaandd:
共a兲=共a˜兲
冋
1 +␣a−˜a a˜ +␣,dd
2
册
. 共11兲We now have different ways of extracting the magnetic mo-ment of the Mn atoms from our DFT calculations. One pos-sibility is to take the total moment of the cell for the ferro-magnetic spin configuration and divide it by the number of Mn atoms. In this way, however, the small induced moments of the As atoms are subtracted from the moment on the Mn. A second possibility is to take the average Mulliken spin population for the Mn atoms. The advantage of this method is that also antiferromagnetic configurations can be used to determine the average moment and the induced moments of the As atoms are accounted for. The drawback, however, is that Mulliken populations are somewhat arbitrary as they depend on the basis set.
By setting˜ato 3.699 Å, the values obtained using the cell moment are 共a˜兲= 3.28B, ␣= 3.28, and ␣,d= −1.15
⫻10−6. Similarly from the average Mulliken population over
all the magnetic configurations we obtain 共˜a兲= 3.42B, ␣= 3.48, and ␣,d⬇0. These results are rather similar to each other. With ␣= 3.28 and ␣,d= −1.15⫻10−6 a
reduc-tion of the lattice constant of 1%, as approximately found at Tp, results in a reduction of the magnetic moment of about
3% and a distortion ofd= 100% results in a reduction ofof about 1%. Both effects therefore reduce the magnetic mo-ment and are of the same order of magnitude.
E. Small distortions of theB81structure
In this section the dependence of TC on the individual
lattice parameters and on the distances between the atoms is investigated for theB81 structure. Our approach is to distort the cell orthorhombically but to leave the atoms in their high-symmetry positions. Apart from a general understand-ing of the phase diagram of MnAs this analysis is useful for predicting the behavior of MnAs when grown on a substrate. For instance when grown on GaAs共001兲 the substrate in-duces strain in MnAs, and the unit cell is slightly orthorhom-bically distorted.1This distortion does not correspond to the orthorhombicB31 structure, since the atoms do not move out of the high-symmetry positions. Moreover, different growth orientations are possible and the Curie temperature varies accordingly.7In addition Ref.8presents experimental results showing that the phase transition temperature Tp changes
when strain is applied to the MnAs film. In that article we have compared our theoretical predictions for the depen-dence of Tp on the lattice distortion with the experimental findings. In this section we refine and expand our previous analysis.
When the cell is orthorhombically distorted the first three nearest-neighbor coupling constants split into five different constants, corresponding to the ones of theB31 cell共Fig.8兲 and with the only exception that nowJ2,1=J2,3. The number
of total energy calculations for the fit of the coupling param-eters is 16. The change ofTCfor each different distortion can
be expressed as a function of the change of each single Mn-Mn and Mn-As distance in the unit cell. This gives
␦TC
TC = ␦J0
J0 =
兺
=15
KN␦d
d , 共12兲 where the sum goes over all five independent distances in the orthorhombic unit cell as defined in Fig.14. The dependence on the angles between the atoms is neglected. N are the multiplicities of each distance d within one unit cell and have the values NMn,1= 4, NMn,2= 4, NMn,3= 8,NAs,1= 4, and
NAs,2= 8. For the evaluation of the coefficientsK, 21
[image:9.612.360.517.59.191.2]rhombic symmetry, however, was preserved. The best fit for Kgives
KMn,1= 6.6, KMn,2= 6.2, KMn,3= 5.9,
KAs,1= − 7.5, KAs,2= − 7.5. 共13兲 The values ofKMn,1and KMn,2 are almost identical, as one
should expect from the symmetry and similarly forKAs,1and KAs,2.
Equation共12兲describes the fact that the change of TC is
the result of an interplay between the change of the Mn-Mn and Mn-As distances. The calculatedKshow that, while an increase in the distance between Mn atoms increasesTC, an increase of the Mn-As distance decreases it. However, note that the two distances cannot be changed independently; thus, the net change in TC depends on the details of the
distortion.
J0 can also be expanded over the orthorhombic lattice
parameters
␦J0
J0
=
兺
i=1 3Ki␦ai
ai , 共14兲 with
Ki=
兺
=1 5
KNai d
d ai,
wherea1=a, a2=b, and a3=c. The change of the distances
between Mn and As atoms is not exactly known for the orthorhombic cell. However, it is easy to show that in first approximation the position of the As atom in the cell does not influenceJ0, since up to first order␦dAs,2= 2␦dAs,1when
moving the As atom inside the cell. Therefore the As atoms can be assumed to remain in the high-symmetry position. Assuming nowKMn,2=KMn,3andKAs,1=KAs,2共as imposed by
symmetry兲, the general form of theKiis
Ka=Kb= 6KMn,2+
96KAs,1 16 + 3c˜2,
Kc= 4KMn,1+
36KAs,1˜c2
16 + 3c˜2 , 共15兲
where˜c=c/a. Using the average between KMn,2 and KMn,3 and˜c= 1.533 this gives
Ka=Kb= 4.9, Kc= − 1.0. 共16兲 Our results clearly show that stretching the unit cell along the basal plane raises Tp 共since Ka⬎0兲, while stretching
along thecaxis lowersTp 共Kc⬍0兲. An increase of the vol-ume without distorting the cell results in an increase of the ferromagnetic exchange interactions and therefore of TC,
since Ka is positive and larger in magnitude than Kc. The results forKa and Kb differ slightly from the ones given in Ref.8, since in that case we did not constrainKato be equal to Kb. If the cell changes only its volume, the expansion corresponds to the one of Eq. 共10兲 with a factor Kv= 2Ka
+Kc= 8.8. We note that this value is somewhat different from
the value of Kv= 6.8 given in Sec. III D. This is due to the
different type of analysis performed in this section, which starts from the dependence of TC on the distances between
the single atoms. The difference is, however, small and can be considered a measure for the error in our results.
IV. DISCUSSION
It is now possible to analyze two peculiar properties of MnAs. The first is the anomalous behavior of the suscepti-bilityas a function of temperature betweenTp andTt. The
second is the fact that although the Curie temperature for ferromagnetic MnAs has to be larger thanTp, theTC extrapo-lated from the susceptibility aboveTtis only 285 K.13In this
section both these features are explained using the depen-dence of the susceptibility on the Curie temperature 关 =共TC兲兴and the strong dependence of the Curie temperature
on the lattice parameters found in the previous sections关TC
=TC共a,b,c,d兲兴.TC共T兲and共T兲are therefore determined us-ing the experimentally measured temperature dependence of the lattice vectorsa共T兲,b共T兲, and c共T兲 and of the distortion d共T兲. This analysis also provides a tool for extracting the parametersKvandKdfrom experimental data.
By generalizing Eqs.共10兲and共14兲the Curie temperature TC共a,b,c,d兲 can be written as
TC共a,b,c,d兲=TC,0
冋
1 +Ka冉
a−˜a a ˜ +
b−˜b b ˜
冊
+Kcc−˜c c ˜ −Kdd
2
册
, 共17兲where we use the fact thatKa=Kband we take the values for Ka and Kc from Eq. 共16兲, while Kd= 2.62⫻10−5 and TC,0
=TC共˜a兲= 573 K are calculated in Sec. III D. The reference
lattice parameters are chosen to be the lattice vectors at Ts
共˜a= 3.699 Å,˜b=
冑
3a˜,˜c= 1.56a˜兲.Similarly to the Curie temperature also the susceptibility is calculated in the mean-field approximation. This is justi-fied forTⰇTC, a condition which is satisfied for
paramag-netic MnAs. The molar susceptibilityM is then given by
M −1
= 1
C0共T−TC兲,
C0=
NAB2g2
3kB s共s+ 1兲. 共18兲
NAis the Avogadro’s number,g⬇2 is Lande’s factor for the
free electron spin,kBis the Boltzmann constant, andsis the
atomic total spin. Note that the susceptibility has an addi-tional temperature dependence sinceTCandsdepend on the temperature through the lattice distortion. However, in what follows we neglect the dependence ofson the lattice param-eters so thatC0is constant over all temperature. An analysis
Similarly to Sec. III D the model is further simplified by assuming thatb/a and c/a are constant above Tp. As indi-cated in Eq.共5兲,d is a function of the lattice constant, d共a兲 =␥
冑
共a˜−a兲/˜a⌰共˜a−a兲. Moreover, we have shown that the ex-perimental distortion as a function of the lattice constant is well reproduced when␥= 1184. Therefore it is now possible to expressTCandM−1
as a function of the lattice constanta only:
M−1共a兲=
1 C0
冋
T−TC,0
冉
1 +关Kv+Kd␥2⌰共˜a−a兲兴 a−˜aa ˜
冊
册
,共19兲
whereKv= 2Ka+Kc= 8.8. This equation shows that if the lat-tice expands strongly with temperature,M−1decreases.
For temperatures betweenTpand about 390 K, as well as
aboveTs, a increases approximately linearly with
tempera-ture共see Fig.5兲and can therefore be written as
a共T兲=a共T0兲
冋
1 +␣T−T0
T0
册
, 共20兲
where the experimental values for the coefficients are T0,+
=Ts= 452 K, a共Ts兲=˜a= 3.699 Å, and ␣+= 0.0126 for tem-peratures aboveTs共the index+ denotes the high-temperature region aboveTs兲 andT0,−=Tp= 318 K,a共Tp兲= 3.673 and␣−
= 0.0284 for temperatures betweenTp and about 390 K 共the
index “⫺” denotes the intermediate temperature region兲. By inserting Eq. 共20兲 into Eq. 共19兲 we obtain for the high-temperature region aboveTs:
M−1共T兲=
1 Ceff
共T−TC,eff兲, 共21兲
with
Ceff=
1
1 −Kv␣+
TC,0
Ts C0,
TC,eff=
1 +Kv␣+
1 −Kv␣+TC,0 Ts
TC,0. 共22兲
TC,effandCeffare the experimentally accessible quantities for
the high-temperature susceptibility, and due to the expansion of the lattice, they are different from TC,0 andC0. The
ex-perimentally measured values are TC,eff= 285 K and Ceff
= 3.12⫻10−5 m3K,14 which corresponds to an effective magnetic moment of 3.57B. FromCeffandTC,effthe values ofTC,0=TC共˜a兲 andC0can now be obtained:
C0=
1 −Kv␣+
1 −Kv␣+
冉
1 −TC,eff
Ts
冊
Ceff,
TC,0=
1
1 −Kv␣+
冉
1 −TC,eff
Ts
冊
TC,eff. 共23兲
All the variables on the right-hand side of Eq.共23兲 can be obtained from experiments exceptKv. For small Kv the
dif-ference between TC,0 and TC,effis proportional to Kv. Since
Tsis larger than the experimental value ofTC,eff, the effect of
the thermal expansion of the hexagonal structure is a reduc-tion of the slope of the inverse susceptibility as a funcreduc-tion of temperature, as well as a reduction of the extrapolated Curie temperature as compared to the real Curie temperature.
In the region where linear expansion holds the slope of the inverse susceptibility aboveTtis
M,+−1
T = 1 C0
冉
1 −Kv␣+
TC,0
Tt
冊
, 共24兲
whereas for in the intermediate temperature region aboveTp it is
M,− −1
T = 1 C0
冉
1 −共Kv+Kd␥2兲␣−
a0
a ˜
TC,0
T0,−
冊
. 共25兲
In both regions there is a reduction of the slope due to the expansion of the lattice. However, the reduction is much larger for M,− than for M,+, since there is the additional
term proportional to Kd due to the distortion and also ␣−
⬎␣+. As a rough approximation it can be assumed that
共a0TC,0兲/共˜Ta 0,−兲⬇1, so that
M,−−1
T becomes negative for
共Kv+Kd␥2兲␣−⬎1. 共26兲
The values of ␣− and␥ are determined experimentally and describe how the structure changes with temperature, whereasKvandKddescribe howTCvaries for distorted cells.
By using our calculated values for Kv and Kd we obtain
共Kv+Kd␥2兲␣−= 1.29. This is indeed larger than 1. Therefore
we do predict a negative slope for the inverse susceptibility in the intermediate-temperature region. With the value for ␥= 947 estimated in Sec. III D we obtain 共Kv+Kd␥2兲␣−
= 0.92, which is still smaller than 1. This is due to the under-estimation of the distortion as compared to experiments by using ␥= 947. With ␥= 1186 the reduction of the distortion with increasing lattice constant is large enough to obtain a negative slope of the inverse susceptibility, whereas␥= 947 underestimates the reduction of the distortion, and so the slope of the inverse susceptibility is reduced but not to the point to make it negative.
Finally we will extract the values forKvandKdfrom the experimental behavior of the Curie temperature. Since the ratio betweenKaandKccannot be obtained from the thermal properties of MnAs, it is therefore assumed that Kc/Ka = −1 / 4.9⯝−0.2 is fixed and corresponds to our calculated value. For the hexagonal cell共d= 0兲, Eq.共17兲reads
TC共a,c兲=TC,0
冋
1 +Kv冉
kaa−˜a a ˜ +kc
c−˜c c
cell is hexagonal; therefore, it cannot be assumed that the ratio betweenc anda is constant since it changes abruptly from 1.533 to 1.556 atTp. By using the expression forTC,0
from Eq.共23兲we obtainKv:
Kv=
TC共a,c兲
TC,eff
− 1
␣+
冉
TC共a,c兲
TC,eff
−TC共a,c兲 Ts
冊
+kaa−˜a a ˜ +kc
c−˜c c ˜
. 共28兲
As reference Curie temperature the extrapolated value to room temperature is used, which can be estimated to be about TC共a= 3.724 Å ,c= 1.533a兲= 360 K. By inserting the
experimental values for the parameters on the right-hand side of Eq.共28兲we obtainKv= 18.1. This is about twice as big as our predicted value. The disagreement may partly be due to the fact that the ratio betweenKcandKa has been fixed for our calculated value. By inserting this value for Kv in Eq.
共23兲 we obtain TC,0= 311 K, the Curie temperature for the
lattice parameters atT=Ts.
In order to extractKd from experiments we use the rela-tive change in the slope of the inverse susceptibility around Tt. This is, according to Eqs.共24兲and共25兲,
M,+ −1
T − M,−
−1
T M,+−1
T
= 1 −
1 −共Kv+Kd␥2兲␣−
a0 a ˜
TC,0 T0
1 −Kv␣+
TC,0
Tt
, 共29兲
and increases with increasingKvandKd. All the variables in
this equation can be derived from the experimental measure-ments, exceptKvandKd. Experimentally different values are
found for the relative change of the slope关left-hand side of Eq.共29兲兴.24,55–57These are all of the order of 1.44. By using this value for the relative change of the slope and the previ-ously calculated value Kv= 18.1, Kd is found to be 1.78
⫻10−5. This value agrees approximately with our predicted value of 2.62⫻10−5.
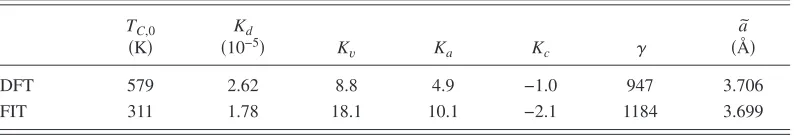
In conclusion, TableIIsummarizes the parameters calcu-lated in this article, by comparing ourab initio results ob-tained from the DFT calculations and the Heisenberg model,
with the results obtained by fitting to the experimental data. In general the value obtained from theab initiocalculations agrees with the best fit to experiments, although the DFT results underestimateKv and overestimateKd.
V. CONCLUSIONS
We have investigated, by means of ab initio electronic structure calculations, the magnetostructural properties of MnAs. The stable structure for the ferromagnetic state is found to be theB81structure. However, if antiferromagnetic
alignment in the hexagonal plane is imposed, theB31 struc-ture becomes more stable. By fitting the DFT total energies of different magnetic configurations to a Heisenberg-type en-ergy it is shown that the main contributions to the physical properties originate from the exchange coupling parameters up to the third nearest neighbor. The Curie temperature was calculated in the mean-field approximation, with values ap-proximately twice as large as the experimental ones.
The main assumption of the phenomenological model of Bean and Rodbell11 that the ferromagnetic exchange cou-pling parameters increase when the volume is increased has been confirmed 关Eq. 共16兲兴 using this analysis. However, it has been shown that the exchange interactions depend not only on the volume, but that the orthogonal distortion to the B31 structure plays an important role. For the experimentally observed distortions some of the in-plane exchange coupling coefficients become antiferromagnetic. This is the reason for the stability of theB31 structure for those configurations of the magnetic moments that have an antiferromagnetic com-ponent in the hexagonal plane.
Furthermore, it has been shown that for paramagnetic states theB31 structure is stable at small volumes, while the B81 structure is stable above a critical lattice constant of
about 3.7 Å. This explains the second-order phase transition at Tt, since at that temperature the lattice constant crosses this critical value.
The Curie temperature has been expanded as a function of the lattice vectors and of the amount of distortion. An in-crease in the volume leads to an enhancement of the Curie temperature, while an increase of the distortion leads to a reduction. With these results in hand the increase of the sus-ceptibility betweenTpandTthas been explained as the result
[image:12.612.108.505.94.162.2]of the increase of the Curie temperature due to the change of the structure from B31 to B81 and to the increase of the volume. By using the experimental variation of the lattice parameters with rising temperature the susceptibility is TABLE II. Main parameters used in the description of the phase diagram of MnAs. We compared results
obtained fromab initiocalculations and Heisenberg model共DFT兲, with those of the best fit of the experi-mental properties共FIT兲.
TC,0
共K兲
Kd
共10−5兲 K
v Ka Kc ␥
a ˜
共Å兲
DFT 579 2.62 8.8 4.9 −1.0 947 3.706