Abstract— As a tourist place, Indonesia is supported by its beautiful natural scenaries and unique cultures. Actually most of Indonesia incomes came from tourism sectors. Padang as the administrative center of West Sumatra is one of tourism places in Indonesia. Unfortunately, all the facilities and touris actractions here need improvement, for example the hotels. Hotels in Padang need attention on the performance management system. One of the them is Premier Basko Hotel. This hotel depends on profit targets and classification of IHRA (Indonesian Hotel & Restaurant Association). For the increasement of this hotel, SWOT (Strength, Weakness, Opportunity, Threats) analysis and balanced scorecard method were applied. It began with the strategic information gathering based on interviewing the company, then continue processing it into a questionnaire which based on SWOT research. At this point, it is known that Premier Basko Hotel is in quadrant II (strength-threat) SWOT analysis diagram. So, this hotel needs to implement a diversification strategy. It also has 14 types of alternative strategies with strategic goals, 14 factors on Critical Success Factors (CSF), 38 indicators on Key Performance Indicators (KPI), and 38 pieces forms of performance management system. All of these are as the form of guidelines for the performance management system Premier Basko Hotel.
Index Terms— Hotel, KPI, Performance Management System, SWOT-BSC
I. INTRODUCTION
NDONESIA’S beautiful natural views and cultural diversities are the advantages that Indonesia has to be a tourist place. As a tourist place, it is going to contribute greatly to the nation’s economy.
West Sumatra as part of Indonesia tourism has to provide facilities and tourist attractions and this is the role and responsibility of the central government. Through interviews with the Licensing to The Tourism Section Head of Culture and Tourism of Padang, it is known that the attractiveness of tourism in Padang is the mix of natural shades to legend, cultural attractions, sports interests, and supported with a taste of traditional Minangkabau food that has been widely recognized by the world. The combination can be encountered on various objects and attractions such as Air Manis Beach, Caroline Beach, Nirwana Beach, Siti Nurbaya Festival, Dragon Boat Festival and Tour of The Batur. The presence of food such as rendang, beef jerky
Manuscript received January 8, 2015; revised February 1, 2015. Difana Meilani is a lecturer in Industrial Engineering Department, Faculty of Engineering, Andalas University, Padang, West Sumatera, Indonesia (e-mail: difana.meilani@ gmail.com and [email protected]).
Ilham Anugrah was with Andalas University, Padang, West Sumatra, Indonesia. (email:[email protected])
and various chips Sanjai, are the tourist attractions of Padang. So it can be concluded that tourism sector is the focus of development and the biggest income of Padang.
Realizing tourism as an economic power of Padang, revamping and improving the assessment of development of various objects are needed. One of the objects is the hotels. Hotels are included as a primary means of supporting tourism activities. From interviewing IHRA executive director of West Sumatra, Elvis Syarif, he said that, the hospitality industries like hotels need a guidance for internal performance improvement.
Premier Basko Hotel is one of the 52 unit hotels in Padang [3]. This Hotel is located at Jalan Prof. Dr. No. Hamka. 2A Padang. It has 180 rooms with 9 units of different types, 9 units meeting rooms with different capacities, restaurant with international cuisine, lounges, swimming pool, laundry, as well as a wide range of facilities at the business center. Actually, it is the only 5 star hotel in Padang. This hotel is applying SWOT (Strength, Weakness, Opportunity, and Threat) in its effectiveness operational.
Rangkuti said that SWOT is a form of long-term development plan in the streamline operations, based on the opportunities, threats, strengths and weaknesses of the company [9], [20]. The combination of SWOT analysis of the balanced scorecard method, which was introduced by Robert S. Kaplan and David P. Norton in 1992 is able to give a clear description for the improvement and development direction of the company [11].
So the design of the performance management system generated from the combination of these two methods can be a guide for Premier Basko Hotel in particular, and for industry hospitality in general.
II.REVIEW OF RELATED LITERATURE
A.Hotel
There are several definitions of a hotel. The following is two of them.
1.Hotel Proprietors Act, 1956 said that hotel is a company managed by its owner, by providing services in food, beverages, and room for people who are travelling, and they are able to pay amount of money based on the service they got without any special agreement [8].
2.Endang, 2013 said that Hotel is a commercially organized lodging which meets the government’s requirements by providing services in food, beverage, and other services [4].
Endang classified a hotel which is [4]: 1.Based on the layout of the building
The Design of Hotel Performance Management
System in Padang
Difana Meilani, Ilham Anugrah
a. Resort hotel: a hotel which is located in the attractions area.
b. City hotel: a hotel which is built in urban areas. c. Airport hotel: a hotel which is built adjacent to the
airport.
d. Urban hotel: a hotel which is built in rural areas. e. Suburb hotel: a hotel which is built in the suburb. 2. Based on long time stay
a. Transit hotel: a hotel that is used for one or two nights. b. Resident hotel: a hotel that is used as a residence. c. Semi resident hotel: a hotel that is used as a temporary
shelter.
3. Based on room tariff
a. American plan: hotels with room rates + the cost of three meals.
b. European plan: hotels with room rates which do not include the cost of eating.
c. Modified American plan: hotels with room rates + the cost of two meals.
d. Continental plan: hotels with room rates which include continentall breakfast basis.
e. Bermuda plan: hotels with room rates which include American breakfast.
4. Based on the number of hotel rooms
a.Small hotel: a hotel with number of rooms maximum 28 units.
b.Medium hotel: a hotel with number of room around 28-299 units.
c.Large hotel: a hotel with number of rooms more than 300 units.
B.Performance Management
There are several definitions of performance. Rizki and Mutia shows that performance is a whole view of the condition of a company in a certain period of time, and it is the result of an achievement from a company operational activities by processing the available resources [22]. While Wibowo said that performance is the result of a strong work associated with the strategic objectives of the organization, customer satisfaction and contribute to the economic [23].
Performance management is an agreement-based interactive control model [18]. Performance measurement is an essential part of the performance management. By measuring, people transform complex reality into simplified numerical concepts that can be communicated easily and acted upon. According to Lebas, the simplification of reality by measuring is the prerequisite of successful management [15]. Similarly, Bititci et al and Forza, argue that performance measurement is at the heart of the performance management process and it is of critical importance to the effective and efficient functioning of performance management [2], [5].
C.Balanced Scorecard
A Robert S. Kaplan and David P. Norton agreed that Balanced Scorecard is one measurement set for getting a quick and whole view of a business based on the financial which contains the finished programs in order to complement the size of the non-financial and operational, customer satisfaction, internal processes, innovation and
size of operations of organizational improvement activities, in order to spur future financial performance [13].
Balance scorecard has four terms, as follows: 1.Financial and nonfinancial indicators 2.Past, present and future indicators 3.Internal and external indicators 4.Cause and effect indicators
The balanced scorecard has four perspectives [12]. According to Kaplan and Norton, they are:
1.Finance 2.Customers
3.Internal business processes 4.Learning and growth
D.SWOT
Rangkuti said that SWOT stands for strength, weakness, opportunity and threat. It is a kind of company development which derived from a long term planning in creating effective operational activities based on SWOT [1]. TOWS’ matrice is a way for brainstorming in order to create several alternative or strategies for the company [6], [7].
E.SWOT - Balanced Scorecard
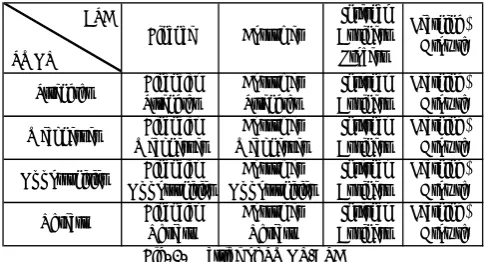
[image:2.595.305.548.416.547.2]The implementation of SWOT - balanced scorecard in a company can produce speed and ease monitoring and controlling a business [23]. Conjoining the SWOT matrix with the balanced scorecard (BSC) makes a systematic and holistic strategic management system [16]. Here is a picture of a SWOT matrix - the balanced scorecard:
Fig. 1. Matrice of SWOT-BSC
F.CSF and KPI
Critical Success Factors (CSF) are the essential elements for the success of the company in implementing the strategy [19]. CSF is determined based on the process of collecting data in order to reach the goals of every stakeholder.
Once CSF is known, the Key Performance Indicators (KPIs) can be formulated. Here is some characteristics of CSF:
1.Easy to understand 2.Can be optional choice
3.Related to balanced scorecard perspective 4.Focus on specific areas
Key Performance Indicators (KPI) is a set of measurements that focuses in every critical performance aspect for the success of a company in present and future [19].
Strengths Financial
Strengths
Costumer Strengths
Internal Business
Learning & Growth
Weaknesses Financial Weaknesses
Costumer Weaknesses
Internal Business
Learning & Growth
Opportunities Financial Opportunities
Costumer Opportunities
Internal Business
Learning & Growth
Threats Financial
Threats
Costumer Threats
Internal Business
Learning & Growth Internal
Business Process
Learning & Growth
Finance Costumer
BSC
III. RESEARCH METHOD
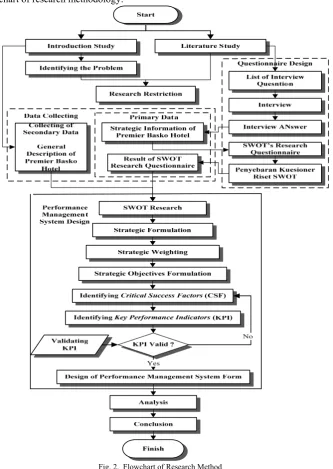
[image:3.595.137.471.85.555.2]Below is the flowchart of research methodology:
Fig. 2. Flowchart of Research Method
IV. RESULT AND DISCUSSION
A.Data Collecting
The data of the internal and external aspects (strategic information) of Premier Basko Hotel were obtained from the formulation of the questions list and from the interview. The results were then written in SWOT research questionnaire. The questionnaire was distributed to 8 respondents that responsible in Hotel manageria. They are the General Manager, Head of the Department of Human Resources, Accounting, Housekeeping, Sales & Marketing, Front Office, Food & Beverage and Engineering. From the questionnaires, we can know the average existing condition from respondents of the hotel and the average urgency handling also from the respondents. From this, the rank or the handling priority can be determined and it is shown in
B.Data Processing
1.Research of SWOT
The position of the hotel which is based on the difference between the average values of accumulative aspects of internal and external and with the median value (value of 3). The position of the hotel is in quadrant II (strength-threats) with the coordinate (0.17, -0.19).
2.Strategic Formulation
WO (Weakness Opportunities), Strengths Threat (ST) and WT (Weakness Threats). It is shown in Table II Appendix 3.Strategic Weighting
Weighting strategy is done by assessment (in value range 1-5) for each alternative strategy which is based on the relationship of each indicator in relation to the external and internal aspects. The highest weight is 368 from the ST strategy and the strategic alternatives is strengthening the characteristic of the hotel.
4.Formulation of Strategic Objectives and Identifying Critical Success Factors
Formulation of strategic objectives is done by classifying each alternative strategy into four perspectives in balanced scorecard. Critical Success Factors (CSF) are obtained from the critical factors of each hotel strategy objectives. The strategic objectives and the Critical Success Factors of Premier Basko Hotel are as shown in Table III Appendix.
5.Key Performance Indicators of Identifying and Validating The valid Key Performance Indicators (KPI’s) in the Premier Basko Hotel is shown in Table III Appendix 6.Designing form of Performance Management System
There are 38 forms of Performance Management System that have been designed for the Premier Basko Hotel
V.CONCLUSION
From the research, it is concluded that Premier Basko Hotel is currently in kuadran II (strength-weaknesses) SWOT analysis diagram, so the hotel needs to implement diversification strategic. It is a strategic for collecting all internal powers and avoiding all company external threats in order to get all the long term opportunity. This research also produces 14 strategic alternatives for Premier Basko hotel. Furthermore, this Hotel also has 14 Critical Success Factors (SCF) and 38 Key Performance Indicators (KPI), and 38 forms of performance management system which can be a guidance for Premier Basko Hotel in improving company performance management system quality.
APPENDIX A
Appendix A shows the table of the Existing Condition and urgency handling from the respondents of Premier Basko Hotel, table of TOWS Matrix at Premier Basko Hotel and also table of Strategic Objectives, Critical Success Factors and Key Performance Indicator of Premier Basko Hotel
REFERENCES
[1] Arslan A, Adeel R, Muhammad S, Hanan I, “A Conceptual Framework On Evaluating SWOT Analysis As The Mediator In Strategic Marketing Planning Through Marketing Intelligence”,
European Journal of Business and Social Sciences, Vol 2, No 1, pp
91-98, April 2013.
[2] Bititci, U.S., Carrie, A.S. and Mcdevitt, L., “Integrated Performance Measurement Systems: a Development Guide”, International Journal of Operations & Production Management, Vol. 17, No. 5 -6, 1997,
pp. 522- 534.
[3] IHRA (Indonesian Hotel & Restaurant Association) West Sumatera. Data of Member Accomodation in Padang : IHRA West Sumatera 2013.
[4] Endang, Module of the Process of Establishing a Business trip for SMK and MAK, Erlangga. 2013.
[5] Forza, C. and Salvador, F., “Assessing Some Distinctive Dimensions of Performance Feedback Information in High Performing Plants”,
International Journal of Operations & Production Management, Vol.
20, No. 3, 2000, pp. 359 - 385.
[6] Gomatesh M. Ravanavar, Dr. Poornima M. Charantimath, Strategic Formulation Using TOWS Matrix – A Case Study, International
Journal of Research and Development, Volume 1, Issue 1, 2012.
[7] Heinz Weihrich, "Analyzing the Competitive Advantages and Disadvantages of China with the TOWS Matrix - An Alternative to
Porter's Model" in Ralph Berndt, ed. Innovative Management,,
Berlin: Springer Verlag, 2000, pp. 191-205.
[8] Hotel Proprietors Act 1956 (4 & 5 Eliz. 2 c.62), Government of Gibraltar. Available: www.gibraltarlaws.gov.gi.
[9] Houben G., Lenie K., Vanhoof K., “A knowledge-based SWOT-analysis system as an instrument for strategic planning in small and medium sized enterprises,” Decision Support Systems, pp.125–135,
1999, Elsevier Science B.V.
[10] Ittner, C., Larcker, D. and Randall, T., “Performance Implications of Strategic Performance Measurement in Financial Service Firms”,
Accounting, Organizations and Society, Vol.28, No.7 - 8, 2003,
pp.715 – 741.
[11] Kaplan, Robert S., and David P. Norton. The Balanced Scorecard:
Translating Strategy into Action. Boston: Harvard Business School
Press, 1996.
[12] Kaplan R.S., Conceptual Foundations of the Balanced Scorecard, Harvard Business School, 2010.
[13] Kaplan, R. S., and David P. N. Using the Balanced Scorecard as a
Strategic Management System, Boston: Harvard Business School
Press, 2005.
[14] Kerssens - Van Drongelen, I. C. and Fisscher, O. A. M., “Ethical Dilemmas in Performance Measurement”, Journal of Business Ethics,
45 (1 - 2), 2003, pp: 51 - 63.
[15] Lebas, M.J., “Performance Measurement and Performance Management”, International Journal of Production Economics, Vol. 41, No. 1 - 3, 1995, pp. 23 - 35.
[16] Lee S.F, Andrew S.O.K, “Building balanced scorecard with SWOT analysis, and implementing “Sun Tzu’s The Art of Business Management Strategies” on QFD methodology”, Managerial Auditing Journal. Vol. 15 Iss: 1/2, pp.68 – 76, 2000.
[17] Lynch, R.L. and Cross, K.F., Measure Up - The Essential Guide to Measuring Business Performance, Mandarin, London, 1991. [18] Matti Salminen and Marja-Leena Viitala, Handbook on Perfomance
Management, Governance and Accountability, Ministry of Finance,
April 2006, pp 22.
[19] Moeheriono. Application Planning and the Development of Key Performance Indicators (KPI) for business and public. Jakarta: Rajawali Pers. 2012.
[20] Rangkuti, Freddy. SWOT Analysis Technique in Business Case. Jakarta: PT Gramedia Pustaka Utama. 2009.
[21] Rangkuti, Freddy. SWOT Balanced Scorecard: The Technique of Arranging Effective Strategies and the Way to Handle Performances and Risks. Jakarta: PT Gramedia Pustaka Utama. 2011.
[22] Rizki, Muthia. Balance Scorecard as a Means of the Assessment of Performance on the Royal Hotel Ribbon. Universitas Lancang Kuning, Pekanbaru. 2011.
APPENDIX A
TABLE I.
EXISTING CONDITION AND URGENCY HANDLING FROM THE RESPONDENTS OF PREMIER BASKO HOTEL
Aspect No. Indicator
Respondent Average for Existing Condition
Respondent Urgency Handling
Average Rank
In
tern
al
1 Hotel cash flow 3.00 2.25 10
2 Hotel profitability 3.63 2.25 11
3 The role of hotel rooms in hotel profitability 3.88 2.38 8
4 The role of FB asset in hotel profitability 2.38 3.00 1
5 The role of MICE asset in hotel profitability 3.13 3.00 2
6 Empowerment of FB & MICE asset 2.75 3.00 3
7 Development of hotel facilities 3.00 2.00 16
8 Hotel services 3.25 1.88 19
9 The quick response and hotel service hours 3.25 1.88 20
10 Procurement creativity of events, such as : new year, etc. 3.25 2.00 17
11 Technology of the hotel 3.25 2.25 12
12 Human resources professionality in hotel 3.38 2.25 13
13 Organizational climate of hotel 3.13 1.88 21
Ex
tern
al
1 Investors' role toward the hotel 3.00 2.00 18
2 Bangking's role toward the hotel 3.00 2.75 5
3 Government's role toward the hotel 2.75 2.38 9
4 The influence of the tariff war between hotels 2.88 2.88 4
5 Padang Tourism 3.25 2.13 14
6 The arrival of customers (tourists) 3.13 2.75 6
7 The development of tourism in Padang 2.25 2.75 7
8 The presence of an apartment or condominium 2.25 2.13 15
TABLE II.
MATRIX OF TOWS AT PREMIER BASKO HOTEL
Stre ngth (S) We akne ss (W)
1. The role of hotel rooms in hotel profitability 1. The role of Food & Beverage (FB) asset in hotel profitability
2. Hotel profitability 2. The role of Meeting Incentive, Convention & Exhibition (MICE) asset in hotel profitability 3. Human resources professionality in hotel 3. Enpowerment of FB & MICE asset 4. Organizational climate of hotel 4. Development of hotel facilities 5. Hotel services 5. Hotel cash flow
6. The quick response and hotel service hours 7. Procurement creativity of events, suchs as : new year celebration, christmas, etc
8. Technology of the hotel
Opportunitie s (O)
1. Padang Tourism 1. Increasing the number and quality of hotel rooms (S1,S2,S5,S6,O1,O2,O3,O4,O5&O6)
1. Improving asset quality of hotel FB (W1,W3,W4,O1,O2,O3,O4,O5&O6) 2. The development of
tourism in Padang
2. Inproving the quality of hotel services (S1,S2,S3,S4,S5,S6,O1,O2,O3,O4,O5&O6)
2. Improving asset quality of hotel MICE (W2,W3,W4,O1,O2,O3,O4,O5&O6) 3. The arrival of
customers (tourists)
3. Improving the professionality of hotel human resources (S3,S4,S5,S6,O1,O2,O3,O4,O5&O6)
3. Increasing the promotion of FB & MICE asset of the hotel
(W1,W2,W3,O1,O2,O3,O4,O5&O6) 4. Government's role
toward the hotel
4. Enhacing procurement creativity of events (S2,S3,S7,O1,O2,O3,O4&O5)
4. Developing hotel facilities (W4,O1,O2,O3,O4,O5,O6) 5. Investors' role toward
the hotel
5. Developing technologies owned by hotels (S2,S8,O1,O2,O3,O4,O5&O6)
5. Improving cash flow management systems of the hotel (W5,O5&O6)
6. Bangking's role toward the hotel
6. Increasing hotel promotion
(S1,S2,S3,S5,S7,S8,O1,O2,O3,O4,O5&O6)
Thre ats (T)
1. The influence of the tariff war between hotels
1. Establishing cooperation and communication between the hotels (S3,S4,T1&T2)
1. Developing assets variations and other services of the hotel (W3,W4,T1&T2) 2. The presence of an
apartment or condominium
2. Strengthening the characteristics of the hotel (S1,S2,S3,S5,S6,S7,S8,T1&T2)
Strate gic Alte rnative s
Strate gic Alte rnative s Matrix TOWS of Pre mie r Basko Hote l
Inte rnal
TABLE III.
STRATEGIC OBJECTIVES,CSF AND KPI OF PREMIER BASKO HOTEL
Balanced Scorecard Pers
pective Strategy Strategic Objectives Critical Success Factors (CSF) Key Performance Indicator (KPI)
Finance
Increasing the number and
quality of hotel rooms Increased profit hotel The level of hotel profits
Revenue percentage of hotel Profit percentage of hotel
Increasing hotel promotion Increased number of hotel guests arriving in the hotel
The number of hotel guests arriving in the hotel
Percentage of hotel guest arrivals (customer)
Increasing the promotion of FB & MICE asset of the hotel
Increased number of guest arriving in hotel FB&MICE
The number of guest arriving in hotel FB&MICE
Percentage of customer arrival of hotel FB
Percentage of customer arrival of hotel MICE
Establishing cooperation and communication between the hotels
Stability sales price of hotel rooms
The level of hotel room sales
Percentage of hotel room sales Stability of sales price of hotel rooms
Improving cash flow management systems of hotel
Improved cash flow management system of hotel
The management of hotel
financial cash flow Cash flow of the hotel
Custom
er
Strengthening the characteristic of hotel
Strengthened the brand image
of the hotel The brand image of hotel
Market share of hotel guest Amount of new hotel guest Market share of hotel FB customer Amount of new hotel FB customer Market share of hotel MICE customer
Amount of new hotel MICE customer
Developing hotel facilities
Increased hotel guest satisfaction toward hotel facilities
The satisfaction level of hotel guest toward hotel facilities
Satisfaction level of guest on hotel facilities
Improving the quality of hotel services
Increased hotel guests satisfaction toward hotel services
The satisfaction level of hotel guest toward hotel services
Satisfaction level of guest on hotel service
Frequency of hotel guest complaint Service time of hotel guest Loyality level of hotel guest
Improving asset quality of hotel FB
Increased customer satisfaction of FB hotel
The satisfaction level of customers FB hotel
Satisfaction level of hotel FB customer
Frequency of hotel FB customer's complaint
Service time of hotel FB customer Loyality level of hotel FB customer
Improving asset quality of hotel MICE
Increased customer satisfaction of MICE hotel
The satisfaction level of customers MICE hotel
Satisfaction level of hotel MICE customer
Frequency of hotel MICE customer's complaint Service time of hotel MICE customer
In
tern
al Bu
sin
ess
Process
Developing assets variations and other services of the hotel
Improved services asset variation of hotel
The innovation level of hotel service assets
Amount of new service asset of hotel
Level of hotel facilities development Enhancing procurement
creativity of events
Increased creativity procurement events
The creativity level of
procurement events Amount of hotel procurement event Developing technologies
owned by hotels Developed hotel technology
The technology level owned by hotel
Level of hotel technological development
L
ear
ning
&
Gr
owth
Increasing the professionality of hotel human resources
Increased professionality of hotel human resources
The profesionality level of hotel human resources
The Absence of hotel human resources on working
Frequency of human resource fault on working
Frequency of work accident Amount of hotel human resource with good performance Frequency of training on hotel human resources
Amount of human resources with an increasing performance after training
Frequency of fault of human resources