Abstract— The ventricle is part of the brain filled with cerebrospinal fluid (CSF). The ventricle shape and volume are used to diagnosis patients who have brain disease because some brain diseases will cause the change of the ventricle shape or volume. It is very useful to detect any changes in an early stage. This paper proposes an algorithm for automatic segmentation of the ventricle from CT brain images. The process starts with normalizing CT brain images and extracting the region of interest using profile of gray level. We apply Gray-Level Co-occurrence Matrices (GLCMs) for texture classification. The proposed algorithm segments area of CSF that gets from classifying texture by using GLCM. Finally, the ventricle is evaluated with the hand-drawn ground truth from a neurologist. The algorithm shows very promising result.
Index Terms— CT Brain Image, Ventricle, Segmentation,
Medical Image Processing, GLCM
I. INTRODUCTION
edical image processing playsa vital role for enabling physicians to make accurate diagnosis. It can select anatomical structures of interest or abnormal organs that response to particular diseases (e.g., ventricle from neuroimages, optic disc of eye images or blood vessels), or abnormalities corresponding to particular diseases. Various techniques have been proposed, aiming to perform medical image processing effectively.
The ventricle system is a part of the brain that is filled with cerebrospinal fluid (CSF), a watery solution that provides physical and nutritional support to the brain. CSF is produced by modifying the choroid plexus found in all components of the ventricle. Many brain diseases are caused by changing the ventricle shape or volume. For example, patients having normal pressure hydrocephalus (NPH) have an abnormal accumulation of CSF in the ventricle, which results in expansion of the ventricle [1]. In Figure 1,
ventricles are visible as central hyper-intense regions for a healthy control. In clinics, the volume or shape of ventricles is used qualitatively or quantitatively in the diagnosis of NPH.
In medical laboratory, segmenting a ventricle boundary is time-consuming, because physicians have to draw regions of ventricle in every slice of CT stack images. Then they use
Manuscript received April 10, 2014; This work was supported Thammasat University's Biomedical Engineering Research center.
B. C., P. A., and B. U. Authors are with Sirindhorn International Institute of Technology, Thammasat University, Thailand (e-mail: [email protected], [email protected], and [email protected], respectively).
all slice of ventricle region to interpolate the ventricle and approximate the volume by using voxel-size that the CT machine attached when finished CT scanning. Since the physician cannot diagnose or provide treatment immediately, automated segmentation procedures are therefore necessary for diagnosing any brain diseases.
Many prior researches have proposed an algorithm for measuring a ventricle volume. Most of researches applied their techniques in MR brain images, whereas CT brain images were not approved to use in the prior researches, since the CT brain images lack more detail in soft tissue and all of cities in developed countries have MRI machine. Inspired by the deficiency of MRI machine in Thailand, we apply the image processing analysis to segment the ventricle boundary from CT brain image.
(a) (b)
Fig
.
1. (a) The ventricles in the brain; (b) A CT slice image of a NPH patient with enlarged ventricle.II. RELATED WORK
In 1999, Tomokazu Takae et al. [2] have presented a fully automatic procedure to segment the lateral ventricle of serial brain MR images. They started with selecting region of interest which obtained CSF into small parts by watershed segmentation. Such region of interest was called the primitive. Then they determined the primitives that belong to lateral ventricle by fuzzy if-then rule for expressing the boundaries between lateral ventricle and other part of CSF. They applied this algorithm to 10 MR series of brain images and compared results with the ground truth from a physician. The results of their method could segment the lateral ventricle with high accuracy. Processing time of each MRI series required three minutes running on SGI O2 (R10000, 225MHz).
In 2001, Syoji Kobashi et al. [3] have proposed a computer-aid diagnosis (CAD) system. The system was able to segment the CSF and lateral ventricle from human brain MR images and rendered the brain volume in 3D image. In their system, they started with segmenting the whole brain via the software that was developed by Tomokazu T. et al.
Segmenting the Ventricle from CT Brain Image
using Gray-Level Co-occurrence Matrices
(GLCMs)
Bharima Clangphukhieo, Pakinee Aimmanee, Bunyarit Uyyanonvara
[2]. Then, they introduced a new technique based on if-then rule which applied to serial brain MR images. The fuzzy inference technique was used in such technique. They applied the system with 20 hydrocephalus patients and compared the results with the volume of manually segmented region by physicians. The error ratio of their system is only1.98%.
H.G. Schnack et al. [4] have developed an algorithm which segmented the third and the lateral ventricles from MR images. The algorithm was based on region growing and mathematical morphology operator. Their algorithm started with coarse binary total segmentation. Anatomical structure of the ventricular system was applied in order to find all parts of the ventricular system. They tested the algorithm using MR images. Their algorithm showed segmentation overlap of 98% between simulated ventricles model and their results.
In 2008, John A. Butman et al. [5] have used fast marching methods and geodesic active contour for ventricle segmentation from serial brain MR images, and employed deformable registration for measuring volume of ventricle. They applied 15 series brain MR images, and then compared the results with ground truth from manually segmented images. The mean error in volume estimation was 3.58% with a standard deviation of 3.66%.
In 2012, Clangphukhieo B. et al. [6] have presented the algorithm for segmentation the ventricle from CT brain image. The algorithm was based on Naïve Bay Classifier. They categorized the intensity of CT brain images in 3 tissue classes; white matter, grey matter and CSF; and used Baye’s Rule to determine CSF areas. The results from their algorithm revealed an error of 3.14% and a standard deviation of 1.41.
III. OUR PROPOSED ALGORITHM
A. Intensity Normalization
We apply a normalization technique to normalize all of CT brain images [7]. This technique makes all of CT brain images have the same intensity. The equation of normalization is given as follows:
Here, is the normalized intensity; is the mean of the desired image intensity; is the variance of the desired image intensity; and is the mean of skin images.
B. Region of Interest
It is the fact that the ventricle is filled with CSF but CSF is in any area of the brain. So, we segment the region of interest (ROI) to reduce area of CSF and select the region that is close to the ventricle. We apply the profile image analysis [8] to select ROI that covers the ventricle as shown in Fig. 2.
(a) (b)
(c) (d)
Fig 2. (a) An original CT brain image; (b) Diagonal lines for computing intensity profile; (c), (d) The region of interest in a particular CT brain image.
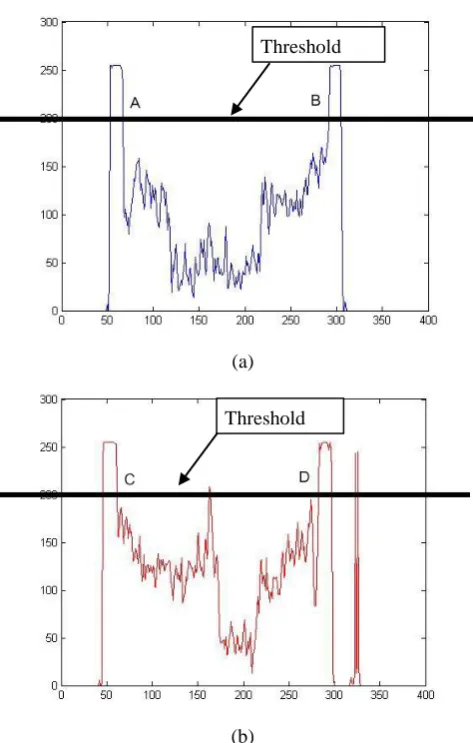
We use a diagonal profile (the AB line in Fig. 2(b)) to compute point A and B as illustrated in Fig. 3 (a), and to select point C and D as shown in Figure 3 (b).
(a) (1)
Threshold
[image:2.595.328.523.45.304.2] [image:2.595.305.542.377.749.2]C. Anisotropic Diffusion
After normalization, we apply the anisotropic diffusion to reduce noise. Anisotropic diffusion (AD) has been applied to reduce the noise in images and has produced good results in past research [9-12].
D. Contrast Adjustment using Sigmoid Function
We apply sigmoid function for adjusting contrast in order to make CSF area more obvious [13].
Sigmoid function is a continuous nonlinear function having ―S‖ shaped that defined by given equation:
[image:3.595.321.521.50.178.2]Here, is the sigmoid function; is a contrast factor term.
Fig. 4 shows the graph of function f(x)
E. Gray Level Co-occurrence Matrices (GLCM)
Gray level co-occurrence matrix (GLCM) [14] is a matrix that calculates from a gray-scale image. The intensity value at i occurs either horizontally, vertically, or diagonally to adjacent pixels with the value j. The calculated GLCM is shown as figure:
Fig.5.The calculated GLCM
[image:3.595.51.277.142.392.2] [image:3.595.321.493.261.370.2]The bow-tie operator is used to convolve each of CT brain image before determine the GLCM. These operators define a mask, as illustrated in Fig.6, has various weights in left-side and right-side respectively.
Fig.6 shows the characteristic of bow-tie operator
F. The Ventricle Segmentation
After determining GLCM, we calculate the cumulative sum of matrix, convert data from 3-D to 1-D. Then we determine the threshold value from local minima between two peaks of 1-D data. As shown as figure:
Fig.7 shows the threshold value IV. EXPERIMENTS AND RESULTS
In our experiments, we compare the results from original GLCM, mean GLCM and bow-tie GLCM.
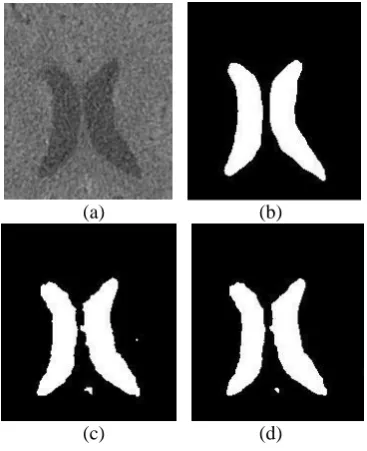
We use 30 CT slice brain images for testing our proposed algorithm. Fig. 8 presents the original CT brain image, region of interest, and the segmented ventricle.
(a) (b)
(c) (d) GLCM
Image
wi= the weighting value
[image:3.595.335.519.479.705.2] [image:3.595.58.267.479.639.2](e)
Fig. 8. (a) the region of interest; (b) Ground truth; (c) The result from original GLCM; (d) The result from Mean GLCM; (e) The result from bow-tie GLCM
TABLE I showssensitivity, specificity and accuracy Methods Sensitivity
(%)
Specificit y (%)
Accuracy (%)
GLCM 73.82 98.81 96.80
Mean-GLCM
68.47 99.04 96.81
BOW-Tie GLCM
69.16 99.10 97.10
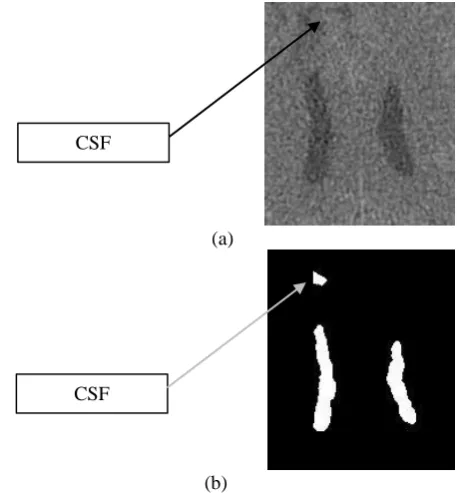
We would like to segment a ventricle boundary from CT brain image. Since the ventricle is filled with cerebrospinal fluid, our proposed algorithm is therefore developed to segment pixels which contain CSF intensity. It is the fact that CSF is not only in the ventricle, but it also grows in several part of the brain. Thus, if the region of interest does not have only region of CSF in the ventricle but also in other part outside the ventricle, our proposed algorithm will extract CSF region where is not in the ventricle as demonstrated in Fig. 9. As a consequence, the error of our algorithm comes from regions of CSF that are not in the ventricle.
(a)
(b)
area. If the choroid plexus occurs in the boundary of ventricle, our purposed method cannot define that the choroid pixel is the ventricle. The choroid plexus is illustrated in Figure 10.
(a)
(b)
Figure 10. (a) The region of interest; (b) The
segmented ventricle boundary
V. CONCLUSION
This paper proposes an algorithm for automatic segmentation of the ventricle from CT brain images. It’s quite difficult process because the color of target area is very similar to the rest of the image. Our proposed process starts with normalizing CT brain images and extracting the region of interest using profile of gray level. We then apply Gray-Level Co-occurrence Matrices (GLCMs) for texture classification.
REFERENCES
[1] Adams, R.D., Fisher, C.M., Haskim, S. et al., Symptomatic occult hydrocephalus with "normal" cerebrospinal fluid pressure, A treatable syndrome. New England Journal of Medicine, pp. 117-126, 1965. [2] Tomokazu T., Yutaka Hata, Nobuyuki M. et al., Automated
Segmentation of the Lateral Ventricle of MR Brain by Fuzzy Inference, Neural Information Processing, vol. 3, pp. 884-889, 1999.
[3] Syoji K., Tomokazu T., Yutaka H. et al., Automated Segmentation of the Cerebrospinal fluid and the Lateral Ventricles from Human MR Images, IFA World Congress and 20th NAFIPS International Conference, vol.4, pp.1961-1966, 2001.
[4] H.G. Schnack, H.E. Hulshoff Pol, W.F.C. Baare, M.A. Viergever, and R.S. Kahn, Automatic Segmentation of the Ventricular System from MR Images of the Human Brain, NeuroImage, vol. 14, pp 95-104, 2001.
[5] John A. Butman, Marius George Lingurarn, Assessment of Ventricle Volume from Serial MRI Scans in Communicating Hydrocephalus, Biomedical Imaging, Nano to Macro. 5th IEEE international Symbosium, pp. 49-52, 2008.
[6] Clangphukhieo, B., Aimmanee, P., and Uyyanonvara, B., Automated Segmentation of a Ventricle Boundary from CT Brain Image Based CSF
CSF
Choroid plexus
[image:4.595.124.213.48.157.2] [image:4.595.312.484.91.364.2] [image:4.595.62.292.498.745.2][7] L. Hong, Y. Wan and A.K. Jain, Fingerprint Image Enhancement: Algorithm and Performance Evolution, IEEE Transaction Pattern Analysis and Machine Intelligence, pp. 777-789, 1998
[8] Gonzalez and Woods, Digital Image Processing, Second Edition, Prentice-Hall, 2002.
[9] Perona P., and Malik J., Scale-space and edge detection using anisotropic diffusion, IEEE Transactions on Pattern Analysis and Machine Intelligence, vol. 12, pp. 629-639, 1990
[10] G. Gerig, O. Kubler, R. Kikini, ,F.A. Jolez, Nonlinear anisotropic filtering of MRI data, IEEE Trans. Med. Imaging 11 ,pp. 221–232, 1992.
[11] Y. Yu, S. Acton, Speckle reducing anisotropic diffusion, IEEE Trans. Image Process, vol. 11, pp. 1260–1270, 2002.
[12] J. Tang, Q. Sun, Y. Cao, and J. Liu, An adaptive anisotropic diffusion filter for noise reduction in MR images, Proceeding of IEEE International Conference on Mechatronics and Automation, Harbin, China, pp. 1299–1304, 2007.
[13] Naglaa Hassan and Norio Akamatsu, A new approach for contrast enhancement using sigmoid function, The International Arab Journal of Information Technology, Vol.1, No. 2, July 2004.