1 Evolution of oxygen functionalities in graphene oxide and its impact on structure and exfoliation: An oxidation time based study
Dinidu Perera1 , Avishi Abeywickrama1 , Federico Zen2 , Paula E. Colavita2 , Dilushan R. Jayasundara1*
1. Department of Physics, University of Colombo, Colombo 03, Sri Lanka.
2. School of Chemistry, CRANN and AMBER Research Centres, Trinity College Dublin, Dublin 2, Ireland.
2 ABSTRACT
Control over oxygen functionalities is important for the realization of Graphene Oxide (GO) based applications. Evolution of oxygen functionalities with time of oxidation and its impact on GO structure, exfoliation and reduction is investigated using XRD, FTIR, XPS, TGA and AFM. The results indicate no net increase in oxygen bound carbon atoms compared to graphitic carbon within the samples studied. However the percentage contributions from each type of oxygen functionalities tend to vary as the oxidation progress. Changes in the thermogravimetric response were observed with continued oxidation that showed a change from one mass loss region to two mass loss regions. The interaction kinetics of the protective group and the spatial distribution of oxygen functionalities during graphite oxidation give key insight to the above observed properties in GO. It is also shown that the observed changes in the structure have a direct impact on the ability to exfoliate GO to single layers as well as on the reduction process to produce reduced graphene oxide. These results are significant in the scalable production of GO with controlled and consistent quality for applications in the areas such as chemical and biological sensing, water purification and development of nanocomposite.
Keywords
3 1. INTRODUCTION
With its exceptional physiochemical and electrical properties, graphene has attracted significant attention as a primary raw material in developing new technologically advanced materials. These include areas such as nanocomposites, functional coatings, paints and electrode materials for chemical and biological sensing [1-9]. However the demand for graphene applications will essentially be driven by the progress in scalability of the production of graphene with properties appropriate for the said applications. Chemical processing of graphene via reduction of Graphene Oxide (GO) has been regarded as a scalable and an economical method for most applications [10-14]. However, one of the biggest challenges in chemically processed graphene/GO in the above mentioned applications is the randomness of its oxygen functionalities as well as their inhomogeneous spatial distribution [15-19]. Therefore, as part of controlling the process, one needs to understand the mechanism through which oxygen functionalities evolve during the process that forms GO. Thus the study presented herein focuses on oxidation reactions that are critical for the processability of this nanomaterial, which has been proposed for diverse and important applications such as in energy, environmental, and biomedical, as recently reviewed in references [20-21].
The oxidation of graphite goes back to 1859, where British chemist B.C. Brodie added potassium chlorate (KClO3) to slurry of graphite in fuming nitric acid (HNO3) [22]. In 1898,
L. Staudenmaier introduced two major changes by adding concentrated sulfuric acid to increase the acidity of the mixture and adding multiple aliquots of potassium chlorate solution into the reaction mixture over the course of reaction. These changes led to a highly oxidized graphite oxide product similar to Brodie’s multiple oxidation approach, but performed in a single reaction vessel [23]. Hummers and Offeman in 1958 developed an alternate oxidation method by reacting graphite with a mixture of potassium permanganate (KMnO4) and
concentrated sulfuric acid (H2SO4), achieving similar levels of oxidation within a fraction of
time compared to the previous two methods.
4 over the mechanism of GO formation and the structure of GO, with several structural models being proposed [31-36].
Despite recent advances in understanding GO chemistry and structure, the mechanism of its formation has gained less attention and has been limited mostly to theoretical studies, and less experimental insight[37-40]. In understanding the mechanism of GO formation from bulk graphite, Demiev and Tour identified three distinct steps that comprise; (i) H2SO4
intercalation between graphene layers forming H2SO4-graphite intercalated compound (GIC),
(ii) conversion of GIC to an oxidized form of graphite, defined as pristine graphene oxide (PGO) via a an edge-to-centre propagation of oxygen functionalities; (iii) conversion of PGO to exfoliated GO through exposure to water [37]. In a separate study, Shao et. al. and Chen et. al. studied GO formation using Hummer’s method and modified versions of Hummer’s method that show propagation of oxidation from edges and defect sites to the graphite basal plane [17, 41]. Pan and Aksay has identified two pathways for graphite oxidation; cross-planar oxidation of graphite from the (002) plane that results in periodic cracking of the uppermost graphene oxide layer and edge-to-centre path of oxidation [42].
5 2. EXPERIMENTAL DETAILS
2.1 Chemicals and materials.
Sulfuric acid (98 % H2SO4, Sigma-Aldrich), Phosphoric acid (H3PO4, Sigma-Aldrich),
Hydrochloric acid (HCl, Sigma-Aldrich), Potassium Permanganate (KMnO4, Research-Lab
Fine Chem Industries), Graphite (>99.9%, Bogala graphite), Hydrogen Peroxide (35% H2O2,
Sigma-Aldrich) were used as received. Deionized water was used in the synthesis as well as to make ice required for the process.
2.2 Graphene oxide sample preparation.
GO was prepared from high purity vein graphite using the improved Hummers method[30]. Briefly, 9:1 mixture of concentrated H2SO4/H3PO4 (180:20 ml) was added to 1:6 mixture of
graphite (1.5 g) and KMnO4 (9.0 g), where both mixtures were kept in an ice bath prior to
mixing, producing a slight exotherm to 35-40 0C. The mixture was then heated up to 50 ºC for oxidation. The time allowed for oxidation at 50 oC was varied as 1 h, 2 h, 3 h, and 4 h to obtain a series of GO solutions. At the end of each of the above mentioned times the reaction was terminated by adding copious amount of ice (400 g) and 35% H2O2 solution (10 ml), after
which the colour of the solution becomes yellow. This solution was then allowed to settle overnight and the supernatant was decanted away. The remaining GO slurry was further washed with distilled water until the pH of the rinse water becomes greater than 5. The GO membranes were prepared by evaporating 25 ml of the remaining gel-like sludge on a petri dish. These membranes, referred to as GO1, GO2, GO3, and GO4 respectively were stored in a vacuum desiccator prior to being used in experiments.
2.3 Sample characterizations.
The prepared GO membranes were characterized with a series of spectroscopic and microscopic methods. X-ray diffraction (XRD, Bruker FD800, Karlsruhe, Germany, Cu Kα radiation, λ = 1.5406 Å, with θ/2θ configuration) was used to monitor the interlayer spacing of graphitic layers in vein graphite and the layer spacing in the synthesized GO membranes. The data was recorded over a 2θ range of 5-40 0
6 X-ray photoemission spectroscopy (XPS) of the GO membranes were performed in an Omicron ultrahigh vacuum system at 1 × 10⁻¹⁰ mbar base pressure, equipped with a monochromatized Al Kα source (1486.6 eV) and a multichannel array detector. Samples for XPS analysis was prepared by drop casting GO onto a XPS sample plate from GO slurry. These samples were kept in vacuum overnight (or until the base pressure reach better than 10
-5
mbar in the preparation chamber) before transferring to the analysis chamber for the XPS measurements. Spectra were recorded with an analyzer resolution of 0.5 eV, normal to the sample surface. Atomic area ratios were determined by fitting spectra with Gaussian-Lorensian (GL(30)) function after Shirley background correction using CasaXPS 2.3.18 software.
Thermal stability of GO membranes and simultaneous analysis of the gases evolved during temperature ramping were investigated using combined TGA-FTIR (Perkin Elmer Pyris 1 with TG-IR-CCMS interface TL800 and Perkin Elmer Spectrum 100 FT-IR Spectrometer with PerkinElmer Universal ATR Sampling Accessory). 10 mg of the GO membrane was placed in the sample pan and the analysis was carried out with temperature ramp rate of 10
o
C/min and Nitrogen gas flow rate of 25 cc/min.
Atomic force microscopy (AFM, Asylum Research in tapping mode, using Au-coated silicon cantilevers (NT-MDT) with nominal spring constant in the range 1.45-15.1 N m-1) was employed to examine the surface topographical features of exfoliated GO with an emphasis on the layer thickness (t) and the lateral dimension (d). The samples for AFM imaging were prepared by drop casting GO from solution (1 mg/ml) onto a cleaned Si-wafer and then dried under vacuum before being imaged using AFM. .
3. RESULTS AND DISCUSSION
The study reports for the first time the evolution of oxygen functionalities of GO samples prepared under varying oxidation times using improved Hummer’s method. Samples were characterized using a combination of spectroscopic and microscopic techniques to obtain structural information of the resulting GO. All characterizations were carried out on GO membranes unless noted otherwise.
3.1 X-ray diffraction.
7 graphite sample originates from the diffraction of the (002) plane that corresponds to an interlayer distance, d of 3.35 Å. Both the above d-spacing and the FWHM of 0.157o are in agreement with previous XRD measurements reported for vein graphite [43].
The XRD pattern on all GO samples studied showed a symmetric peak in the 2 range 8o
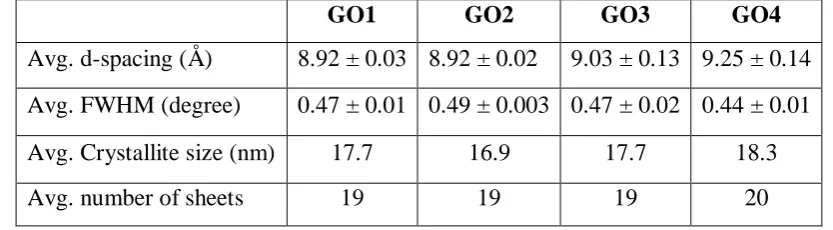
8 Fig. 1 (a) XRD spectra of graphite, GO1, GO2, GO3, and GO4. The spectra have been shifted vertically for clarity. The variation in average (b) d-spacing and (c) FWHM for GO1, GO2, GO3, and GO4, where the error bars represent standard deviation
GO1 GO2 GO3 GO4
Avg. d-spacing (Å) 8.92 ± 0.03 8.92 ± 0.02 9.03 ± 0.13 9.25 ± 0.14 Avg. FWHM (degree) 0.47 ± 0.01 0.49 ± 0.003 0.47 ± 0.02 0.44 ± 0.01
Avg. Crystallite size (nm) 17.7 16.9 17.7 18.3
[image:8.595.88.505.154.269.2]Avg. number of sheets 19 19 19 20
Table 1: Calculated results for average d-spacing in c-direction from the XRD of GO1, GO2, GO3, and GO4. Average crystallite size and number of sheets per crystallite was calculated using Scherrer’s formula for the above GOs.
The d-spacing of all GO samples were greater than those recorded for graphite oxide (0.62 nm), yet similar to the interlayer spacing reported for hydrated GO samples where a layer of water is present [45-46]. Based on the mechanism proposed by Demiev and Tour for GO oxidation this is only possible if the step two, which is edge-to-centre propagation of oxidation has completed resulting in pristine graphite oxide [37].
[45-9 46]. These observations are unique as its not being reported before and present new insight into the structural variations that occur as a result of continued oxidation.
The FWHM is an indication of sample crystallinity and strain between planes. The observed variation in FWHM shown in Fig.1(c) is largest for GO2 and lowest for GO4. With the number of layers being the same for all the GO samples studied as shown in table 1, the observed variation in FWHM can be attributed to the changes in strain as a result of oxidation. Thus it can be argued that the strain within GO layers increases as the oxidation proceeds from GO1 to GO2 and then relaxes to a certain degree. Pan and Aksay have reported on strain energy buildup due to the undulation caused by the hydroxyl and epoxy sites as a result of basal plane oxidation [42]. The observed reduction in strain for GO3 and GO4 coincides well with the increase in the d-spacing as can be seen in Fig.1(b) or vice versa where the built-in strain is reduced via expansion in the c-axis. Further the expansion would facilitate exfoliation of GO single layers as a result of reduced van der Waal’s interactions between layers. The attachment of oxygen functionalities, though responsible for the c-axis expansion and the developed strain between layers, it is the undistorted graphene domains that are still intact would contribute for the observed diffraction peaks.
3.2 Infrared spectroscopy characterization.
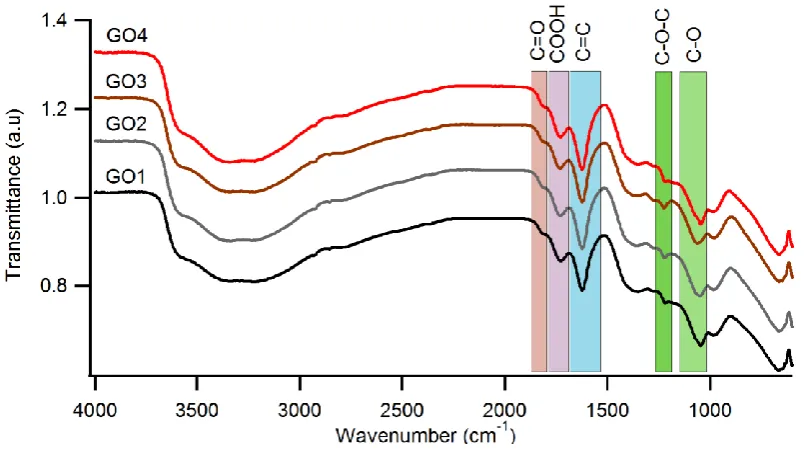
FTIR spectroscopy was carried out to obtain information on the oxygen functionalities incorporated into the graphitic planes as a result of oxidation. These spectra, which is typical for IR spectra of GO reported, are shown in Fig.2. IR absorbance’s were observed in the regions 1010-1150 cm-1, 1180-1270 cm-1, 1540-1675 cm-1, 1690-1790 cm-1, and 1795-1870 cm-1and are assigned to vibrations from hydroxyl (C-OH), C-O-C (stretching), sp2-hybridized C=C in-plane vibrations, carboxyl (COOH), and ketonic (C=O) functional groups respectively[30, 48]. All spectra studied show also a broader IR absorbance in the range 3000 to 3720 cm-1 characteristic of O—H stretching modes that further supports the presence of hydroxyl and carboxyl groups [48]. Further, it was also observed that the position of the IR absorbance of the functional groups C-O and C-O-C has slightly red shifted in wavenumber for GO3 to GO4 by 15.4 cm-1 and 5.8 cm-1 respectively.
10 as the oxidation proceeds from GO3 to GO4. Accumulation of hydroxyl groups with the increase in oxidation time can give way for increased hydrogen bonding between functional groups thus contributing to the red shift in IR vibrations observed going from GO3 to GO4 [18].
Fig. 2 IR transmission spectra for GO1-GO4. The colored regions represent the IR absorbance due to the presence of respective oxygen functionalities found in all GO samples
3.3 X-ray photoelectron spectroscopy.
11 ± 0.1 eV [30, 51-52, 55]. C=O was assigned at 288.0 ± 0.3 eV and COOH at 289.0 ± 0.2 eV [30, 51].
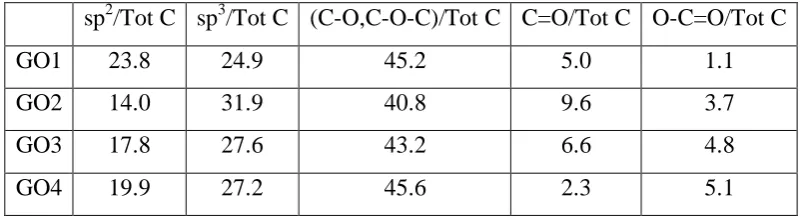
Table 2 reports the atomic percentage of each type of carbon present in the respective GOs calculated using area ratios from the deconvoluted C 1s spectra. The data reveal that the carbon bound to oxygen in the form of C-OH, C-O-C contributes approximately 40-45 % to the C 1s spectra for all the GO samples studied. That is C-OH and C-O-C combined; contribute more than 75% of the total oxygen functionalities found in all GO samples. Thus it can be argued that the resulting structure and reactivity of GOs would greatly be influenced by the C-OH and C-O-C functionalities present and their special distribution.
[image:11.595.73.539.276.638.2]12 Further as shown in Fig.3(c), the total percentage of oxygen-bound carbon functionalities in C 1s spectra varies as 51%, 54%, 55%, and 53% for GO1, GO2, GO3, and GO4 respectively. Thus it is indicative that the overall oxygen-bound carbon content does not change much over the time of oxidation from GO1 to GO4. However, changes in the percentage contributions among specific types of oxygen functional groups to the overall oxygen-bound carbon can be observed as oxidation proceed from GO1 to GO4. It can be observed that the percentage contributions from C=O and COOH to the overall carbon-bound oxygen doubles from 12% to 24% for GO1 to GO2 (see Fig. 3(c)). However this amount reduces to 14% for GO4.
sp2/Tot C sp3/Tot C (C-O,C-O-C)/Tot C C=O/Tot C O-C=O/Tot C
GO1 23.8 24.9 45.2 5.0 1.1
GO2 14.0 31.9 40.8 9.6 3.7
GO3 17.8 27.6 43.2 6.6 4.8
GO4 19.9 27.2 45.6 2.3 5.1
Table 2: Atomic percentages for sp2, sp3, C-O & C-O-C, C=O, and O-C=O obtained from the deconvoluted XPS spectra for GO-GO4. Columns 4-6 were used to calculate percentage values summarized in Fig.3(c).
The C=O and COOH groups are generally formed at the graphitic boundaries or at the edges of holes in the basal plane [16, 56]. Thus an increase in percentage contributions from the above two functionalities during oxidation from GO1 to GO2 can be the result of an increase in hole formation in the GO basal plane. The oxidation of graphite basal plane with KMnO4
can lead to formation of vicinal diols. These vicinal diols, if left unprotected can lead to the formation of diketonic groups, which would lead to formation of holes in the graphene oxide basal plane [57]. However, the subsequent decrease in the percentage contributions from C=O and COOH groups to the C 1s spectra as the oxidation proceed from GO2 to GO4 can be interpreted as an inhibition to further hole formation in the GO basal plane.
In the improved hummer’s synthesis method used in this research, H3PO4 is used as a
[image:12.595.97.498.256.366.2]13 expansion observed in GO3 and GO4 paved way for H3PO4 to enter into the interlayer space
created and subsequently reduce further creation of lattice vacancies or holes.
The interaction kinetics of H3PO4 as a protecting group, to the best of our knowledge, has not
been reported before. Therefore, the findings in this research are important both in terms of controlling defect formation and ratio of edge to basal plane oxygen functionalisation as these significantly influence GO applications, specifically in the areas of sensing and development of nanocomposites. Further the findings are important for future research such as in controlling photoluminescence properties of GO for applications in the area of photonics [58-59].
3.4 Thermogravimetric analysis.
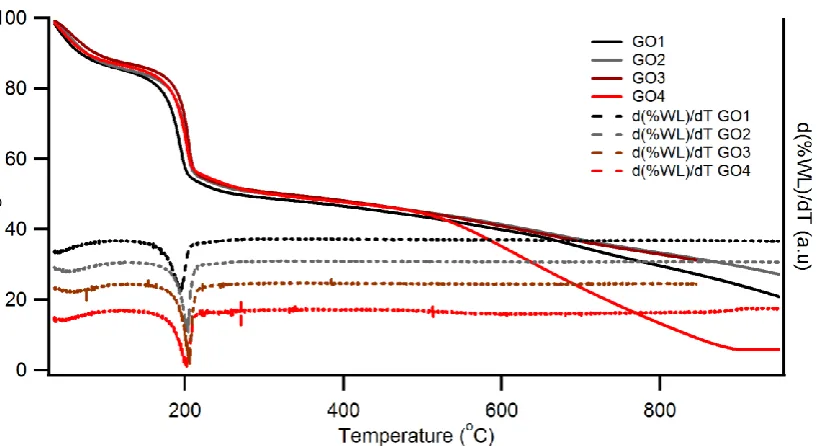
The thermal stability of the oxygen functionalities of GOs can be obtained using thermogravimetric analysis. TGA can be utilized to obtain mass loss information when the sample is thermally reduced under inert atmosphere. Fig.4 presents the thermographs of GO1-GO4 as a function of temperature.
Fig. 4 TGA and the corresponding differential spectra of GO1, GO2, GO3, and GO4 in the temperature range 30 oC to 950 oC
[image:13.595.88.497.408.631.2]14 respect to temperature for all the GOs. This is used to obtain the temperature for which the rate of mass loss is highest. In region one, the gradual mass loss of approximately 10% can be observed in all samples between room temperature and to about 105 oC which can be considered as due to loss of physisorbed water. This is followed by a significant mass loss of approximately 32% in the temperature range 150-250 oC in all samples. However the temperatures where the rate of mass loss is highest as reflected in differential plot vary as 194
o
C, 203 oC, 206 oC, and 202 oC for GO1, GO2, GO3, and GO4 respectively.
In region two of the TGA profile of the GOs a constant mass loss of approximately 7% was observed over the temperature range 250-500 oC. This corresponds to a constant mass loss of 0.03% per centigrade. A significant difference in the mass loss behavior can be observed in region three, where it deviates significantly for GO4 with 39% mass loss over the temperature range 500-900 oC at an average rate of 0.10% per centigrade. The onset temperature of the second significant mass loss in GO4 can be seen as approximately 500 oC. This observation of a second mass loss is consistent with the reported TGA spectra of GO synthesized using improved Hummers method [30,43,60]. The mass loss observed in the same temperature range for GO1, GO2, and GO3 has been 19%, 15%, and 15% respectively. It can be observed in the thermograph of GO4 that the weight loss ceases around 900 oC and only 6% of the initial weight remains at 950 oC. However this percentage is much less than the graphitic carbon concentration of 47% of both sp3 and sp2 carbon of GO4 obtained from XPS above. This implies creation of high concentration of defect sites that has led to loss of carbon atoms from the basal plane during thermal reduction.
15 GO4 to that of GO1, GO2, and GO3 can be related to the special distribution of the oxygen functionalities, especially that of C-OH and C-O-C on the above samples. Based on the XPS analysis of GO4 that shows ~ 86% of C-O and C-O-C bound carbon and the red shift (increased hydrogen bonding) observed in FTIR spectra for the same functional groups suggest that some of the above functionalities are in close proximity. Thus it is possible that the observed weight loss in GO4 in region three of TGA is a direct result of these functional groups in close proximity going through a C-OH to C-O-C transition and subsequently results in loss of material as temperature increase.
3.5 Combined TGA-FTIR analysis.
To further analyze the TGA data for the gas evolved, simultaneous IR measurements were carried out. The absorbance data obtained were presented in Fig.5(a) and (b) as 3D plots with respect to wavenumber and temperature for GO3 and GO4. Fig.5(c) and 5(d) show the extracted IR spectra from the above 3D plots for GO3 and GO4 respectively (see Online Resources 2 for extracted IR spectra for GO1 and GO2), at temperatures 200 oC and 600 oC where the rate of mass loss is maximum in region one, and in region three. The obtained IR spectra of gas desorbed was similar for GO1-3, thus only the IR absorbance spectra of GO3 is shown in Fig.5(a). The most dominant feature of these 3D IR-absorbance plots is the peak at 2358 cm-1, which appears in the temperature regions 150-250 oC in all GOs and in region 3 for GO4 (Fig.5(b)) only. Less intense absorbance peaks that follow the same temperature profile were observed at 670 cm-1 and in the region 3500-3760 cm-1. The temperatures at which the above absorbance peaks appear correspond to the onset temperatures where significant mass losses were observed in TGA. The peaks at 2358 cm-1 and 670 cm-1 corresponds to the asymmetric stretching and bending modes of CO2 respectively [48]. The
observed IR absorbance in the region 3500-3760 cm-1 is attributed to the evolved water vapor from the sample during the TGA experiment. Thus the evolution of CO2 and H2O gasses at
specific temperatures as reported above indicate significant thermal reduction of oxygen functionalities in GO at these temperatures [64, 67-69].
It can also be observed that the intensity variation in the CO2 and H2O IR-absorbance peaks
16 The intensities of the IR absorbance spectra that correspond to the CO2 and H2O gases
evolved in the temperature range 500-900 o C during the TGA experiments on GO4 were stronger than the intensities observed for the same gasses in the temperature range 150-250 oC. This is in agreement with the TGA data that show a greater percentage of mass loss in this region compared to that in the region 1.
Interestingly, the FTIR spectra taken of GO samples after heating to 250 oC under flow of argon as well as under vacuum conditions have shown significant reduction in IR absorbance for C-OH, C-O-C, and C=O functionalities (Online Resource 3). However IR absorbance was observed in the regions corresponding to COOH, C-H, and C=C. This indicate that the weight loss observed in region one at the temperature range 150 – 250 oC are mostly due to the reduction of C-OH and C-O-C functionalities out of which C-OH being the predominant species to reduce as it requires less energy [56]. On the other hand the presence of edge functionalized COOH indicated that these groups are much tightly bound to the graphene skeleton.
(a) (b)
17 Fig. 5 IR spectra of gas evolved during TGA for (a) GO3 and (b) GO4 for temperature range 30 to 950 0C. Also shown are the corresponding IR spectra at maximum rate of weight loss temperatures for (c) GO3 and (d) GO4
In many literature the reduction of GO has been considered independently in developing control protocols for product constancy. The results from the above TGA and TGA-FTIR analysis provide an insight into the effect that graphite oxidation time would have in the thermal reduction process of GO and the properties of rGO. Thus the information could essentially be used in developing a process protocol for the synthesis of graphene via chemical routes that would generate high yields and consistent quality.
3.6 Atomic force microscopy analysis.
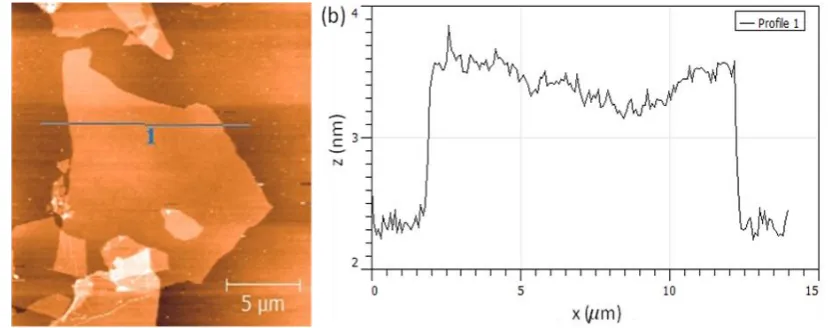
To gain insight into the exfoliability of the synthesized GO to single layers and their morphology, aqueous solution of GO 1mg/ml was sonicated for 10 min and then drop cast on a Si-wafer. The sample was allowed to dry and then imaged using AFM. Fig.6 (a) is an AFM image of exfoliated GO4 with lateral dimension in micron range. Similarly large flake sizes were observed in most of the GO4 samples studied. A topographic line scan along the flake is shown in Fig.6 (b) and is used to calculate the flake thickness, which is ~ 1 nm and corresponds to thickness of a single layer of GO [17, 30, 70]. While we were able to exfoliate GO3 and GO4 to obtain single layer GO with large lateral size distributions, similar exfoliation into single layers were less observed on most GO1 and GO2 samples. Thus the exfoliability of GO3 and GO4, under the mild conditions reported here, can be attributed to the reduction in Van der Waals interaction between the adjoining layers as a result of c-axis expansion observed in XRD measurements.
18 Fig. 6 (a) AFM image of a GO flake drop casted on to a Si-wafer from a solution of GO4. (b) The thickness of the GO4 sheet was measured to be around 1 nm, as shown in the line scan
The information on ability to exfoliate GO to single layers with large surface area and also within a fraction of time than reported in the improved Hummer’s synthesis is significant both in the production of GO and its use in applications. It reduces the cost of synthesis of GO and make it a more attractive choice in large surface area applications, such as in sensors, water purification, and in the development of nanocomposite materials.
The analysis of the results from both spectroscopic measurements and the microscopy above indicate the presence of structural evolution beyond edge-to-center propergation mechanisms proposed by Tour et. al. [37], Shao et. al. [17], and Chen et. al. [41], and cross-planer oxidation proposed Aksay et. al. [42]. This highlights the effect of a single parameter, oxidation time, on the resulting GO structure. Therefore, the study provides important information for the synthesis of GO with controlled oxygen functionalities and structure that can be specific for the type of applications.
4. CONCLUSIONS
The research reports for the first time the evolution of oxygen functionalities in graphene oxide with oxidation time. The oxidation of graphite was carried out using improved hummer’s method for times 1, 2, 3, and 4 hours respectively. Combined XRD, FTIR, and XPS analysis indicated complete oxidation in all graphite samples with a constant percentage of oxygen-bound carbon to that of graphitic carbon. However, the percentage contribution from each type of functional group differs within the total oxygen percentage in these samples. The above differences indicate a complex structural variation in the GO basal plane that has been attributed to initial hole formation at the early stage of oxidation and subsequent inhibition in the hole growth due to the intervention of the H3PO4 protective group. The
results also indicate an evolution in the spatial distribution of oxygen functionalities as oxidation progress.
19 reproducibility. Also it show that the observed changes in the structure have a direct impact on the exfoliability of GO to single layers as well as on the reduction process to produce reduced graphene oxide (rGO). Further the ability to obtain lager lateral area single layer GO flakes at fraction of oxidation time than reported in improved hummer’s synthesis would lead to significant economic benefits in the production of GO and its use in applications.
ACKNOWLEDGEMENT
We acknowledge the financial support given by the University of Colombo under the grant AP/3/2/2016/CG/29 and undergraduate research grant schemes. The authors also acknowledge the facilities and scientific and technical assistance of Sri Lanka Institute of Nanotehcnology (SLINTEC). We are grateful to Prof. C. McGuinness, Prof. I. Shvets, and Dr. Manuel Ruether for kindly granting access to their equipment and for the training. FZ and PEC gratefully acknowledge support by Science Foundation Ireland (SFI) under Grant Number 12/IP/1273.
Supplementary information:
XPS survey scans GO1-GO3, IR spectra of gas evolved during TGA for GO1 and GO2, FTIR of GO and rGO at 250 0C
20 REFERENCES
[1] U. Khan, P. May, A. O’Neill, J.N. Coleman, Development of stiff, strong, yet tough composites by the addition of solvent exfoliated graphene to polyurethane, Carbon 48(14) (2010) 4035-4041.
[2] V. Georgakilas, M. Otyepka, A.B. Bourlinos, V. Chandra, N. Kim, K.C. Kemp, P. Hobza, R. Zboril, K.S. Kim, Functionalization of graphene: covalent and non-covalent approaches, derivatives and applications, Chem. Rev 112(11) (2012) 6156-6214.
[3] D. Chen, H. Feng, J. Li, Graphene oxide: preparation, functionalization, and electrochemical applications, Chemical reviews 112(11) (2012) 6027-6053.
[4] J. Bao, Y. Fu, Z. Bao, Thiol-functionalized magnetite/graphene oxide hybrid as a reusable adsorbent for Hg 2+ removal, Nanoscale research letters 8(1) (2013) 486.
[5] X. Huang, Z. Zeng, Z. Fan, J. Liu, H. Zhang, Graphene‐based electrodes, Advanced Materials 24(45) (2012) 5979-6004.
[6] M.J. Nine, M.A. Cole, L. Johnson, D.N. Tran, D. Losic, Robust superhydrophobic graphene-based composite coatings with self-cleaning and corrosion barrier properties, ACS applied materials & interfaces 7(51) (2015) 28482-28493.
[7] Y. Shao, J. Wang, H. Wu, J. Liu, I.A. Aksay, Y. Lin, Graphene based electrochemical sensors and biosensors: a review, Electroanalysis 22(10) (2010) 1027-1036.
[8] G. Williams, B. Seger, P.V. Kamat, TiO2-graphene nanocomposites. UV-assisted photocatalytic reduction of graphene oxide, ACS nano 2(7) (2008) 1487-1491.
[9] K. Kaviyarasu, C.M. Magdalane, E. Manikandan, M. Jayachandran, R. Ladchumananandasivam, S. Neelamani, M. Maaza, Well-Aligned Graphene Oxide Nanosheets Decorated with Zinc Oxide Nanocrystals for High Performance Photocatalytic Application, International Journal of Nanoscience 14(03) (2015) 1550007.
[10] O.C. Compton, S.T. Nguyen, Graphene oxide, highly reduced graphene oxide, and graphene: versatile building blocks for carbon‐based materials, small 6(6) (2010) 711-723. [11] D.R. Dreyer, S. Park, C.W. Bielawski, R.S. Ruoff, The chemistry of graphene oxide, Chemical Society Reviews 39(1) (2010) 228-240.
[12] K.P. Loh, Q. Bao, P.K. Ang, J. Yang, The chemistry of graphene, Journal of Materials Chemistry 20(12) (2010) 2277-2289.
[13] S. Pei, H.-M. Cheng, The reduction of graphene oxide, Carbon 50(9) (2012) 3210-3228. [14] K. Kaviyarasu, Manikandan, E., Kennedy, J. Maaza, M., Synthesis and analytical applications of photoluminescent carbon nanosheet by exfoliation of graphite oxide without purification, J Mater Sci: Mater Electron 27 (2016).
[15] S. Eigler, C. Dotzer, A. Hirsch, Visualization of defect densities in reduced graphene oxide, Carbon 50(10) (2012) 3666-3673.
[16] K. Erickson, R. Erni, Z. Lee, N. Alem, W. Gannett, A. Zettl, Determination of the local chemical structure of graphene oxide and reduced graphene oxide, Advanced Materials 22(40) (2010) 4467-4472.
[17] G. Shao, Y. Lu, F. Wu, C. Yang, F. Zeng, Q. Wu, Graphene oxide: the mechanisms of oxidation and exfoliation, Journal of materials science 47(10) (2012) 4400-4409.
[18] C. Zhang, D.M. Dabbs, L.-M. Liu, I.A. Aksay, R. Car, A. Selloni, Combined effects of functional groups, lattice defects, and edges in the infrared spectra of graphene oxide, The Journal of Physical Chemistry C 119(32) (2015) 18167-18176.
[19] Z. Liu, K. Nørgaard, M.H. Overgaard, M. Ceccato, D. Mackenzie, N. Stenger, S.L. Stipp, T. Hassenkam, Direct observation of oxygen configuration on individual graphene oxide sheets, Carbon (2017).
21 [21] S. Priyadarsini, S. Mohanty, S. Mukherjee, S. Basu, M. Mishra, Graphene and graphene oxide as nanomaterials for medicine and biology application, Journal of Nanostructure in Chemistry 8(2) (2018) 123-137.
[22] B. Brodie, Sur le poids atomique du graphite, Ann. Chim. Phys 59(466) (1860) e472. [23] L. Staudenmaier, Verfahren zur darstellung der graphitsäure, European Journal of Inorganic Chemistry 31(2) (1898) 1481-1487.
[24] A.K. Geim, K.S. Novoselov, The rise of graphene, Nature materials 6(3) (2007) 183-191. [25] S. Eigler, M. Enzelberger‐Heim, S. Grimm, P. Hofmann, W. Kroener, A. Geworski, C. Dotzer, M. Röckert, J. Xiao, C. Papp, Wet chemical synthesis of graphene, Advanced Materials 25(26) (2013) 3583-3587.
[26] Y. Hernandez, V. Nicolosi, M. Lotya, F.M. Blighe, Z. Sun, S. De, I. McGovern, B. Holland, M. Byrne, Y.K. Gun'Ko, High-yield production of graphene by liquid-phase exfoliation of graphite, Nature nanotechnology 3(9) (2008) 563-568.
[27] K.R. Paton, E. Varrla, C. Backes, R.J. Smith, U. Khan, A. O’Neill, C. Boland, M. Lotya, O.M. Istrate, P. King, Scalable production of large quantities of defect-free few-layer graphene by shear exfoliation in liquids, Nature materials 13(6) (2014) 624-630.
[28] W.S. Hummers Jr, R.E. Offeman, Preparation of graphitic oxide, Journal of the American Chemical Society 80(6) (1958) 1339-1339.
[29] J. Chen, B. Yao, C. Li, G. Shi, An improved Hummers method for eco-friendly synthesis of graphene oxide, Carbon 64 (2013) 225-229.
[30] D.C. Marcano, D.V. Kosynkin, J.M. Berlin, A. Sinitskii, Z. Sun, A. Slesarev, L.B. Alemany, W. Lu, J.M. Tour, Improved Synthesis of Graphene Oxide, ACS nano 4(8) (2010) 4806-4814.
[31] U. Hofmann, R. Holst, Über die Säurenatur und die Methylierung von Graphitoxyd, European Journal of Inorganic Chemistry 72(4) (1939) 754-771.
[32] G. Ruess, Über das graphitoxyhydroxyd (graphitoxyd), Monatshefte für Chemie/Chemical Monthly 76(3) (1947) 381-417.
[33] W. Scholz, H. Boehm, Untersuchungen am graphitoxid. VI. Betrachtungen zur struktur des graphitoxids, Zeitschrift für anorganische und allgemeine Chemie 369(3‐6) (1969) 327-340.
[34] T. Nakajima, Y. Matsuo, Formation process and structure of graphite oxide, Carbon 32(3) (1994) 469-475.
[35] H. He, T. Riedl, A. Lerf, J. Klinowski, Solid-state NMR studies of the structure of graphite oxide, The Journal of physical chemistry 100(51) (1996) 19954-19958.
[36] A. Lerf, H. He, M. Forster, J. Klinowski, Structure of graphite oxide revisited‖, The Journal of Physical Chemistry B 102(23) (1998) 4477-4482.
[37] A.M. Dimiev, J.M. Tour, Mechanism of graphene oxide formation, ACS nano 8(3) (2014) 3060-3068.
[38] T. Sun, S. Fabris, Mechanisms for oxidative unzipping and cutting of graphene, Nano letters 12(1) (2011) 17-21.
[39] J.-L. Li, K.N. Kudin, M.J. McAllister, R.K. Prud’homme, I.A. Aksay, R. Car, Oxygen-driven unzipping of graphitic materials, Physical review letters 96(17) (2006) 176101.
[40] N. Morimoto, T. Kubo, Y. Nishina, Tailoring the Oxygen Content of Graphite and Reduced Graphene Oxide for Specific Applications, Scientific reports 6 (2016) 21715.
[41] C.-H. Chen, S. Hu, J.-F. Shih, C.-Y. Yang, Y.-W. Luo, R.-H. Jhang, C.-M. Chiang, Y. Hung, Jr., Effective Synthesis of Highly Oxidized Graphene Oxide That Enables Wafer-scale Nanopatterning: Preformed Acidic Oxidizing Medium Approach, Scientific reports 7(1) (2017) 3908.
22 [43] A. Kumarasinghe, L. Samaranayake, F. Bondino, E. Magnano, N. Kottegoda, E. Carlino, U. Ratnayake, A. De Alwis, V. Karunaratne, G.A. Amaratunga, Self-assembled multilayer graphene oxide membrane and carbon nanotubes synthesized using a rare form of natural graphite, The Journal of Physical Chemistry C 117(18) (2013) 9507-9519.
[44] A. Patterson, The Scherrer formula for X-ray particle size determination, Physical review 56(10) (1939) 978.
[45] A. Lerf, A. Buchsteiner, J. Pieper, S. Schöttl, I. Dekany, T. Szabo, H. Boehm, Hydration behavior and dynamics of water molecules in graphite oxide, Journal of Physics and Chemistry of Solids 67(5) (2006) 1106-1110.
[46] B. Rezania, N. Severin, A.V. Talyzin, J.r.P. Rabe, Hydration of bilayered graphene oxide, Nano letters 14(7) (2014) 3993-3998.
[47] A. Buchsteiner, A. Lerf, J. Pieper, Water dynamics in graphite oxide investigated with neutron scattering, The Journal of Physical Chemistry B 110(45) (2006) 22328-22338.
[48] G. Socrates, Infrared and Raman characteristic group frequencies: tables and charts, John Wiley & Sons2001.
[49] J. Chen, Y. Zhang, M. Zhang, B. Yao, Y. Li, L. Huang, C. Li, G. Shi, Water-enhanced oxidation of graphite to graphene oxide with controlled species of oxygenated groups, Chemical Science 7(3) (2016) 1874-1881.
[50] L.-Z. Fan, J.-L. Liu, R. Ud-Din, X. Yan, X. Qu, The effect of reduction time on the surface functional groups and supercapacitive performance of graphene nanosheets, Carbon 50(10) (2012) 3724-3730.
[51] D. Yang, A. Velamakanni, G. Bozoklu, S. Park, M. Stoller, R.D. Piner, S. Stankovich, I. Jung, D.A. Field, C.A. Ventrice, Chemical analysis of graphene oxide films after heat and chemical treatments by X-ray photoelectron and Micro-Raman spectroscopy, Carbon 47(1) (2009) 145-152.
[52] L. Stobinski, B. Lesiak, A. Malolepszy, M. Mazurkiewicz, B. Mierzwa, J. Zemek, P. Jiricek, I. Bieloshapka, Graphene oxide and reduced graphene oxide studied by the XRD, TEM and electron spectroscopy methods, Journal of Electron Spectroscopy and Related Phenomena 195 (2014) 145-154.
[53] P.K. Chu, L. Li, Characterization of amorphous and nanocrystalline carbon films, Materials Chemistry and Physics 96(2) (2006) 253-277.
[54] K. Dave, K.H. Park, M. Dhayal, Two-step process for programmable removal of oxygen functionalities of graphene oxide: functional, structural and electrical characteristics, RSC Advances 5(116) (2015) 95657-95665.
[55] C. Kozlowski, P.M. Sherwood, X-ray photoelectron spectroscopic studies of carbon fiber surfaces VIII—A comparison of type I and type II fibers and their interaction with thin resin films, Carbon 25(6) (1987) 751-760.
[56] A. Bagri, C. Mattevi, M. Acik, Y.J. Chabal, M. Chhowalla, V.B. Shenoy, Structural evolution during the reduction of chemically derived graphene oxide, Nature chemistry 2(7) (2010) 581-587.
[57] J.M. Tour, D.V. Kosynkin, Highly oxidized graphene oxide and methods for production thereof, Google Patents, 2016.
[58] T.-F. Yeh, W.-L. Huang, C.-J. Chung, I.T. Chiang, L.-C. Chen, H.-Y. Chang, W.-C. Su, C. Cheng, S.-J. Chen, H. Teng, Elucidating Quantum Confinement in Graphene Oxide Dots Based On Excitation-Wavelength-Independent Photoluminescence, The Journal of Physical Chemistry Letters 7(11) (2016) 2087-2092.
23 [60] V. Panwar, A. Chattree, K. Pal, A new facile route for synthesizing of graphene oxide using mixture of sulfuric–nitric–phosphoric acids as intercalating agent, Physica E: Low-dimensional Systems and Nanostructures 73 (2015) 235-241.
[61] F. Pendolino, N. Armata, Synthesis, Characterization and Models of Graphene Oxide, Graphene Oxide in Environmental Remediation Process, Springer2017, pp. 5-21.
[62] P. Lian, X. Zhu, S. Liang, Z. Li, W. Yang, H. Wang, Large reversible capacity of high quality graphene sheets as an anode material for lithium-ion batteries, Electrochimica Acta 55(12) (2010) 3909-3914.
[63] H.-K. Jeong, Y.P. Lee, M.H. Jin, E.S. Kim, J.J. Bae, Y.H. Lee, Thermal stability of graphite oxide, Chemical Physics Letters 470(4) (2009) 255-258.
[64] I. Jung, D. Dikin, S. Park, W. Cai, S.L. Mielke, R.S. Ruoff, Effect of water vapor on electrical properties of individual reduced graphene oxide sheets, The Journal of Physical Chemistry C 112(51) (2008) 20264-20268.
[65] A. Bagri, R. Grantab, N. Medhekar, V. Shenoy, Stability and formation mechanisms of carbonyl-and hydroxyl-decorated holes in graphene oxide, The Journal of Physical Chemistry C 114(28) (2010) 12053-12061.
[66] D. D’Angelo, C. Bongiorno, M. Amato, I. Deretzis, A. La Magna, E. Fazio, S. Scalese, Oxygen Functionalities Evolution in Thermally Treated Graphene Oxide Featured by EELS and DFT Calculations, The Journal of Physical Chemistry C 121(9) (2017) 5408-5414.
[67] A. Sánchez, F. Mondragón, Role of the epoxy group in the heterogeneous CO2 evolution in carbon oxidation reactions, The Journal of Physical Chemistry C 111(2) (2007) 612-617. [68] C.-M. Chen, Structural Evolution of the Thermally Reduced Graphene NanosheetsDuring Annealing, Surface Chemistry and Macroscopic Assembly of Graphene for Application in Energy Storage, Springer2016, pp. 51-71.
[69] S.H. Huh, Thermal Reduction of Graphene Oxide Physics and Applications of Graphene -
Experiments, 2011.