LEABHARLANN CHOLAISTE NA TRIONOIDE, BAILE ATHA CLIATH TRINITY COLLEGE LIBRARY DUBLIN
OUscoil Atha Cliath
The University of Dublin
Terms and Conditions of Use of Digitised Theses from Trinity College Library Dublin
Copyright statement
All material supplied by Trinity College Library is protected by copyright (under the Copyright and
Related Rights Act, 2000 as amended) and other relevant Intellectual Property Rights. By accessing
and using a Digitised Thesis from Trinity College Library you acknowledge that all Intellectual Property
Rights in any Works supplied are the sole and exclusive property of the copyright and/or other I PR
holder. Specific copyright holders may not be explicitly identified. Use of materials from other sources
within a thesis should not be construed as a claim over them.
A non-exclusive, non-transferable licence is hereby granted to those using or reproducing, in whole or in
part, the material for valid purposes, providing the copyright owners are acknowledged using the normal
conventions. Where specific permission to use material is required, this is identified and such
permission must be sought from the copyright holder or agency cited.
Liability statement
By using a Digitised Thesis, I accept that Trinity College Dublin bears no legal responsibility for the
accuracy, legality or comprehensiveness of materials contained within the thesis, and that Trinity
College Dublin accepts no liability for indirect, consequential, or incidental, damages or losses arising
from use of the thesis for whatever reason. Information located in a thesis may be subject to specific
use constraints, details of which may not be explicitly described. It is the responsibility of potential and
actual users to be aware of such constraints and to abide by them. By making use of material from a
digitised thesis, you accept these copyright and disclaimer provisions. Where it is brought to the
attention of Trinity College Library that there may be a breach of copyright or other restraint, it is the
policy to withdraw or take down access to a thesis while the issue is being resolved.
Access Agreement
By using a Digitised Thesis from Trinity College Library you are bound by the following Terms &
Conditions. Please read them carefully.
ESSAYS ON LABOUR PRODUCTIVITY, TECHNICAL
EFFICIENCY AND FOREIGN DIRECT INVESTMENT IN IRISH
MANUFACTURING INDUSTRY
Ali U gur
D epartm ent o f Econom ics,
U niversity o f Dublin,
Trinity C ollege
Thesis subm itted to Trinity College, Dublin in fulfilm ent o f the
requirem ents for the degree o f D octor in Philosophy (Ph. D.)
DECLARATION
I declare that this thesis, submitted to Trinity College for the degree o f D octor in
Philosophy (Ph. D.) has not been subm itted as an exercise for a degree at this or
any other university. All research contained herein that is not entirely m y own,
but is based on research that has been carried out jointly with others, is duly
acknow'ledged in the text w herever included.
I also authorise the Library o f Trinity College Dublin to lend or copy this thesis
upon request.
SUMMARY
The aim o f this thesis is to investigate the structural change that took place in the
Irish m anufacturing sector during the 1990s
Chapter 2 exam ines the patterns and growth o f labour productivity and
em ploym ent in Irish m anufacturing industry over the 1990s for both dom estic
and foreign firms separately using 2-digit industry level data. W e show that over
the period overall labour productivity growth was 158 per cent. An exam ination
o f this growth by nationality o f ownership shows that labour productivity growth
has been much higher in foreign firms than it has been in their domestic
counterparts, 185 per cent and 37 per cent for foreign and dom estic firms,
respectively which shows evidence o f divergence o f labour productivity in the
Irish m anufacturing sector between foreign and dom estic firms. Our analysis o f
the sectoral growth rates in productivity between 1991 and 1999 shows that the
sectors that are experiencing greater productivity grow th are not the sam e for
foreign as for Irish firms. Thus there is little evidence o f convergence in
productivity levels betw een dom estic and foreign firms across sectors during the
1990s.
productivity im provem ents were the main drivers o f labour productivity growth
for both groups. Results for four OECD sectors show that w ithin-effect
contributes most to overall labour productivity growth in all but one sector,
nam ely high-tech sector in which net entry that is m ainly driven by entry effect
and cross term contribute most. This shows that in high-tech sector, the entry o f
above average firms and em ploym ent expansion in the high productivity firms
has been the main drivers o f the productivity growth.
In Chapter 4 we investigates the technical efficiency levels in the Electrical and
Optical Equipm ent industry in Irish m anufacturing sector and the factors that
could affect these levels utilising a stochastic production frontier approach over
the period 1991-99 using fim i-level panel data. We find that investm ent intensity
plays an im portant role in explaining technical inefficiency levels in all sub
sectors o f the Electrical and Optical Equipm ent industry. W e find some
significant relationship between export intensity and labour quality and the
technical inefficiency levels o f individual fimis.
ACKNOWLEDGEMENTS
M any people contributed to this thesis in one w ay or another, and I wish to
express m y gratitude tow ards them.
First and foremost, I w ould like to thank m y supervisor. P ro f Frances R uane for
her expert supervision, support and encouragem ent throughout m y work on this
thesis.
I am indebted to Tom M cM ahon, Elaine Lucey and Patsy King o f Central
Statistics Office in Cork for the provision o f the data set used in this thesis and
help w ith queries related to it, and to Ben D uffy in Central Statistics O ffice in
D ublin for the help with the adm inistrative work involved.
M any thanks are also due to Dr. Paul W alsh and Dr. H olger Gorg, for
discussions on the subjects included in this thesis. I am also grateful to M atthew
B am es and P ro f Eric Bartelsm an for advice on the com puter source for some o f
the analysis in the thesis. Dr. Suzanne O ’N eill and Dr. Carol N ew m an also
provided helpful com m ents on productivity and technical efficiency subjects,
w hich I am grateful for.
I am grateful to the Policy Institute for aw arding m e a scholarship and IDA and
Enterprise Ireland for financial support and to the D epartm ent o f Econom ics for
giving m e the opportunity to be a teaching assistant.
Last but not least and the m ost im portant for me w as the help and support o f Ann
in every w ay during the period o f this thesis w ithout w hich the com pletion o f
this thesis w ould not have been possible.
TABLE OF CONTENTS
C H A P T E R 1 I N T R O D U C T I O N ...1
1.1 Th e s i s In t r o d u c t i o n...1
1.2 Ai m s OF THE Th e s i s... 2
1.3 Da t a So u r c e... 5
1.4 St r u c t u r e OF THE Th e s i s...7
l A Ta b l e s... 9
C H A P T E R 2 L A B O U R P R O D U C T I V I T Y A N D E M P L O Y M E N T IN I R I S H M A N U F A C T U R I N G I N D U S T R Y ...10
2.1 In t r o d u c t i o n... 10
2 .2 La b o u r Pr o d u c t i v i t y An d Em p l o y m e n t in Ir i s h Fi r m s in t h e Ir i s h Ma n u f a c t u r i n g Se c t o r... 12
2 .3 La b o u r Pr o d u c t i v i t y a n d Em p l o y m e n t in Fo r e i g n- Ow n e d Fi r m s in t h e Ir i s h Ma n u f a c t u r i n g Se c t o r...17 2 . 4 Pr o d u c t i v i t y a n d Em p l o y m e n t Co m p a r i s o n s a c r o s s Fo r e i g n -Ow n e d AND Ir i s h- Ow n e d Fi r m s in t h e Ir i s h Ma n u f a c t u r i n g Se c t o r,
1 9 9 1 - 1 9 9 9 ...2 2 2. 5 Co n c l u s i o n...2 7 2 . A Ta b l e s... 2 9 2 . B Fi g u r e s...4 0 2 . C Ap p e n d i x... 4 2
3.4
D
e c o m p o s i t i o no f P
r o d u c t i v i t y Gr o w t h b y Ow n e r s h i p... 63
3.4.1 O w n e r s h ip D e c o m p o s it i o n , 1 9 9 1 -1 9 9 9 ...63
3.4.2 O w n e r s h ip D e c o m p o s it i o n , 1 9 9 1 -1 9 9 5 ,1 9 9 5 - 1 9 9 9 ...67
3.5
S
e c t o r a lD
e c o m p o s i t i o n...70
3.5.1 O E C D C l a s s i f i c a t i o n ...70
3.5.2 N A C E 2 D igit S e c t o r s ... 75
3.6
Co n c l u s i o n
... 82
3 A
Ta b l e s
... 84
3.B
A
p p e n d i x... 93
C H A P T E R 4 T E C H N I C A L E F F I C I E N C Y IN IR IS H M A N U F A C T U R I N G
I N D U S T R Y , 1 9 9 1 - 1 9 9 9 ... 95
4.1
In t r o d u c t i o n
... 95
4.2
D
e t e r m i n i n gIn e f f i c i e n c y
: M
e t h o d o l o g ya n d
L
i t e r a t u r e96
4.2.1 M e t h o d o l o g y ...96
4.2.2 E a r ly A p p l i c a t i o n s ... 105
4.2.3 A p p lic a tio n s to M a n u f a c t u r i n g S e c t o r ... 106
4.3
M
e a s u r i n gT
e c h n i c a lE
f f i c i e n c yin Ir i s h M
a n u f a c t u r i n gIn d u s t r y
... 110
4 .4
E
m p i r i c a lR
e s u l t s...116
4.5
S
u m m a r ya n d C
o n c l u s i o n...122
C H A P T E R 5 F O R E I G N D I R E C T I N V E S T M E N T A N D P R O D U C T I V I T Y
S P I L L O V E R S IN IR IS H M A N U F A C T U R I N G I N D U S T R Y : E V I D E N C E
F R O M P L A N T L E V E L P A N E L D A T A ...130
5.1
In t r o d u c t i o n
... 130
5.2
In t e r n a t i o n a l
E
v i d e n c e o n Pr o d u c t i v i t y Sp i l l o v e r s... 134
5.4
E
m p i r i c a lM
o d e l a n dM
e t h o d o l o g y... 141
5.5
P
r o d u c t i v i t yS
p i l l o v e r s in Ir e l a n d- A
n Al t e r n a t i v eA
p p r o a c h...145
5.6
S
u m m a r yAND C
o n c l u s i o n s...147
CHAPTER 6 CONCLUSION... 155
6.1
Ov e r v i e w... 155
6.2
Co n c l u d i n g Co m m e n t s a n d Fu t u r e Wo r k... 162
LIST OF TABLES
T able 1.1: R eal G D P, Percentage C hange from P revious P e r io d ... 9 T able 1.2: U nem ploym ent R a te s ... 9 T able 1.3: Productivity Levels In O ECD C ountiies, 1950-98... 9 T able 2.2.1- N et Output, E m ploym ent, Labour Productivity and N um ber o f Irish Firm s in Irish M anufacturing Industry, 1991-1999...29 T able 2.2.2- L abour Productivity (£000) o f Irish Firm s by D ifferent Size G roups
and A ssociated Firm N um bers, 19 9 1 -1 9 9 9 ...30 T able 2.2.3 : Labour Productivity (£000) o f Irish Firm s in 2-D igit Irish
M anufacturing Sectors, 1991-1999 ...31 T able 2.2.4 : Em ploym ent in Irish Firm s in 2-D igit M anufacturing Sectors, 1991-1999...32 T able 2.2.5- Labour Productivity (£000), F irm N um bers and E m ploym ent by O EC D -Sectoral C lassification, 1991-1999... 33 T able 2.3.1- : N et O utput, Em ploym ent, Labour P roductivity and N um ber o f Foreign Firm s
in Irish M anufacturing, 1991-1999...34 T able 2.3.2- : Labour Productivity (£000) o f Foreign Firm s by D ifferent Size G roups
and A ssociated Firm N um bers, 19 9 1 -1 9 9 9 ...34 T able 2.3.3- : Labour Productivity o f Foreign Firm s in Irish M anufacturing Industry
by 2 D igit-S ector in £000, 1991-1999... 35 T able 2.3.4-E m ploym ent in Foreign Firm s in Irish M anufacturing Industry by
2-D igit Sector, 1991-1999 ... 36 T able 2.3.5- Labour Productivity (£000), Firm N um bers and E m ploym ent by O E C D -Sectoral C lassification, 1991-1999...37 T able 2.4.1- L abour Productivity in Irish M anufacturing Industry, 1 9 9 1 -1 9 9 9 ...38 T able 2.4.2 Labour Productivity in Irish M anufacturing Industry by N ationality, 1991-1999... 38 T able 2.4.3- L abour P roductivity R atios f f Irish Firm s to Foreign Firm s
T able 2.C .1- : N um ber o f Irish Firm s in Irish M anufacturing Industry
by 2-D igit Sector, 1 9 9 1 -1 9 9 9 ...42
T able 2.C .2- N um ber o f F oreign F irm s in Irish M anufacturing Industry by 2-D igit Sector, 1 9 9 1 -1 9 9 9 ...43
T able 2.C .3- O E C D -S ectoral P roductivity for F oreign Firm s, 1 9 91-1999... 44
T able 2.C .4- O ECD Sectoral C la ssific a tio n ... 44
T able 3.3.1- Significance o f F oreign Firm s in The Irish M anufacturing Sector, 1999... 84
T able 3.4,1: Labour P roductivity D ecom positions, 1991-1999... 84
T able 3.4.2: Labour P roductivity D ecom positions for F oreign Firm s by N ationality, 1 9 91-1999... 85
T able 3.4.3- Percentage C hanges in N et O utput and E m ploym ent in Irish M anufacturing S ector, 1991-99... 85
T able 3.4.4: Labour P roductivity D ecom positions, 1 9 91-1995... 86
T able 3.4.5: Labour P roductivity D ecom positions, 1995-1999... 86
T able 3.5.1- - L abour P roductivity D ecom positions by O E C D Sectoral C lassification, H igh-T ech 1991-1999 ... 87
T able 3.5.2- L abour P roductivity D ecom positions by O E C D Sectoral C lassification, M edium -H igh T ech 1 9 9 1 -1 9 9 9 ... 87
T able 3.5.3- L abour P roductivity D ecom positions by O E C D Sectoral C lassification, M edium -L ow T ech 1991-1999... 88
T able 3.5.4- L abour P roductivity D ecom positions by O E C D Sectoral C lassification, L ow T ech 1991-1999 ... 88
T able 3.5.5: Labour P roductivity D ecom positions, Irish Firm s, 1991-1995 89 T able 3.5.6: L abour P roductivity D ecom positions, Irish Firm s, 1 9 9 5 -1 9 9 9 ...90
T able 3.5.7: L abour P roductivity D ecom positions, Foreign Firm s, 1 9 9 1 -1 9 9 5 ...91
T able 3.5.8: L abour P roductivity D ecom positions, Foreign Firm s, 1 9 9 5 -1 9 9 9 ...92
T able 3.B.1: L abour P roductivity D ecom positions, Irish Firm s, 1991-1999...93
T able 4.3.3- L abour P roductivity Levels o f Irish Firm in E lectrical and O ptical
Instrum ents Industry, 1991-1999... 125
T able 4.3.4- S ub-S ectors o f E lectrical and O ptical E quipm ent Industry and C orresponding N ace C o d e s ... 125
T able 4.4.1- G eneralised L ikelihood-R atio T ests o f H ypotheses for P aram eters o f the Stochastic P roduction F u n ctio n s... 126
T able 4.4.2- M axim um -L ikelihood Estim ates for P aram eters o f the Stochastic F rontier Inefficiency M o d e ls...127
T able 4.4.3- T echnical E fficiency L e v e ls...128
T able 5.3.1- C hanges in Irish M anufacturing S ector 1991-1998... 150
T able 5.4.1- D escriptive Statistics for R egression V a ria b le s ...151
T able 5.4.2- Sensitivity ff Productivity S pillovers to Sectoral A g g re g a tio n ... 151
T able 5.4.3- Sensitivity o f P roductivity Spillovers to Sectoral A ggregation (G ro w th )...152
T able 5.5.1- Sensitivity o f Productivity Spillovers to Sectoral A ggregation...153
T able 5.5.2- Sensitivity o f Productivity Spillovers to Sectoral A ggregation (G ro w th )...154
LIST OF FIGURES
F igure 2.2.1- L abour P roductivity and E m ploim ent in Irish Firm s
in Irish M anufacturing In d u stry ...40 F igure 2.3.1- L abour P roductivity and E m ploym ent in F oreign Firm s
in Irish M anufacturing In d u stry ...40 F igure 2.4.1- L abour P roductivity in Irish M anufacturing Industry
[image:14.529.20.520.44.762.2]C H A P T E R 1 IN T R O D U C T IO N
1.1
Thesis Introduction
D uring the past decade, the Irish econom y has been characterised by high rates o f
econom ic grow th and low unem ploym ent rates relative to other European U nion
(EU) and OECD countries. The increase in the real Gross Dom estic Product (GDP)
reached double-digits in the period 1995-2000 com pared to grow th rates o f between
2 and 3 per cent in the EU and OECD countries.' Once associated with the high
unem ploym ent rates, especially in the 1980s and early 1990s, this grow th in the
output levels o f the Irish econom y has brought dow n unem ploym ent levels from 15
per cent in 1992 to 3.9 per cent in 2001. Table 1.2 shows that the unem ploym ent
level in the Irish econom y in 2001 was well below the average rates in EU and
O ECD countries. This success in achieving high growth rates o f output and
em ploym ent has been accom panied by substantial increases in the general labour
productivity level o f the econom y, due to higher growth rates obtained in output
relative to the growth in em ploym ent levels. W e can see from Table 1.3 that the
productivity level in Irish econom y, which has been persistently behind those o f
industrialised countries, has now either caught up or surpassed these countries’
productivity levels.
One o f the main contributors to this overall high rates o f growth in the Irish econom y
has been the Irish m anufacturing sector, w hich experienced exceptionally high
grow th rates in term s o f both em ploym ent and output during the period. Total net
' See T able 1.1.output^ has increased by over 200 per cent during the 1991-1999 period accom panied
by a 26 per cent rise in the em ploym ent levels. Foreign D irect Investm ent (FDI),
w hich has played a m ajor role in achieving these grow th rates in term s o f both output
and
em ploym ent,
has
also
facilitated
considerable restructuring
in
Irish
m anufacturing industry and this role has been well docum ented in the literature.^ The
scale o f such FDI is evident in data from Central Statistics O ffice (CSO), which
show that in 1999, foreign firms accounted for 83 per cent o f net output and 49 per
cent o f em ploym ent in the Irish m anufacturing sector. In 1999 these foreign firms
exported approxim ately 93 per cent o f their output, w hich in turn accounted for 90
per cent o f all m anufactured exports from Ireland.
W hile em ploym ent creation has been the main focus o f attention in Ireland for most
o f the past forty years, since the m id-1990s, especially as unem ploym ent rates have
declined, there has been a shift o f em phasis tow ards focusing on labour productivity
o f Irish firms and creating linkages between foreign and dom estic firms'* as well as
em ploym ent. Growth in living standards is seen as being crucially dependent on
increasing labour productivity, especially in the m anufacturing sector.
1.2
Aim s o f the Thesis
productivity using highly aggregated industry data^, w hich can hide the underlying
dynam ics o f change. In this thesis we try to shed m ore light into the understanding o f
the changes that took place in Irish m anufacturing industry over the 1990 utilising a
firm level panel data set. Specifically we focus on the changes in labour productivity
and technical efficiency levels and the productivity effects o f foreign firms in Irish
m anufacturing industry.
The first two chapters exam ine the changes in the labour productivity levels across
the m anufacturing sector. W e begin by providing a detailed picture o f the
productivity changes that took place in Irish m anufacturing industry at 2-digit
industry level over the period. First we investigate em ploym ent and labour
productivity grow th both in indigenous and foreign com panies in the Irish
m anufacturing sector and try to ascertain w hether the differences in labour
productivity at industry level are related to firm size or sector structure in each o f
them. Next we m ake com parisons o f differences between the labour productivity
levels o f foreign and dom estic firms and investigate w hether the differences in
productivity levels w ere increasing or decreasing over the 1990s. The distinguishing
feature o f this part o f our study from other studies in the literature on investigation o f
labour productivity differences betw een foreign and dom estic firms is that we
provide analysis o f the differences in labour productivity for different size groups o f
firms using a m ore disaggregated sectoral level.
Investigation o f grow th patterns in em ploym ent and output at aggregate level are
im portant in exam ining productivity growth, but m uch o f this change takes place
w ithin individual firms; hence an understanding o f the changes taking place at the
^ Some examples are Barry et al. (1999), Kearns (2000) and O ’Muircheartaigh (2000).
individual firm level is im portant. It is often argued in the literature that even in the
sam e narrow ly defined industries it is not unusual to observe new or expanding
producers as well as exiting or contracting ones, w hich play a m ajor role in
determ ining overall industry productivity change.^ In order to investigate the
contribution o f continuing, entering and exiting firms to the overall labour
productivity growth in Irish m anufacturing industry w e apply decom position
techniques w idely used in the literature at plant level. W e recognise that overall
productivity reflects the balance between foreign and dom estic firms but in order to
reveal the different patterns that exist in Irish m anufacturing industry w e separate out
the labour productivity levels as between foreign and indigenous com panies.
technical efficiency in dom estic m anufacturing firms in Ireland and exam ine the
factors, such as export intensity, labour quality and investm ent intensity, w hich can
affect the changes in technical efficiency levels.
In term s o f FDI, Ireland is one o f the m ost globalised econom ies in the world, having
pursued a strategy o f prom oting green-field investm ent in the m anufacturing sector
by foreign com panies for over forty years. It is often argued in the literature that the
investm ents o f M NCs generate im portant externalities that enhance the productivity
o f indigenous firms in the economy. These externalities, w hich are typically referred
to as “positive productivity spillovers”, are seen as helping to im prove the
com parative advantage o f the econom y over time. R ecognising the im portance o f
foreign firms in Irish m anufacturing industry, in our final analysis, we investigate
w hether dom estic finns benefit from the entry or presence o f M NCs in Irish
m anufacturing industry in term s o f increased productivity levels.
1.3
Data Source
The data used in this thesis are from the Irish Census o f Industrial Production (CIP). ^
This census is carried out annually by the Central Statistics O ffice in Ireland and
covers all industrial local units with 3 or more persons engaged. As such it is the only
fully representative survey o f m anufacturing plants in Ireland.
^ To facilitate the research necessary for this thesis, the Central Statistics O ffice gave controlled access to anonym ised micro data. This access was at all times within the CSO's premises and under stringent and rigorous conditions. A ccess such as this is provided for in the Statistics Act, 1993 solely for statistical research purposes.
The Census com prises two separate annual inquiries, nam ely the Census o f Industrial
Enterprises and the Census o f Local Units. An enterprise is defined as the sm allest
com bination o f legal units that are w holly or prim arily involved in industrial
production, w hereas a local unit could be an enterprise or part o f an enterprise
situated in a geographically identified place. The choice betw een using enterprise or
plant level data depends on the aims o f the study. It is often argued in the literature
that for analysis involving productivity and especially entry and exit o f plants, plant
level data are more suitable because an enterprise consisting o f separate local units
can have changes in its em ploym ent or output levels in each local unit, w hich might
Q
cancel out at the enterprise level. Also in the Irish m anufacturing sector most
enterprises consist o f single local units.^ Hence in this thesis we use data from the
Census o f Local Units and all calculations carried out at the m icro level refer to the
plant level data.
The data available are those standard for such Censuses - output (gross and net),
sales, em ployment, w ages, capital additions, sectoral (N ACE 4-digit) and regional
(county) classification as well as nationality o f ownership. In the case o f incom plete
responses'®, they are fully estim ated even w hen only a few o f the m ost im portant
variables such as em ploym ent, type o f industrial activity are k now n.”
In the CIP the classification by nationality o f ow nership is determ ined by the
nationality o f the ow ners o f 50 per cent or m ore o f the share capital. There are no
details recorded on the extent o f foreign ow nership w ithin a given com pany and thus
it is not possible to determ ine the im pact o f different shares o f foreign ow nership, as
done in several panel level data studies for other countries. FDI policy in Ireland
does not require m inim um dom estic equity participation as is the case in m any
developing countries, and m ost FDI is in the form o f green-field investm ent with
100% foreign ownership.
1.4
Structure o f the Thesis
This thesis contains four essays that exam ine the structural change that took place in
the Irish m anufacturing sector. Studies in other countries on productivity typically do
not distinguish between foreign and dom estic firms in their analysis. In Irish
m anufacturing industry, as we outlined above, it is well docum ented that foreign and
dom estic firms have several different characteristics. So in this study, w here data,
allow ing for confidentiality constraints permit, w e carry out our analysis separately
for dom estic and foreign firms.
C hapter 2 exam ines the changing patterns o f em ploym ent, net output and labour
productivity in Irish m anufacturing industry for both dom estic and foreign firms
during the 1991-99 period using different size classifications and sectoral
disaggregation. In addition to the usual NACE 2-digit classification system we utilise
O ECD classification system o f sectors according to their technology intensity. W e
also provide descriptive m easures for different nationality groups am ong foreign
firms.
In C hapter 3 we investigate the dynam ics o f factors underlying the changes in the
labour productivity levels in Irish m anufacturing industry utilising a decom position
approach. In addition to the usual analyses carried out in the literature, we provide
results for both foreign and dom estic firms separately as w ell as different nationality
groups am ong foreign firms.
Chapter 4 uses a stochastic production frontier approach to estim ate the technical
efficiency levels o f Irish m anufacturing firms and to investigate the factors that affect
these efficiency levels. O ur analysis in this chapter focuses on the Electrical and
Optical Equipm ent industry, w hich played a m ajor role in the industrial policy that,
has been followed over the last thirty years in the Irish economy.
W e investigate the possible “positive productivity spillovers” from FDI to dom estic
firms in the Irish m anufacturing sector in Chapter 5 to exam ine w hether dom estic
firms benefited from the entry or presence o f foreign firms in increasing their
productivity levels.
l A
Tables
Table 1,. 1: Real GDP, Percentage Change from Previous Period 1991 1993 1995 1997 1998 1999 2000 2001
Ireland 1.9 2.7 10.0 10.8 8.6 10.8 11.5 6.6
Germany 5.0 -1.1 1.7 1.4 2.0 1.8 3.0 0.6
U.K. -1.4 2.5 2.9 3.4 3.0 2.1 3.0 2.2
Japan 3.1 0.4 1.6 1.8 -1.1 0.7 2.4 -0.4
Australia -0.7 3.8 3.9 3.5 5.4 4.5 3.4 2.4
U.S. -0.5 2.7 2.7 4.4 4.3 4.1 4.1 1.2
EU 1.8 -0.3 2.5 2.6 2.9 2.6 3.4 1.7
OECD Area 1.2 1.4 2.5 3.5 2.7 3.1 3.9 1.0
Source: OECD Economic Outlook 71, June (2002)
Table 1.2: Unemployment Rates
1991 1993 1995 1997 1998 1999 2000 2001
Ireland 14.4 15,7 12.2 10.4 7.6 5.6 4.3 3.9
Germany 5.4 7.6 7.9 9.4 8.9 8.2 7.5 7.4
U.K 8.2 10.3 8.5 6.5 5.9 6 5.5 5.1
Japan 2.1 2.5 3.1 3.4 4.1 4.7 4.7 5.0
Australia 9.2 10.6 8.2 8.2 7.7 6.9 6.3 6.8
U.S 6.8 6.9 5.6 4.9 4.5 4.2 4 4.8
EU 7.7 10.2 10.1 10 9.4 8.7 7.8 7.4
OECD Area 6.3 7.7 7.3 6.9 6.7 6.6 6.1 6.4
Source: OECD Economic Outlook 71, June (2002)
Table 1.3: Productivity Levels in OECD Countries, 1950-98 (GDP per man-hour relative to United States)
1950 1973 1987 1992 1998
Ireland 32 46 66 77 86
Germany - - - 87 90
United Kingdom 58 68 81 79 82
Japan 15 45 60 67 68
Australia 66 69 77 75 78
United States 100 100 100 100 100
Source: Scarpetta et al. (2000)
CHAPTER 2 LABOUR PRODUCTIVITY AND EMPLOYMENT
IN IRISH MANUFACTURING INDUSTRY
2.1
Introduction
For m any decades em ploym ent creation has been the priority for industrial policy in
Ireland. This objective stem m ed from the m ajor need to restructure the economy,
prim arily out o f the agricultural sector and more recently out o f the older sectors
within m anufacturing and into the newer, higher-value sectors. As the Irish econom y
has m oved closer to full em ploym ent in the 1990s, there has been a shift o f emphasis
towards focusing on labour productivity as well as em ployment. G row th in living
standards is seen as being crucially dependent on increasing labour productivity,
especially in the m anufacturing sector. It has been argued in the literature that such
productivity increases can be the result o f a range o f factors, such as: the
establishm ent o f new enterprises w hose labour productivity is higher than that o f the
average in the sector; the closure o f below -average productivity enterprises w ith low
productivity; and increases in the actual productivity o f existing firms.
is often to blur the very different patterns that operate in Irish m anufacturing, w hile
recognizing that overall productivity reflects the balance betw een them.
In Section 2.2 we look at how labour productivity and em ploym ent have changed in
indigenous com panies in the Irish m anufacturing sector over the 1990s. W e exam ine
differences in productivity as related to size and sector. Section 2.3, exam ines the
productivity o f labour and em ploym ent in foreign com panies in the Irish
m anufacturing sector, again distinguishing betw een different size classes o f
com panies and the sector in w hich they operate. Finally in Sector 2.4 w e exam ine
w hether there is any apparent relationship between the productivity levels
experienced by indigenous com panies and by m ultinational enterprises (M NEs) in
the same sectors.
All data used in the analysis cover the period 1991-1999 and com e from the Central
Statistics O ffice’s Census o f Industrial Production (CIP).'^ One o f the advantages o f
this survey is its com prehensive coverage o f m anufacturing industry w here all firms
in the sector with three or more em ployees are included.
All value figures
expressed in the analysis are in Irish £s and in 1985 prices, w here net output is
deflated using relevant Producer Price Indices given at 2-digit and 3-digit sector
levels.
Details o f data are outlined in Chapter 1.
There are similar surveys for the Irish manufacturing industry such as Irish Econom y Expenditure surveys carried out by Forfas. Although this survey includes internationally traded sectors as well as manufacturing industry it only covers firms with 10 or more em ployees which excludes quite a lot o f firms in the Irish manufacturing sector given the low average size o f firms.
2.2
Labour Productivity And Em ploym ent in Irish Firms in the Irish
M anufacturing Sector
In this section we look at em ploym ent and labour productivity grow th in the
indigenous com panies in the Irish m anufacturing sector. Table 2.2.1 shows that net
output in Irish m anufacturing firms grew by 57 percent in real term s over the 1990s.
At the same tim e total em plojroent rose by 15 percent overall, bringing to an end the
long trend decline in m anufacturing em ploym ent in Irish-ow ned firms experienced
since the 1970s.
As is evident from Figure 2.2.1, the m ost rapid period o f
em ploym ent growth was between 1994 and 1997, with the periods on either side o f
this being m arked by virtually no change in em ploym ent.'^ As the num ber o f Irish-
owned firms increased by 8 percent, the average em ploym ent size o f Irish-owned
firms increased - again in contrast to the experience o f the 1980s. O ver the period,
labour productivity rose by 37 percent w here productivity increased at a steady pace
except between 1994 and 1995 when it suffered a slight decline.
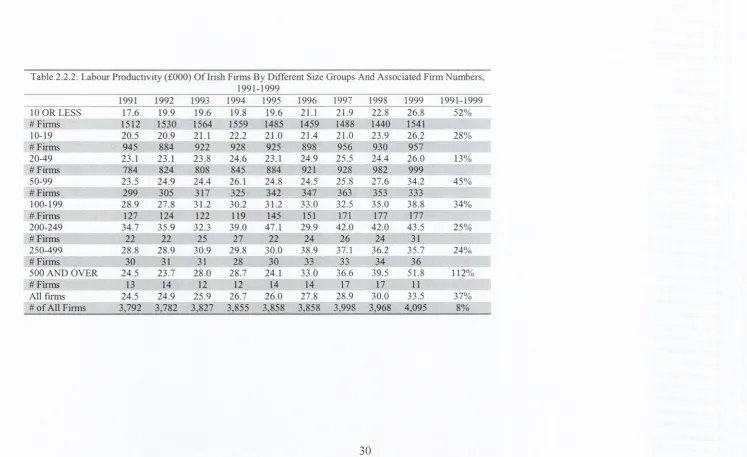
rates o f productivity increase in all sectors apart from those with 500+ employees.
This w ould seem to suggest that whereas m any sm aller (<10 em ployees) firms in the
early 1990s were low productivity firms, in the latter part o f the 1990s m any o f these
very small firms had productivity levels that m atched or bettered those in the size
ranges 10-49.
The exceptionally high growth rates in productivity in the 500+ category has
w idened the range o f labour productivity across the indigenous sector over the 1990s
- this category has almost tw ice the productivity levels o f firms with em ploym ent
below 50. The sharp increase in labour productivity in this group in 1999, com bined
with the fall in firm num bers from 17 to 11, suggests that at least som e o f the firms
which exited this group (either through closure or to their entering another size
category) had productivity levels below the productivity levels o f those firms
continuing to operate in the sector. W hile there is a general upw ard trend in the
relationship between productivity levels and firm size, it is clear that this is not
uniform, undoubtedly reflecting differences in other characteristics associated with
the firms and in particular with the sectors in w hich they operate.
We now turn to look at the sectoral com position o f labour productivity over the
1990s using the familiar tw o-digit N A CE classification and present results in Table
2.2.3. To facilitate discussion, the sectors are ranked according to their productivity
levels in 1999. These range from the highest productivity in Pharm aceuticals to the
lowest in M otor Vehicles and Transport - a ratio o f over 7:1, w hich is significantly
higher than the productivity ratio for the highest (Chem icals) to the low est (Textiles
& Clothing) o f 4.5:1 in 1991.
This reflects the exceptionally fast grow th in
productivity (210% ) in the Pharm aceuticals sector (and particularly betw een 1998
and 1999) and the decline in labour productivity (-2% ) in M otor V ehicles and
Transport over the period.
Thus the labour productivity growth o f 37 percent on average in real term s over the
period masks a w ide variation in grow th patterns in productivity levels across
sectors.
The average labour productivity for Irish m anufacturing firms was £33.5k
in 1999. All o f the traditional sectors with the exception o f Food, Beverages &
Tobacco have below average productivity levels and O ffice M achinery & Com puters
is the only “high-tech” sector with below average productivity, reflecting the low rate
o f growth in productivity in that sector over the 1990s. Labour productivity in the
Chem icals sector remains high despite the fact that labour productivity in that sector
declined over the 1990s.
The relationship between labour productivity and
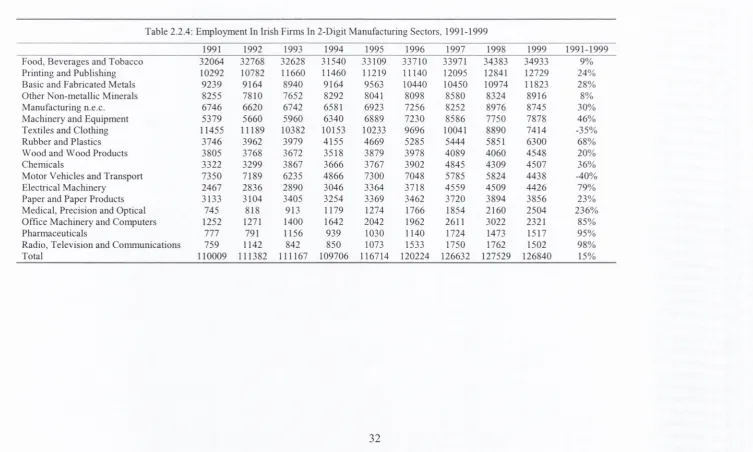
em ploym ent growth w ithin sectors can be exam ined by com paring Tables 2.2.3 and
2.2.4.
labour productivity in 1999. The growth rates in m any o f the high-tech sectors are
very im pressive, especially in the late 1990s, but this grow th starts from a relatively
small base.
The structural readjustm ent that is taking place is evident in the
differences in the ranking o f sectors by em ploym ent size betw een 1991 and 1999.
For example, w hile Textiles & Clothing was the second largest sector in em ploym ent
terms in 1991, by 1999 it had slipped to seventh place.
Since overall productivity in Irish firms depends on com position, it is im portant to
ask what is happening to em ploym ent growth in the sectors in w hich productivity is
grow ing fastest. We calculate the Pearson rank correlation coefficient for the final
two columns in Tables 2.2.3 and 2.2.4 in order to exam ine the relationship between
em ploym ent and productivity growth in individual 2-digit sectors. The value o f this
coefficient is 0.27 indicating a relatively weak correlation betw een productivity and
em ploym ent growth rates o f dom estic establishm ents over the 1991-1999 period.
W hile the tw o-digit sectors show how different productivity levels are across sectors,
they are som ew hat too diffuse to create a general picture. An alternative sectoral
decom position that is possible uses the OECD classification o f firms at the three/four
digit level to generate four classes o f sectors: high tech, m edium high tech, m edium
low tech, and low tech and we present the results in Table 2.2.5 (The sub-sectors
included in the different sectors are listed in A ppendix in Table 2.C.4.)
W hat is most striking from Table 2.2.5 is the small portion o f establishm ents (2.4% )
and em ploym ent (4.2%) accounted for by Irish-ow ned firms operating in w hat the
OECD defines as high tech sectors. These low percentages persist despite the fact
2.3
Labour Productivity and Em ploym ent in Foreign-O w ned Firms in the
Irisli M anufacturing Sector
Foreign firms play an im portant role in Irish m anufacturing industry, accounting for
83 per cent o f net output and nearly 50 per cent o f overall em ploym ent in 1999. In
this section we exam ine labour productivity levels across foreign ow ned firms in
different size classifications and sectors. Due to the com plex m anner in w hich M NEs
do business internationally, the m easurem ent o f labour productivity in any individual
plant m ay understate or overstate the true productivity in that plant since statistics are
collected on a local rather than a global b a s i s . B y contrast, there are no such
difficulties with em ploym ent data and w hile there m ay be difficulties w ith m easuring
labour productivity in foreign-ow ned com panies, we do not expect these difficulties
to alter the m easurem ent over time.
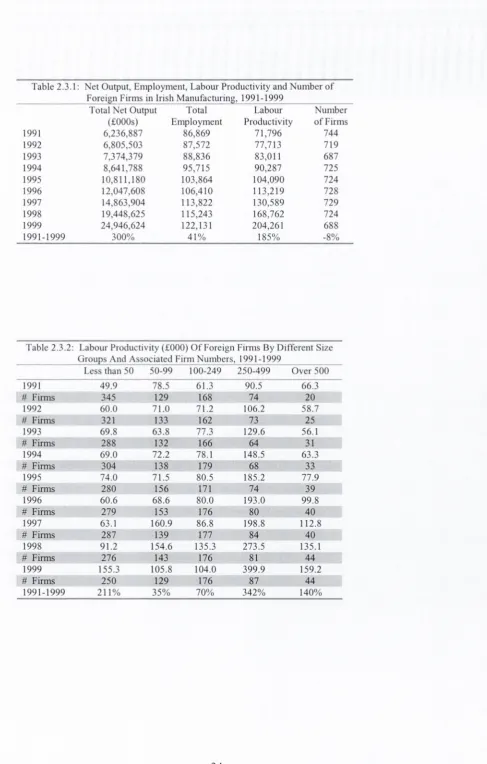
Table 2.3.1 and Figure 2.3.1 show that there has been a steady upward rise in net
output and em ploym ent in foreign firms over the 1990s.
Labour productivity
increased by over 180% as net output grew faster than em ploym ent. The growth o f
em ploym ent o f 41 percent was exceptional in the context o f other EU countries in
the same period, and reflected Ireland’s significant success in w inning FDI
m anufacturing projects during the 1990s'^. It is notew orthy that the num ber o f
foreign firms operating in the Irish m anufacturing sector actually fell by 8 percent
over the period, implying that, in term s o f employment, average firm size has risen.
This contrasts with results from the 1980s, w hen average firm size fell.
E vid en ce in Stew art (1 9 8 9 ) and M urphy (1 9 9 8 ) su ggests that foreign firm s in certain sectors o f Irish m anufacturing industry are in v o lv ed in transfer pricing practices in order to avail o f the lo w
corporation tax rate.
For a detailed d iscu ssio n see Ruane and G org (1 9 9 7 ,1 9 9 8 )
[image:31.529.27.522.48.753.2]Table 2.3.2 shows that the num ber o f foreign-ow ned enterprises has fallen in the
sm allest size category o f firms (less than 50 em ployees), has risen m odestly in the
interm ediate size categories and has risen dram atically (m ore than doubled) in the
size category over 500 em ployees. One striking feature in the table is that over 37%
o f foreign-ow ned firms have less than 50 em ployees. On further reflection this is not
so strange as over this period there was a very high level o f new firm formation.
These small firms enjoyed very substantial growth in productivity over the period,
surpassing the rates o f productivity increase in all sectors apart from those in the
em ploym ent category 250-499. W hereas m any o f these sm aller firm s in the early
1990s w ere low producdvity firms, in the latter part o f the 1990s m any o f these had
productivity levels that m atched or bettered those in the size ranges 50-149.
[image:32.529.30.524.42.761.2]average labour productivity was lowest am ongst the sm allest firms, by the end o f the
1990s this category had higher productivity than firms in the 50-100 and 100-250
ranges. Again the question arises as to what has determ ined this change - the arrival
o f higher productivity firms, the departure o f low productivity firms, or an increase
in the productivity o f existing firms?
We now turn to look at the sectoral com position o f factor productivity over the 1990s
using the familiar tw o-digit N A CE classification. To facilitate subsequent discussion,
the sectors are ranked using the same sectoral order as for the indigenous sector in
Table 2.3.3. Labour productivity in Chem icals in 1999 at £833k is tw enty six times
the productivity in the lowest sector (Textiles & Clothing); the corresponding ratio
for 1991 was 12:1.
This reflects the exceptionally fast grow th in productivity
(364% ) in the Chem icals sector, w hile labour productivity in Textiles & Clothing
grew at over 90%.
In Table 2.3.3 we see that the exceptionally high value added in four sectors in 1999,
nam ely. Chem icals, Pharm aceuticals, Printing & Publishing, and Food & Beverages,
is driving the average labour productivity in m anufacturing, due to the large relative
size o f these sectors in term s o f total em ployment. All the rem aining sectors have
below average labour productivity. The relationship betw een labour productivity and
em ploym ent grow th w ithin sectors can be exam ined by com paring Tables 2.3.3 and
2.3.4.
As in the case o f Table 2.2.4, sectors in Table 2.3.4 are ranked according to their
highest levels o f em ploym ent in 1999. The m odem high-tech sectors account for
[image:33.529.36.523.33.763.2]m ost o f the em ploym ent in foreign-owned firms, and thus it is not surprising the
overall labour productivity o f foreign firms is high, since these sectors have the
highest producfivifies in Table 2.3.3. The only exception to the dom inance o f high-
tech sectors is Food, Beverages & Tobacco, the fourth largest sector that accounts for
10% o f total em ploym ent in foreign-ow ned firms. H owever, it is notew orthy that
em ploym ent in this traditional sector declined slightly over the period (-1% ) w hile
overall em ploym ent in foreign firms increased by 41%.
It is evident that a considerable am ount o f structural adjustm ent took place in the
foreign com ponent o f the m anufacturing sector during the 1990s as em ploym ent fell
in seven out o f the seventeen sectors listed. The structural readjustm ent is evident in
the differences in the ranking o f sectors by em ploym ent size betw een 1991 and 1999.
In order to exam ine the relationship between em ploym ent and productivity growth
across sectors in w hich productivity is grow ing fastest we calculate the Pearson rank
correlafion coefficient for the final two colum ns in Tables 2.3.3 and 2.3.4. We find
that for foreign firms, sectors w hich are experiencing higher productivity growth are
not the same as sectors experiencing higher em ploym ent growth, as evident by a
correlation coefficient value o f only 0.07.
11% and em ploym ent by 159%. By 1999 the portions o f foreign-ow ned
establishm ents and em ploym ent in the high-tech sectors w ere 16% and 30%
respectively com pared w ith 13% and 16% respectively in 1991. This points to the
very significant growth in em ploym ent in high-tech sectors, w here labour
productivity almost doubled over the period.
The m ost striking feature o f this table from, a labour productivity perspective, is that
labour productivity in the m edium -high tech and low-tech sectors in Ireland actually
exceeded that in the high-tech sectors towards the end o f the decade. In the case o f
the foreign sector the low productivity activities are found in the m edium low-tech
sector, w hich saw an increase in em ploym ent o f 25% over the period. From a policy
perspective it is im portant to note that, as in the case o f dom estically-ow ned industry,
high tech does not necessarily equate to high labour productivity - labour
productivity measures value added per unit labour and this can be high because o f
m arketing/patents, etc w ithout any significant technology being em bedded in the
product or indeed any high physical productivity o f labour. In effect w hat we could
be seeing here is that there are activities/niches in the low -tech sectors in Ireland,
w hich have very high productivity. This is especially so in the Food, Beverages &
Tobacco sector. We return to this issue in Section 2.4 below.
2.4
Productivity and Em ploym ent Comparisons across Foreign-O w ned and
Irish-O wned Firms in the Irish M anufacturing Sector, 1991-1999
Table 2.4.1 shows that the overall growth o f 158% in labour productivity in
m anufacturing in the period 1991-1999 is a product o f very rapid growth in the
foreign com ponent (185% ) and much more m odest growth in the domestic
com ponent (37%).
W hereas in 1991 labour productivity in Irish com panies
registered one third that o f foreign com panies, by 1999 this ratio had been halved to
one sixth.
Since the com position o f direct foreign investm ent changed som ew hat over the
1990s, w ith increased extra-EU investm ent and much less intra-EU investm ent, it is
insightful to look at the differences in productivity growth decom posed into four
categories - UK, O ther EU, US and O ther Non-EU. This is exam ined in Table 2.4.2.
In term s o f nationalities, the productivity o f O ther EU firms in both 1991 and 1999
was closest to that o f Irish firms, with the UK in the next highest place. In the case
o f both o f these categories, labour productivity grew at a faster pace than did
productivity in Irish com panies, and thus the pattern o f a w idening gap relates to all
nationality categories. The num bers o f firms located in Ireland fell over the period -
by ju st over 10 percent in the case o f the U K and over 15 percent in the case o f Other
EU firms, in contrast with the growth in firm num ber o f 8% in the case o f Irish firms.
US firms w ere the only foreign nationality group to increase in num ber over the
1990s - by alm ost 9 percent (with peak num ber in 1998); and at the sam e tim e their
average labour productivity increased at the fastest pace (by 185 percent) - more
than three tim es the rate o f average productivity increase experienced by U K firms.
The labour productivity o f the “O ther non-EU ” category increased by over 91
percent during the period, while, in contrast with the US, the num ber o f firms in this
category fell steadily from 1996 onwards - by over 30 percent. This suggests that at
least some o f the increase in average productivity m ay have been due to the closure
o f low er productivity companies.
In order to focus on the contrast betw een Irish and foreign-ow ned firms over the
1990s, we use the data in Sections 2.2 and 2.3 to generate productivity ratios (Irish to
foreign) by size and sector.
Table 2.4.3 shows that the decline in the overall relative productivity o f Irish firms is
found in all size categories with the exception o f the 50-99 size, w here Irish average
productivity increased faster than foreign productivity though it still rem ains at only
a third o f foreign productivity.
From a policy perspective the relatively better
perform ance o f Irish firms in the 500+ category is consistent w ith their becom ing
successful global players, though the overall productivity levels are still less than
40% o f foreign productivity levels.
[image:38.529.28.520.44.773.2]period. M edium -high and low -tech are falling behind though this is prim arily due to
the rapid productivity grow th o f foreign firms in the Chem icals sector, w hich is in
the m edium -high-tech group, and in the Food, Beverages & Tobacco and Printing &
Publishing sectors, w hich are in the low -tech sectors.
In order to take account o f sectors that are know n to have exceptionally high value
added in Ireland, w e present in Table 2.4.5 am ended productivity ratios where
foreign firms in the following sectors have been rem oved from the calculations:
•
Pharm aceuticals from the High tech sector
•
Chem icals from the M edium high tech sector
•
Soft Drinks and Recorded M edia publications from the Low-tech sector.
The basis for the foreign productivity data used in calculating the ratios here is
presented in Table 2.C.3 in the A ppendix, which shows that foreign productivity
growth in these excluded sectors was over 650% during the period 1991-1999. The
exclusion o f Pharm aceuticals has a m odest (tw o-percentage point) negative im pact
on the labour productivity growth in the High tech sector w hile the exclusion o f
Chem icals had a significantly large positive im pact on productivity grow th in the
M edium high tech sector, reflecting the low rate o f productivity growth in
Chem icals, w hile having a high absolute level o f productivity'^. The am ended Low-
tech productivity growth rate dram atically reduced (by m ore than half) as a
consequence o f the exclusions o f foreign firms producing Soft D rinks and Recorded
M edia publicafions.
The growth in the labour productivity o f the high-tech sector for foreign firms is 98 per cent in Table 2.3.5 whereas this growth rate decreases to 96 per cent in Table 2.A .3 where pharmaceuticals industry is removed from the calculations.
[image:39.529.26.521.46.752.2]The impact o f rem oving these sectors is to raise the productivity ratios significantly
in all but the M edium -Low tech sector, w hich is unchanged by the em endation. In
the case o f the High-tech sector, the am ended ratio stays constant over the period,
w hile in the M edium -High it falls by a greater am ount and in the Low-tech sector by
a lesser amount.
2 . 5
Conclusion
This chapter shows the patterns o f growth in productivity and em ploym ent in Irish
m anufacturing industry over the 1990s. O ver the period 1991-99, labour productivity
in Irish m anufacturing industry increased by 158 per cent and m ost o f this increase
cam e through the foreign firms, w hich increased their average productivity by 185
per cent w hile their dom estic counterparts enjoyed a m ore m odest increase o f 37 per
cent.
A detailed analysis o f labour productivity levels for both dom estic and foreign firms
showed that there are striking differences across firm size, 2-digit sectors and
geographical regions. Com parison o f productivity levels o f indigenous and foreign
firms at individual 2-digit N ACE sectors showed that labour productivity difference
between the two has increased over the period, reflecting the fact that dom estic firms
w ere not able to catch up w ith their foreign counterparts.
Recognising the fact that foreign firms in som e sectors o f Irish m anufacturing
industry engage in transfer pricing in order to avail o f the low corporation tax rates,
w hich results in overstated value added figures, we excluded these sectors in our
broad analysis o f the four OECD sector groups. Results show that the high
divergence betw een the productivity levels o f foreign and dom estic firms somewhat
reduce or increase at a m uch slow er rate, reflecting the fact that dom estic firms have
at least lost no productivity ground.
Even accounting for the high value-added
sectors, this shows that there is still a labour productivity gap betw een dom estic and
foreign firms in Irish m anufacturing industry.
2. A
Tables
Table 2.2.1: Net Output, Employment, Labour Productivity and Number o f Irish Firms in Irish Manufacturing Industry, 1991-1999 Total Net Output
(£000s)
Total Employment
Labour Productivity
Number of Firms
1991 2,701,387 110,009 24,556 3,792
1992 2,770,028 111,382 24,870 3,782
1993 2,877,324 111,167 25,883 3,827
1994 2,924,290 109,706 26,656 3,855
1995 3,034,622 116,714 26,000 3,858
1996 3,347,314 120,224 27,842 3,858
1997 3,657,263 126,632 28,881 3,998
1998 3,814,947 127,529 29,914 3,968
1999 4,252,372 126,840 33,525 4,095
1991-1999 57% 15% 37% 8%
Note: In this table and all subsequent tables, value figures are in Irish £s and 1985 prices.
Table 2.2.2: Labour Productivity (£000) O f Irish Firms By Different Size Groups And Associated Firm Numbers, 1991-1999
1991 1992 1993 1994 1995 1996 1997 1998 1999 1991-1999
10 OR LESS 17.6 19.9 19.6 19.8 19.6 21.1 21.9 22.8 26.8 52%
# Firms 1512 1530 1564 1559 1485 1459 1488 1440 1541
10-19 20.5 20.9 21.1 22.2 21.0 21.4 21.0 23.9 26.2 28%
# Firms 945 884 922 928 925 898 956 930 957
20-49 23.1 23.1 23.8 24.6 23.1 24.9 25.5 24.4 26.0 13%
# Firms 784 824 808 845 884 921 928 982 999
50-99 23.5 24.9 24.4 26.1 24.8 24.5 25.8 27.6 34.2 45%
# Firms 299 305 317 325 342 347 363 353 333
100-199 28.9 27.8 31.2 30.2 31.2 33.0 32.5 35.0 38.8 34%
# Firms 127 124 122 119 145 151 171 177 177
200-249 34.7 35.9 32.3 39.0 47.1 29.9 42.0 42.0 43.5 25%
# Firms 22 22 25 27 22 24 26 24 31
250-499 28.8 28.9 30.9 29.8 30.0 38.9 37.1 36.2 35.7 24%
# Firms 30 31 31 28 30 33 33 34 36
500 AND OVER 24.5 23.7 28.0 28.7 24.1 33.0 36.6 39.5 51.8 112%
# Firms 13 14 12 12 14 14 17 17 11
All firms 24.5 24.9 25.9 26.7 26.0 27.8 28.9 30.0 33.5 37%
Table 2.2.3: Labour Productivity (£000) o f Irish Firms in 2-Digit Irish Manufacturing Sectors, 1991-1999
1991 1992 1993 1994 1995 1996 1997 1998 1999 1991-1999
Pharmaceuticals 32.5 29.5 20.3 32.6 31.2 35.2 56.0 44.8 100.8 210%
Chemicals 53.9 50.9 47.33 56.3 56.4 72.7 56.0 60.3 52.1 -3%
Other Non-Metallic Minerals 30.5 31.9 37.0 38.9 40.2 40.7 43.7 44.5 48.2 58%
Medical, Precision and Optical 25.5 32.4 36.5 32.7 31.3 37.6 45.3 42.9 43.4 70%
Food, Beverages and Tobacco 31.0 30.4 31.7 31.1 30.7 32.5 32.1 34.9 38.8 25%
Paper and Paper Products 29.1 32.2 34.9 34.5 37.1 33.0 34.3 35.4 38.5 33%
Publishing and Printing 22.8 23.0 22.7 25.0 23.8 25.4 27.3 28.6 35.2 54%
Radio, Television and Communications 19.8 16.7 21.2 19.8 19.2 25.0 25.4 33.0 34.4 74%
M anufacturing n.e.c. 24.9 26.3 25.5 23.3 27.0 26.1 33.5 34.8 31.5 26%
Office M achinery and Computers 28.8 29.6 26.9 28.3 22.6 31.0 26.0 28.0 31.1 8%
Electrical M achinery 17.5 17.8 16.4 18.9 19.9 20.3 20.7 22,3 25.6 46%
Rubber and Plastics 21.1 21.9 22.7 24.6 22.2 23.0 23.6 23.1 24.9 18%
Basic and Fabricated Metals 21.1 20.9 21.4 20.6 21.5 22.0 23.5 23.9 24.8 18%
Machinery and Equipment 20.9 20.2 20.3 22.6 20.8 24.5 27.7 25.3 24.5 17%
W ood and W ood Products 14.1 15.7 15.8 16.4 14.7 16.9 18.2 17.9 21.1 50%
Textiles and Clothing 12.2 13.3 13.9 14.1 14.0 14.1 15.5 15.3 16.9 38%
M otor Vehicles and Transport 16.0 17.9 19.5 20.2 15.5 18.0 16.9 18.1 15.7 -2%
Average 24.6 24.9 25.9 26.7 26.0 27.8 29.2 30.3 33.5 37%
[image:45.815.49.796.51.515.2]Table 2.2.4; Employment In Irish Firms In 2-Digit Manufacturing Sectors, 1991-1999
1991 1992 1993 1994 1995 1996 1997 1998 1999 1991-1999
Food, Beverages and Tobacco 32064 32768 32628 31540 33109 33710 33971 34383 34933 9%
Printing and Publishing 10292 10782 11660 11460 11219 11140 12095 12841 12729 24%
Basic and Fabricated Metals 9239 9164 8940 9164 9563 10440 10450 10974 11823 28%
Other Non-metallic Minerals 8255 7810 7652 8292 8041 8098 8580 8324 8916 8%
M anufacturing n.e.c. 6746 6620 6742 6581 6923 7256 8252 8976 8745 30%
Machinery and Equipment 5379 5660 5960 6340 6889 7230 8586 7750 7878 46%
Textiles and Clothing 11455 11189 10382 10153 10233 9696 10041 8890 7414 -35%
Rubber and Plastics 3746 3962 3979 4155 4669 5285 5444 5851 6300 68%
W ood and W ood Products 3805 3768 3672 3518 3879 3978 4089 4060 4548 20%
Chemicals 3322 3299 3867 3666 3767 3902 4845 4309 4507 36%
Motor Vehicles and Transport 7350 7189 6235 4866 7300 7048 5785 5824 4438 -40%
Electrical M achinery 2467 2836 2890 3046 3364 3718 4559 4509 4426 79%
Paper and Paper Products 3133 3104 3405 3254 3369 3462 3720 3894 3856 23%
Medical, Precision and Optical 745 818 913 1179 1274 1766 1854 2160 2504 236%
Office Machinery and Computers 1252 1271 1400 1642 2042 1962 2611 3022 2321 85%
Pharmaceuticals 777 791 1156 939 1030 1140 1724 1473 1517 95%
Radio, Television and Communications 759 1142 842 850 1073 1533 1750 1762 1502 98%
Table 2.2.5: Labour Productivity (£000), Firm Numbers And Employment By OECD-Sectoral Classification, 1991-1999. Labour Productivity (£000) and Firm Numbers_________________________ Total Employment
High-tech M edium-high Medium-low Low-tech High-tech Medium-high M edium-low Low-tech
1991 27.4 25.1 23.3 24.8 2788 13907 24759 68555
# Firms 76 614 967 2135
1992 25.0 24.7 24.3 25.1 3204 14446 24432 69300
# Firms 75 620 938 2149
1993 23.3 25.4 26.2 26.0 3398 14459 23731 69579
# Firms 84 621 942 2180
1994 27.4 27.5 28.8 25.7 3431 15396 23382 67497
# Firms 82 631 958 2184
1995 23.9 25.9 26.9 25.8 4145 17109 25812 69648
# Firms 84 633 951 2190
1996 30.0 30.6 27.7 27.0 4635 18228 27341 70020
# Firms 84 641 963 2170
1997 34.3 30.2 29.5 27.7 6085 20782 27130 72635
# Firms 94 668 992 2244
1998 33.3 30.3 29.5 29.6 6257 19903 27795 73574
# Firms 92 657 996 2223
1999 51.8 29.7 32.2 33.6 5340 20625 27950 72925
# Firms 99 678 1068 2250
1991-1999 89% 18% 38% 35% 92% 48% 13% 6%
Note: The description o f OECD classification is outlined in the appendix.
Table 2.3.1; Net Output, Employment, Labour Productivity and Number of ____________ Foreign Firms in Irish Manufacturing, 1991-1999___________
Total Net Output Total Labour Number
(£000s) Employment Productivity o f Firms
1991 6,236,887 86,869 71,796 744
1992 6,805,503 87,572 77,713 719
1993 7,374,379 88,836 83,011 687
1994 8,641,788 95,715 90,287 725
1995 10,811,180 103,864 104,090 724
1996 12,047,608 106,410 113,219 728
1997 14,863,904 113,822 130,589 729
1998 19,448,625 115,243 168,762 724
1999 24,946,624 122,131 204,261 688
1991-1999 300% 41% 185% -8%
Table 2.3.2: Labour Productivity (£000) O f Foreign Firms By Different Size ___________ Groups And Associated Firm Numbers, 1991-1999___________
Less than 50 50-99 100-249 250-499 Over 500
1991 49.9 78.5 61,3 90.5 66.3
# Firms 345 129 168 74 20
1992 60.0 71.0 71.2 106.2 58.7
# Firms 321 133 162 73 25
1993 69.8 63.8 77.3 129.6 56.1
# Firms 288 132 166 64 31
1994 69.0 72.2 78.1 148.5 63.3
# Firms 304 138 179 68 33
1995 74.0 71.5 80.5 185.2 77.9
# Firms 280 156 171 74 39
1996 60.6 68.6 80.0 193.0 99.8
# Firms 279 153 176 80 40
1997 63.1 160.9 86.8 198.8 112.8
# Firms 287 139 177 84 40
1998 91.2 154.6 135.3 273.5 135.1
# Firms 276 143 176 81 44
1999 155.3 105.8 104.0 399.9 159.2
# Firms 250 129 176 87 44
[image:48.529.34.519.47.687.2]Table 2.3.3: Labour Productivity o f Foreign Firms in Irish Manufacturing Industry by 2 Digit-Sector in £000, 1991-1999 1991 1992 1993 1994 1995 1996 1997 1998 1999 1991-1999
Pharmaceuticals 78.0 87.1 96.8 138.7 158.5 144.5 177.2 223.5 275.8 254%
Chemicals 179.7 218.5 243.9 261.4 291.1 325.0 456.5 717.8 833.0 364%
Other Non-M etallic Minerals 32.5 30.3 34.4 41.3 36.9 35.4 37.6 46.0 55.2 70%
Medical, Precision and Optical 50.2 51.6 53.5 53.7 53.9 58.9 59.3 59.3 75.4 50% Food, Beverages and Tobacco 108.0 126.2 134.0 140.3 153.2 161.7 177.2 192.9 213.4 98%
Paper and Paper Products 29.9 34.0 41.4 41.4 52.2 49.8 68.2 67.1 77.8 160%
Printing and Publishing 193.7 190.8 215.4 229.9 221.0 252.7 256.6 339.2 416.1 115% Radio, Television and Communications 45.0 39.6 41.7 40.7 45.8 60.2 85.6 77.7 164.0 265%
M anufacturing n.e.c 41.5 41.5 46.7 49.3 43.0 52.2 51.6 48.5 56.4 36%
Office M achinery and Computers 133.3 126.2 104.4 97.1 151.2 142.2 139.5 167.5 164.7 24%
Electrical M achinery 27.6 30.3 30.2 36.2 44.0 58.1 55.9 47.8 46.0 67%
Rubber and Plastics 28.8 31.1 31.0 34.0 34.2 29.6 32.2 34.1 31.5 10%
Basic and Fabricated 35.6 29.0 38.4 36.6 38.8 36.2 40.5 46.8 45.2 27%
M achinery and Equipment 35.3 35.5 36.2 36.3 42.0 40.3 34.2 39.3 44.0 25%
W ood and Wood Products 38.3 38.8 42.0 43.8 41.7 39.0 36.1 43.5 45.7 19%
Textiles and Clothing 16.7 14.5 18.1 18.1 17.3 18.2 16.8 25.8 31.8 91%
M otor Vehicles and Transport 21.5 18.0 21.0 25.0 29.6 23.8 28.8 34.7 32.9 53%
Average 71.8 77.7 83.0 90.3 104.1 113.2 130.6 168.8 204.3 185%
Table 2.3.4: Employment in Foreign Firms in Irish Manufacturing Industry by 2-Digit Sector, 1991-1999
1991 1992 1993 1994 1995 1996 1997 1998 1999 1991-1999
Chemicals 11346 12022 12413 13793 14391 15560 16157 17123 18462 63%
Office Machinery and Computers 6767 6673 7487 8600 12378 13277 12562 13027 17602 160% Medical, Precision and Optical 8554 8842 9272 9439 10544 11133 12686 13630 14114 65% Food, Beverage and Tobacco 12683 11963 11969 12806 12535 12673 12356 11903 12580 -1% Radio, Television and Communications 4128 4057 5255 6338 6157 6727 11769 11622 11855 187%
Electrical M achinery 7811 7792 7349 7055 9031 8306 9157 10098 10138 30%
Pharmaceuticals 3085 3368 3721 4534 4801 5345 5171 5758 6742 119%
Printing and Publishing 2223 2415 2454 3414 4520 5075 5843 5735 6670 200%
M achinery and Equipment 7001 6969 6552 7238 7331 7104 6460 6602 6616 -5%
Transport Equipment 1590 2453 2529 2811 2291 2453 3638 3462 5146 224%
Rubber and Plastics 4360 4466 4536 4692 4878 5075 4620 4665 4267 -2%
Textiles and Clothing 9573 9421 9196 9552 9046 8280 6794 5680 4215 -56%
Basic and Fabricated Metals 3637 3385 3318 3322 3252 3356 3734 3946 3809 5%
Manufacturing n.e.c. 3755 3848 3830 4212 4488 4255 4390 4238 3130 -17%
Other Non-Metallic 1848 1754 1543 979 1406 1457 1540 1623 1545 -16%
Wood and W ood Products 480 480 446 574 615 617 1086 1032 1094 128%
Paper and Paper products 1113 1032 687 890 1001 1062 1030 857 888 -20%
Table 2.3.5: Labour Productivity (£000), Firm Numbers And Employment By OECD-Sectoral Classification, 1991-1999. 85.2 264 93.6 253 101.0 257 107.9 267 124.6 278 160.0 284 226.1 287 265.2 266 261% 1999 High-tech 13980 14098 16463 19472 23336 25349 29502 30407 36199 194
22% 180% 159%
Total Employment lium-high 32672 M edium-low 10292 Low-tech 29925
33522 10677 29275
33173 10443 28757
34559 9975 31709
38078 10035 32415
38373 10605 32083
40877 1