Abstract — Wireless Sensor Network (WSN) in recent years has gained popularity due to its usefulness in the field of distributed monitoring particularly with the proliferation in Micro-Electro-Mechanical Systems (MEMS). In this paper WSN have been developed for agricultural monitoring and management of the crop field. Wireless nodes developed were capable of transmitting environmental measurements at scheduled intervals. The data from a network of these sensors could be used to vastly improve agriculture management and environmental protection practices through a more accurate modeling of crop-growth, hydrologic flow, and carbon-nutrient cycling processes. The system was designed to monitor temperature, humidity and soil moisture. Various issues regarding WSN like low-cost, low-power, efficiency, compactness, etc. were considered and dealt with.
Index Terms— Bluetooth, UWB, Relative Humidity, Sustainable Agriculture, WSN, ZigBee,
I. INTRODUCTION
Agriculture has been the most important practice from very beginning of the human civilization. It has seen many iterations of development in technology with time. A good agricultural practice is still an art. In last few decades changing weather condition, increase in global temperature and pollution, has led to abnormal environmental conditions like raining. Traditional way of farming is unable to cope with these environmental changes. Good control over environmental parameter can lead to increased yield of crop. Environmental parameters like temperature, humidity and moisture plays important role in growth of the plant. Temperature affects many of plant activities such as pollination, germination etc. It is observed that, at higher temperature, respiration rate increases that result in reduction of sugar contents of fruits and vegetables. At lower temperatures photosynthesis activity is slowed down [1].
Humidity is responsible for moisture loss and temperature
management of the plant. For high humid environment, evapotransmission will be less and more water will saturated in the leaf area. This results in enlargement and formation of fungus in the porous area of the leaf. Moisture is critical for seed germination and uptake of nutrients by the plant. Excess water may stop gaseous exchange between soil and the
Manuscript received August, 2016.
Yogesh G. Gawali, Department of Electronics and Telecommunications, Government College of Engineering, Amravati, Amravati, India, 7588008844.
Dr. D. S. Chaudhari. Department of Electronics and Telecommunications, Government College of Engineering, Amravati.
atmosphere which reduces root respiration and root growth. Optimum level of moisture ensures healthy growth of the root and overall development of the plant [2]. A sustainable approach is required to maintain balance between these parameters and environment. Over last decade, technological advancement such as emergence of WSN, Geographical Information System (GIS) and variable rate control has led to increased interest and adoption in precision agriculture. Precision agriculture means an integrated information and production based environmental system which is been designed for long-term, site-specific increase in the productivity, profitability and efficiency. The advancement in the technologies has enabled the use of state-of-art technology at a reasonably low cost. Wireless sensor network (WSN) can be used in such system to enhance its monitoring capability by distributing sensors all over the field and monitoring environmental parameters remotely. WSN consist of small nodes which work on its own and has a sensors embedded. They collect the data and transmit it over wireless medium to a central system where data from all the nodes is collected and processed.
In this paper WSN based monitoring system for the agriculture was developed for automation. Temperature, humidity and moisture measurements were considered for study. For temperature and humidity integrated sensor was used and for moisture measurement self-developed sensor based on electrical conductivity was developed and calibrated. For wireless communication ZigBee protocol was used for collection of field data at center node and for user interface Global System for Mobile communication (GSM) service was used as it is reliable and easy to reach for most of the people. Data gathered was stored locally in memory for analysis purpose in the future. This paper is organized into 4 sections. An introduction in first section is followed by background of the topic. Third section describes system developed. Conclusion and future work is stated in the fifth and sixth section.
II. BACKGROUND
There are variable sensors available in market to measure temperature, humidity and moisture. Moisture measurement was first introduced in 1894 based on simple gravimetric method. Later lots of techniques were developed based on electrical measurement (1897), tensiometer (1936), radioactive measurements (1950) [4][5]. In recent years with advancement in technology led development of modern techniques like relative permittivity based measurement [6][8][9], Time Domain Reflectometry (TDR) [7], canopy temperature measurement [10], and acoustic based
Wireless Sensor Network based Monitoring for
Agricultural System
measurement of the soil moisture[11]. Every method has its own pros and cons, and has particular use in different situation. In this paper electrical conductivity based soil moisture measuring was used as it is very simple to fabricate, low-cost, low-power, and most importantly small in size as desired in WSN.
Likewise many sensors for measurement of both temperature and humidity are available in the market. Instead of going for separate sensor for temperature and humidity, integrated sensor can be used which reduces overall cost, power requirement, and size to be suit for WSN applications. In given development integrated humidity and temperature sensor, DHT11 was employed.
Currently ZigBee, Bluetooth, Ultra-Wide Band (UWB), and Wi-Fi protocols are generally used for WSN because of their suitability [11][12]. Each protocol has appropriate use in different deployment scenarios eg. ZigBee and bluetooth are low power protocols former is high range than later one. UWB and Wi-Fi are higher power protocols with medium range. Out of these ZigBee is more suitable for agricultural based system being low power and long range. It can form self-organizing network in star, mesh and cluster formation. It was used in given development because of its suitability.
III. SYSTEM CONFIGURATION
Figure 1: System Block Diagram
Figure 1 shows block diagram of Micro Drip Irrigation System for citrus (orange) plant implemented. The field is distributed over 18 x 66 sq m. It contains 44 plants in (11 x 4). Monitoring is done using sensor node which will measure environmental parameters in real time. System input parameters are soil moisture, temperature and humidity. Data are collected at center node and used for deciding control action based on settings feed earlier. The settings can be altered anytime later. Collected data is stored in memory card with time label for data logging and for scheduled timing current state of the farm will be notified to the user via GSM service. At user end android application is to be developed which will provide interface between the system and the user for further information and processing.
A. Sensor Node
Figure 2 shows block diagram of the sensor node. It consists of low power microcontroller MSP430G2553 from Texas instruments. It supports multiple low power modes. It is designed to transmit data once every 30 minutes; it spends most of the time in power down mode number 3. Software based Real Time Clock was implemented which
synchronizes with the center node time after startup.
Figure 2: Block Diagram of Sensor Node
Then this time is updated after every second. Soil moisture sensor was self-designed based on the principle of electrical conductivity. For temperature and humidity measurement DHT11 humidity and moisture sensor was used. Measured data was sent to the center node via XBee Pro S2 transceiver. XBee transceivers were connected in star formation where each sensor node sends data directly to the center node. Solar panels were used to provide power when primary supply of the grid fails. Though the power consumption of XBee radio is more, it is used for very short duration of time in a hour of duration hence total power consumption is very less.
B. Centre Node
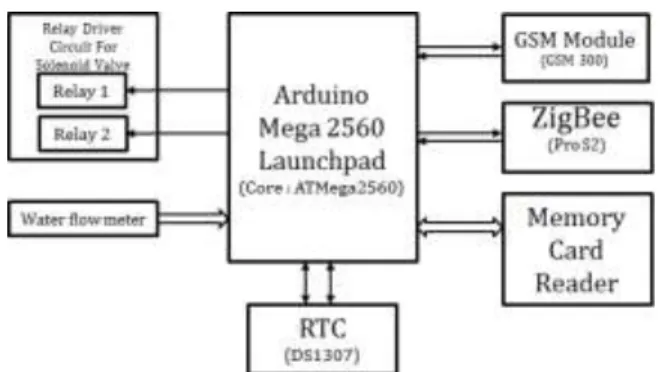
Center node block diagram is shown in Figure 3. Arduino Mega 2560 launchpad is used at center node. It has to perform lot many operation.
Figure 3: Block Diagram of Center Node
DS1307 RTC was used to keep the track of time. It has its own power supply with 2.2 volt button cell and crystal of frequency 32.687 kHz. It has dedicated register for time features which are updated every after every seconds. It is connected to the microcontroller via two wire interface. Thirty minute slot is defined when controller is powered up. Each node is allowed to send data once in this time slot if node tries to send data for more than one time connection is automatically rejected. Based on data received control action is taken to operate solenoid valve for watering of the particular row. When water is supplied to any of the row, total water amount consumed is measured with water flow meter, like this water consumed in all field can be calculated. At the end of each time slot all gathered data is written into
the SD card. This information can be used in future for analysis purpose.
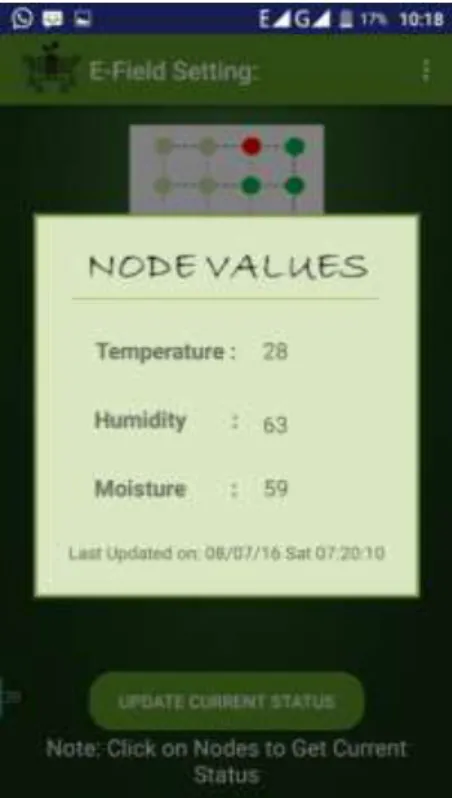
To provide user interface smartphone application was developed at the users end. It was based on android platform. Nowadays most of the mobile user prefer android based smartphones and feature phones because of simplicity and friendly graphical user interface. It was one of the reasons for selecting android platform since most of the users have smartphones.
Figure 4: Pop up widow showing field values Android is a software bunch, comprising not only operating system but also middleware and key applications. Android's source code is released by Google under open source licenses, although most Android devices ultimately ship with both open source and proprietary software, including required proprietary components for Google's services. It was based on short message service provided by GSM. When user wants to know field condition, request query is sent to the system to which system responds with current field condition. The received data is shown in graphical view as shown in Figure 4. It power very friendly interface for the user. User can change system number (phone number of the system), user number (which user is currently using), and change moisture threshold level which is used to operated solenoid valve.
IV. MEASUREMENT APPROACH
In this project soil moisture sensor was designed using PCB board. The advantage of using PCB is that sensor can be designed in any type of form. Moreover it is cheap if designed in large scale. It works on the principal of electrical conductivity in soil due to presence of moisture. Moisture sensor was calibrated using following method. A sample of 100 grams of soil was taken from the field and put in the bowl.
After soil sensor was inserted in it. Water was then added with increase of 20 ml in each after 15 minutes of duration time to let water settle, uniformly in soil sample. The results were tabulated as shown given in Table 1.
Figure 5: Moisture Sensor Designed
Table 1: Measured voltage across sensor with increasing soil moisture content 20 0C
It is shown graphically in the figure 6.
Figure 6: Measured Voltage across Sensor with Moisture variation
To observe the soil moisture sensor behavior at different temperatures it was tested at 20, 27, 35 and 45 0C.
Figure 7: Measured Voltage across Sensor with Moisture variation
It was observed that as temperature increases sensor output also increases slightly. It is shown in Figure 7.
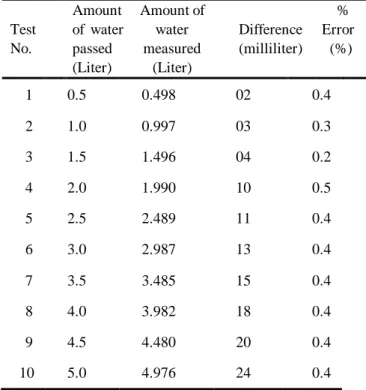
Table 2: Readings for Calibration of Water Flow Meter
Apart from these sensors, water flow meter was also used for calculating amount of water consumed in total field. It was calibrated and results are given in Table 2. The graphical analysis is given in figure 8.
Figure 8: Comparison of Actual Water Passed with Measured Amount of Water
V. CONCLUSIONS
Wireless Sensor Network for monitoring of environmental parameters was developed, implemented and tested in the field. The system was capable of measuring environmental parameters and sends this data to centre node periodically. A real time monitoring system is developed to provide clearer and more accurate condition of the field. User interface was designed at the user end which provided simple interactive interface to the system. User was able to set moisture threshold condition from anywhere just by sending message using application installed in user mobile phone. The system is capable of taking required action based on received data to operate solenoid valve. Moreover the data gathered were stored in the memory card with time stamp provided by RTC. From the experiments and observations, the following conclusion can be drawn:
1) The proposed system will provide a real time monitoring application based system for agricultural management.
2)This system will combine the low power, low cost ZIGBEE and Arduino advantages with modern age small size sensors.
3) The developed system provides many advantages over traditional orthodox method of farming.
VI. FUTURE WORK
The wireless system developed has potential usefulness for farmer. System was capable of monitoring environmental parameters in real time and provides data to the user. By this way farmer can be notified of the disease favorable condition well in advance so he can take some corrective measures. System is efficient but still few addition can be done to increase its performance.
1. For communication with user, General Packet Radio Service (GPRS) module can be used which is capable of transmitting data using internet.
2. Center node requires optimization in terms of power. Presently it depends on primary source of power but in future solar panel (at center node) can be employed to attain full power independency.
3. In future more sensors like pH, salinity, gas, radiation, wind sensor, etc. can be added to increase its performance.
ACKNOWLEDGMENT
This is a part of research and development work supported by Information Technology Research Academy (ITRA), Media Lab Asia, Department of Electronics and Information Technology (DEITy), Ministry of Communications and Information Technology, Government of India.
Test No. Amount of water passed (Liter) Amount of water measured (Liter) Difference (milliliter) % Error (%) 1 0.5 0.498 02 0.4 2 1.0 0.997 03 0.3 3 1.5 1.496 04 0.2 4 2.0 1.990 10 0.5 5 2.5 2.489 11 0.4 6 3.0 2.987 13 0.4 7 3.5 3.485 15 0.4 8 4.0 3.982 18 0.4 9 4.5 4.480 20 0.4 10 5.0 4.976 24 0.4
REFERENCES
[1] D. Stipanicev and J. Marasovic, “Netwrok Embedded Greenhouse Monitoring and Control”, Proceedings of 2003 IEEE Conference on Control Applications, June 23, pp. 91 – 92.
[2] Plant Growth Factors, Colorado State University, and Available (as
on 14-09-2015) at:
http://www.ext.colostate.edu/mg/Gardennotes/143.html#heat. [3] T. Chi, M. Chen and Q. Gao, “Implementation and Study of a
Greenhouse Environment Surveillance System based on Wireless Sensor Network,” The International Conference on Embedded Software and Systems Symposia, pp. 287 – 291, April 2008. [4] A. I. Johnson, “Methods of Measuring Soil Moisture in The Field”, U.
S. Geological Survey, 1992 (Third Reprint).
[5] M. Morris, NCAT Energy Specialist, “Soil Moisture Monitoring: Low-Cost Tools and Methods”, ATTRA, 2006.
[6] S. Kim, “An RFID-enabled Inkjet-printed Soil Moisture Sensor on Paper for Smart Agricultural Application”, IEEE Sensors Proceedings, pp. 1507 – 1510, Nov. 2014.
[7] E. Piuzzi, A. Cataldo, G. Cannazza, and E. De Benedetto, “An Improved Refloctometric Method for Soil Moisture Measurement Exploiting an Innovative Triple-Short Calibration”, IEEE Transactions on Instrumentation and Measurement, Vol. 59, No. 10, pp. 2747 – 2754, Oct. 2010.
[8] S. Daskalakis, S. Assimonis, Kampianakis and A. Bletsas, “Soil Moisture Wireless Sensing with Analog Scatter Radio, Low Power, Ultra-Low Cost and Extended Communication Range”, IEEE Sensors Proceedings, pp. 122 – 125, Nov. 2014.
[9] J. Mizuguchi, J. Piai, J. França, M. França, K. Yamashita, and L. Mathias, “Fringing Field Capacitive Sensor for Measuring Soil Water Contents: Design, Manufacture and Testing”, IEEE Transactions on Instrumentation and Measurement, Vol. 64, No. 1, pp. 212 – 220, Jan. 2015.
[10] X. Wang, W. Yang, A. Wheaton, N. Cooley, and B. Moran, “Efficient Registration of Optical and IR Images for Automatic Plant Water Stress Assessment,” Comput. Electron. Agricult., vol. 74, no. 2, pp. 230 – 237, Nov. 2010.
[11] J. Yick, B. Mukherjee, and D. Ghosal, “Wireless sensor network survey,” Comput. Netw., vol. 52, no. 12, pp. 2292 – 2330, Aug. 2008.
[12] J. S. Lee, Y. W. Su, and C. C. Shen, “A comparative study of wireless protocols: Bluetooth, UWB, ZigBee, and Wi-Fi,” in Proc. IEEE 33rd Annu. Conf. IECON, pp. 46 –51, Nov. 2007.
[13] Joaquín Gutiérrez, Juan Francisco Villa-Medina, Alejandra Nieto-Garibay, and Miguel Ángel Porta-Gándara, “Automated Irrigation System Using a Wireless Sensor Network and GPRS Module”, IEEE transactions on instrumentation and measurement, Vol. 16, Issue 1, pp. 166 – 176, Aug. 2013.
[14] V. Divya, A. Akhouri, C. Kumar, R. Rishabh, R. Bagla, “A Real time implementation of a GSM based Automated Irrigation Control System using Drip Irrigation Methodology”, International Journal of Scientific and Engineering Research, Vol. 4, Issue 5, pp. 146 – 151, May 2013.
[15] D. Wavhal and M. Giri, “Intelligent Drip Irrigation System”, International Journal of Engineering Sciences and Research Technology, May 2014.
[16] P. Bhosale and V. Dixit, “Water Saving-Irrigation Automatic Agricultural Controller”, International Journal of Scientific and Technology Research, Vol. 1, Issue 11, Dec. 2012.
[17] O. Mirabella and M. Brischetto, “A hybrid wired/wireless networking infrastructure for greenhouse management,” IEEE Transactions on Instrumentation and Measurement, Vol. 60, Issue 2, pp. 398 – 407, Feb. 2011.
[18] S. Mathurkar and D. Chaudhari, “A Review on Smart Sensors Based Monitoring System for Agriculture”, International Journal of Innovative technology and Exploring Engineering, Vol. 2, Issue 4, pp. 76 – 78, March 2013.
Yogesh G. Gawali received the B. Tech. degree in Electronics and Telecommunication from Sanjivani College of Engineering, Kopargaon, Ahmednagar in 2013 and currently pursuing the M. Tech. degree in Electronic System and Communication from Government College of Engineering, Amravati.
Dr. Devendra S. Chaudhari obtained BE, ME, from Marathwada University, Aurangabad and PhD from Indian Institute of Technology, Bombay, Mumbai. He has been engaged in teaching, research for period of about 25 years and worked on DST-SERC sponsored Fast Track Project for Young Scientists. He has worked as Head Electronics and Telecommunication, Instrumentation, Electrical, Research and incharge Principal at Government Engineering Colleges. Presently he is working as Head, Department of Electronics and Telecommunication Engineering at Government College of Engineering, Amravati. Dr. Chaudhari published research papers and presented papers in international conferences abroad at Seattle, USA and Austria, Europe. He worked as Chairman / Expert Member on different committees of All India Council for Technical Education, Directorate of Technical Education for Approval, Graduation, Inspection, Variation of Intake of diploma and degree Engineering Institutions. As a university recognized PhD research supervisor in Electronics and Computer Science Engineering he has been supervising research work since 2001. One research scholar received PhD