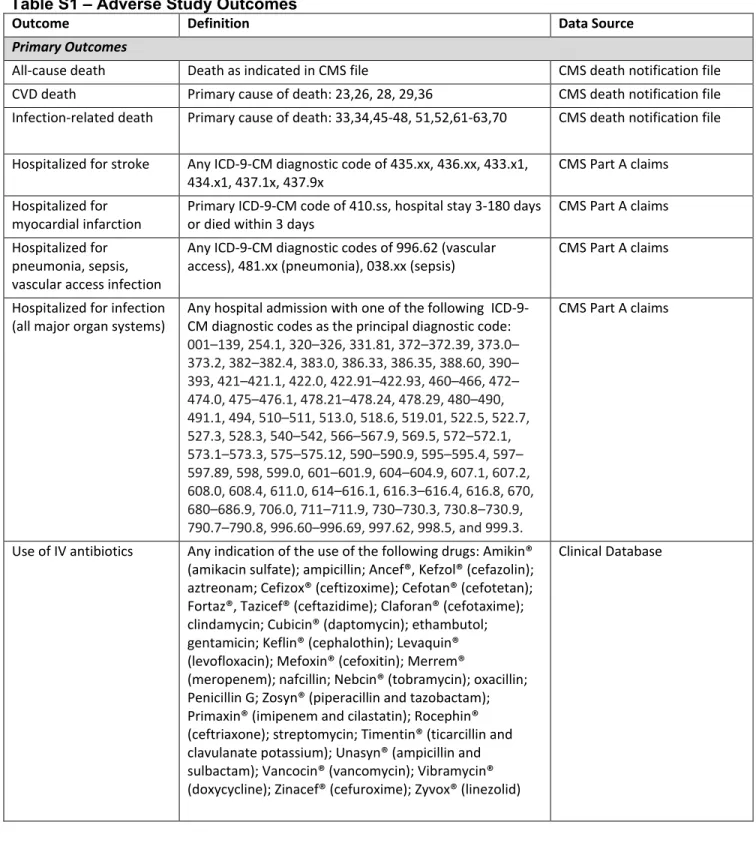
Table S1 – Adverse Study Outcomes
Outcome Definition Data Source
Primary Outcomes
All-cause death Death as indicated in CMS file CMS death notification file CVD death Primary cause of death: 23,26, 28, 29,36 CMS death notification file Infection-related death Primary cause of death: 33,34,45-48, 51,52,61-63,70 CMS death notification file Hospitalized for stroke Any ICD-9-CM diagnostic code of 435.xx, 436.xx, 433.x1,
434.x1, 437.1x, 437.9x
CMS Part A claims Hospitalized for
myocardial infarction
Primary ICD-9-CM code of 410.ss, hospital stay 3-180 days or died within 3 days
CMS Part A claims Hospitalized for
pneumonia, sepsis, vascular access infection
Any ICD-9-CM diagnostic codes of 996.62 (vascular access), 481.xx (pneumonia), 038.xx (sepsis)
CMS Part A claims
Hospitalized for infection (all major organ systems)
Any hospital admission with one of the following ICD-9-CM diagnostic codes as the principal diagnostic code: 001–139, 254.1, 320–326, 331.81, 372–372.39, 373.0– 373.2, 382–382.4, 383.0, 386.33, 386.35, 388.60, 390– 393, 421–421.1, 422.0, 422.91–422.93, 460–466, 472– 474.0, 475–476.1, 478.21–478.24, 478.29, 480–490, 491.1, 494, 510–511, 513.0, 518.6, 519.01, 522.5, 522.7, 527.3, 528.3, 540–542, 566–567.9, 569.5, 572–572.1, 573.1–573.3, 575–575.12, 590–590.9, 595–595.4, 597– 597.89, 598, 599.0, 601–601.9, 604–604.9, 607.1, 607.2, 608.0, 608.4, 611.0, 614–616.1, 616.3–616.4, 616.8, 670, 680–686.9, 706.0, 711–711.9, 730–730.3, 730.8–730.9, 790.7–790.8, 996.60–996.69, 997.62, 998.5, and 999.3. CMS Part A claims
Use of IV antibiotics Any indication of the use of the following drugs: Amikin® (amikacin sulfate); ampicillin; Ancef®, Kefzol® (cefazolin); aztreonam; Cefizox® (ceftizoxime); Cefotan® (cefotetan); Fortaz®, Tazicef® (ceftazidime); Claforan® (cefotaxime); clindamycin; Cubicin® (daptomycin); ethambutol; gentamicin; Keflin® (cephalothin); Levaquin® (levofloxacin); Mefoxin® (cefoxitin); Merrem®
(meropenem); nafcillin; Nebcin® (tobramycin); oxacillin; Penicillin G; Zosyn® (piperacillin and tazobactam); Primaxin® (imipenem and cilastatin); Rocephin® (ceftriaxone); streptomycin; Timentin® (ticarcillin and clavulanate potassium); Unasyn® (ampicillin and sulbactam); Vancocin® (vancomycin); Vibramycin® (doxycycline); Zinacef® (cefuroxime); Zyvox® (linezolid)
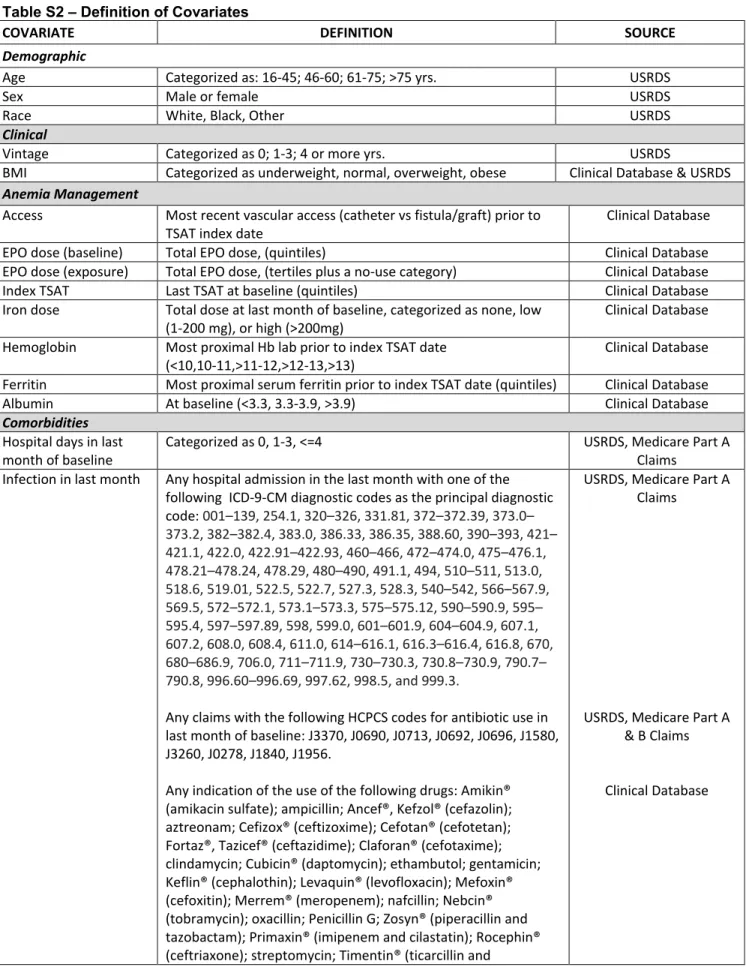
Table S2 – Definition of Covariates
COVARIATE DEFINITION SOURCE
Demographic
Age Categorized as: 16-45; 46-60; 61-75; >75 yrs. USRDS
Sex Male or female USRDS
Race White, Black, Other USRDS
Clinical
Vintage Categorized as 0; 1-3; 4 or more yrs. USRDS
BMI Categorized as underweight, normal, overweight, obese Clinical Database & USRDS Anemia Management
Access Most recent vascular access (catheter vs fistula/graft) prior to TSAT index date
Clinical Database EPO dose (baseline) Total EPO dose, (quintiles) Clinical Database EPO dose (exposure) Total EPO dose, (tertiles plus a no-use category) Clinical Database Index TSAT Last TSAT at baseline (quintiles) Clinical Database Iron dose Total dose at last month of baseline, categorized as none, low
(1-200 mg), or high (>200mg)
Clinical Database Hemoglobin Most proximal Hb lab prior to index TSAT date
(<10,10-11,>11-12,>12-13,>13)
Clinical Database Ferritin Most proximal serum ferritin prior to index TSAT date (quintiles) Clinical Database Albumin At baseline (<3.3, 3.3-3.9, >3.9) Clinical Database Comorbidities
Hospital days in last month of baseline
Categorized as 0, 1-3, <=4 USRDS, Medicare Part A Claims
Infection in last month Any hospital admission in the last month with one of the following ICD-9-CM diagnostic codes as the principal diagnostic code: 001–139, 254.1, 320–326, 331.81, 372–372.39, 373.0– 373.2, 382–382.4, 383.0, 386.33, 386.35, 388.60, 390–393, 421– 421.1, 422.0, 422.91–422.93, 460–466, 472–474.0, 475–476.1, 478.21–478.24, 478.29, 480–490, 491.1, 494, 510–511, 513.0, 518.6, 519.01, 522.5, 522.7, 527.3, 528.3, 540–542, 566–567.9, 569.5, 572–572.1, 573.1–573.3, 575–575.12, 590–590.9, 595– 595.4, 597–597.89, 598, 599.0, 601–601.9, 604–604.9, 607.1, 607.2, 608.0, 608.4, 611.0, 614–616.1, 616.3–616.4, 616.8, 670, 680–686.9, 706.0, 711–711.9, 730–730.3, 730.8–730.9, 790.7– 790.8, 996.60–996.69, 997.62, 998.5, and 999.3.
Any claims with the following HCPCS codes for antibiotic use in last month of baseline: J3370, J0690, J0713, J0692, J0696, J1580, J3260, J0278, J1840, J1956.
Any indication of the use of the following drugs: Amikin® (amikacin sulfate); ampicillin; Ancef®, Kefzol® (cefazolin); aztreonam; Cefizox® (ceftizoxime); Cefotan® (cefotetan); Fortaz®, Tazicef® (ceftazidime); Claforan® (cefotaxime); clindamycin; Cubicin® (daptomycin); ethambutol; gentamicin; Keflin® (cephalothin); Levaquin® (levofloxacin); Mefoxin® (cefoxitin); Merrem® (meropenem); nafcillin; Nebcin® (tobramycin); oxacillin; Penicillin G; Zosyn® (piperacillin and tazobactam); Primaxin® (imipenem and cilastatin); Rocephin® (ceftriaxone); streptomycin; Timentin® (ticarcillin and
USRDS, Medicare Part A Claims
USRDS, Medicare Part A & B Claims
clavulanate potassium); Unasyn® (ampicillin and sulbactam); Vancocin® (vancomycin); Vibramycin® (doxycycline); Zinacef® (cefuroxime); Zyvox® (linezolid)
Pneumonia Any ICD-9-CM diagnostic code of 481.xx – 486.xx in baseline period
USRDS, Medicare Part A & B Claims Vascular Access
Infection
Any ICD-9-CM diagnostic code of 996.62 in baseline period Sepsis Any ICD diagnostic code 038.xx, 995.90, 995.91, 995.92 in
baseline period
Diabetes Any ICD-9-CM diagnostic code of 250.xx in baseline period Ischemic stroke Any ICD-9-CM diagnostic code of 434.01, 434.11, 434.91, 435,
436, 437, 438, V12.54 in baseline period
Myocardial infarction Any ICD-9-CM diagnostic code of 410.xx in baseline period COPD Any ICD-9-CM diagnostic code of 490.xx-496.xx, 505.xx, 506.4 in
baseline period
Cancer Any ICD-9-CM diagnostic code of 173.3, 173.9, 174.0-175.9, 179-195, 196-199, 232.9, 233.0, 233.1, 300.29, 338.3, 789.51, 795.82, 799.4, V67.2, 200, 201, 202.0-202.3, 202.50-203.01,203.8, 238.6, 273.3 in baseline period Gastrointestinal
bleeding
Any ICD-9-CM diagnostic code of 578.xx in baseline period Additional Comorbidities for Sensitivity Analyses
Medicaid Eligibility Indicator for dual eligibility during any part of the baseline USRDS, Enrollment File Year of treatment 2006, 2007, 2008, 2009, 2010 Clinical Database Census Region Based on location of last dialysis center in baseline period:
Northeast, South, Midwest, West
USRDS, Enrollment File ESRD Reason Diabetes, Glomerulonephritis, hypertension, other USRDS, Medical Evidence
Form Pulmonary circulation
disease
Any ICD-9-CM diagnostic code of 415.xx-417.xx in baseline period
USRDS, Medicare Part A & B Claims Peptic Ulcer Disease Any ICD-9-CM diagnostic code of 530.2, 531.xx-534.xx, V12.71 in
baseline period
Liver disease Any ICD-9-CM diagnostic code of 070.32, 070.33, 070.54, 456.0, 456.1, 456.20, 456.21, 571.0, 571.2, 571.3, 571.4, 571.5, 571.6, 571.8, 571.9, 572.3, 572.8, V42.7 in baseline period
Other neurological problem
Any ICD-9-CM diagnostic code 331.9, 332.0, 333.4, 333.5, 334-335, 340, 341, 345.0, 345.1, 345.4, 345.5, 345.8, 345.9, 348.1, 348.3, 780.3, 784.3 in baseline period
Substance abuse Any ICD-9-CM diagnostic code 303.xx-305.xx in baseline period Ischemic Heart disease,
other heart disease, peripheral vascular disease, history of CABG, Stent, PTCA
Any ICD-9-CM diagnostic code of 411.xx-414.xx, 420.xx-429.xx, 785.o, V45.0, v53.3, 402.11, 402.91, 404.11, 404.12, 404.91, 404.93, 093.2, 746.3-746.6, v42.2, v43.3, v43.4441.xx-443.xx, 447.1, 557.1, 557.9, 444.xx-445.xx; Procedure codes (both ICD-9-CM and CPT) of 00.66, 92982, 92985, 36.06, 36.07, 92980, 33510-33514, 33516-33519 in baseline period
Hypertension Any ICD-9-CM diagnostic code of 401.xx-405.xx, except 402.11, 402.91, 404.11, 404.13, 404.91, 404.93 in baseline period Rheumatic heart
disease
Any ICD-9-CM diagnostic code of 393.xx -398.xx in baseline period
Psychiatric problems Any ICD-9-CM diagnostic code 295.xx-298.xx in baseline period Autoimmune disorders Any ICD-9-CM diagnostic code of 564.1, 696.0, 696.1, 695.4,
710.0, 701.0, 710, 714, 720, 725 in baseline period Blood loss anemia Any ICD-9-CM diagnostic code of 280.0 in baseline period Transfusion Indicator for receipt of one or more transfusions during the
baseline period, based on HCPCS codes P9010, P9011, P9016, P9021, P9022, P9038, P9039, P9040, 36430 and ICD-9 codes 99.03, 99.04
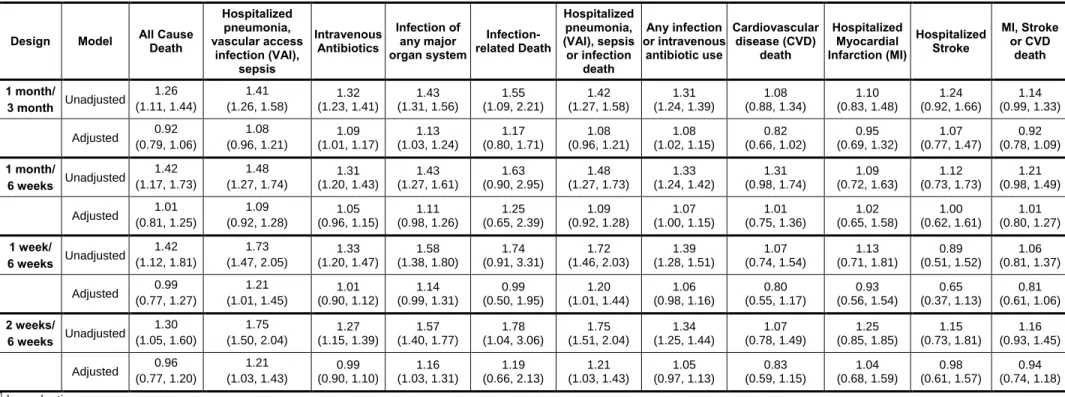
Table S3 – Unadjusted and Multivariable Adjusted Associations1 Between Bolus versus Maintenance Dosing and Adverse Outcomes for Various Study Designs Design Model All Cause Death
Hospitalized pneumonia, vascular access infection (VAI), sepsis Intravenous Antibiotics Infection of any major organ system Infection- related Death Hospitalized pneumonia, (VAI), sepsis or infection death Any infection or intravenous antibiotic use Cardiovascular disease (CVD) death Hospitalized Myocardial Infarction (MI) Hospitalized Stroke MI, Stroke or CVD death 1 month/ 3 month Unadjusted 1.26 (1.11, 1.44) 1.41 (1.26, 1.58) 1.32 (1.23, 1.41) 1.43 (1.31, 1.56) 1.55 (1.09, 2.21) 1.42 (1.27, 1.58) 1.31 (1.24, 1.39) 1.08 (0.88, 1.34) 1.10 (0.83, 1.48) 1.24 (0.92, 1.66) 1.14 (0.99, 1.33) Adjusted 0.92 (0.79, 1.06) 1.08 (0.96, 1.21) 1.09 (1.01, 1.17) 1.13 (1.03, 1.24) 1.17 (0.80, 1.71) 1.08 (0.96, 1.21) 1.08 (1.02, 1.15) 0.82 (0.66, 1.02) 0.95 (0.69, 1.32) 1.07 (0.77, 1.47) 0.92 (0.78, 1.09) 1 month/ 6 weeks Unadjusted 1.42 (1.17, 1.73) 1.48 (1.27, 1.74) 1.31 (1.20, 1.43) 1.43 (1.27, 1.61) 1.63 (0.90, 2.95) 1.48 (1.27, 1.73) 1.33 (1.24, 1.42) 1.31 (0.98, 1.74) 1.09 (0.72, 1.63) 1.12 (0.73, 1.73) 1.21 (0.98, 1.49) Adjusted 1.01 (0.81, 1.25) 1.09 (0.92, 1.28) 1.05 (0.96, 1.15) 1.11 (0.98, 1.26) 1.25 (0.65, 2.39) 1.09 (0.92, 1.28) 1.07 (1.00, 1.15) 1.01 (0.75, 1.36) 1.02 (0.65, 1.58) 1.00 (0.62, 1.61) 1.01 (0.80, 1.27) 1 week/ 6 weeks Unadjusted 1.42 (1.12, 1.81) 1.73 (1.47, 2.05) 1.33 (1.20, 1.47) 1.58 (1.38, 1.80) 1.74 (0.91, 3.31) 1.72 (1.46, 2.03) 1.39 (1.28, 1.51) 1.07 (0.74, 1.54) 1.13 (0.71, 1.81) 0.89 (0.51, 1.52) 1.06 (0.81, 1.37) Adjusted 0.99 (0.77, 1.27) 1.21 (1.01, 1.45) 1.01 (0.90, 1.12) 1.14 (0.99, 1.31) 0.99 (0.50, 1.95) 1.20 (1.01, 1.44) 1.06 (0.98, 1.16) 0.80 (0.55, 1.17) 0.93 (0.56, 1.54) 0.65 (0.37, 1.13) 0.81 (0.61, 1.06) 2 weeks/ 6 weeks Unadjusted 1.30 (1.05, 1.60) 1.75 (1.50, 2.04) 1.27 (1.15, 1.39) 1.57 (1.40, 1.77) 1.78 (1.04, 3.06) 1.75 (1.51, 2.04) 1.34 (1.25, 1.44) 1.07 (0.78, 1.49) 1.25 (0.85, 1.85) 1.15 (0.73, 1.81) 1.16 (0.93, 1.45) Adjusted 0.96 (0.77, 1.20) 1.21 (1.03, 1.43) 0.99 (0.90, 1.10) 1.16 (1.03, 1.31) 1.19 (0.66, 2.13) 1.21 (1.03, 1.43) 1.05 (0.97, 1.13) 0.83 (0.59, 1.15) 1.04 (0.68, 1.59) 0.98 (0.61, 1.57) 0.94 (0.74, 1.18) 1 hazard ratios
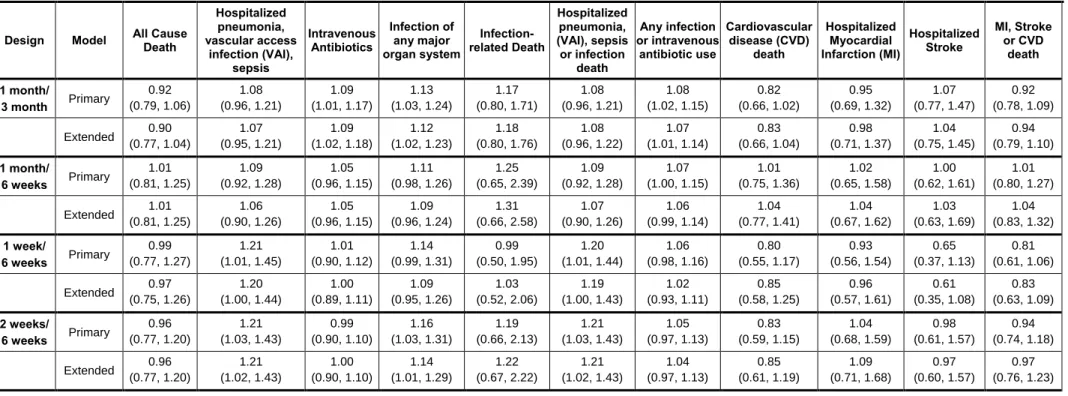
Table S4 – Sensitivity Analyses of Hazard Ratios to the Inclusion of Additional Covariates Design Model All Cause Death
Hospitalized pneumonia, vascular access infection (VAI), sepsis Intravenous Antibiotics Infection of any major organ system Infection- related Death Hospitalized pneumonia, (VAI), sepsis or infection death Any infection or intravenous antibiotic use Cardiovascular disease (CVD) death Hospitalized Myocardial Infarction (MI) Hospitalized Stroke MI, Stroke or CVD death 1 month/ 3 month Primary 0.92 (0.79, 1.06) 1.08 (0.96, 1.21) 1.09 (1.01, 1.17) 1.13 (1.03, 1.24) 1.17 (0.80, 1.71) 1.08 (0.96, 1.21) 1.08 (1.02, 1.15) 0.82 (0.66, 1.02) 0.95 (0.69, 1.32) 1.07 (0.77, 1.47) 0.92 (0.78, 1.09) Extended 0.90 (0.77, 1.04) 1.07 (0.95, 1.21) 1.09 (1.02, 1.18) 1.12 (1.02, 1.23) 1.18 (0.80, 1.76) 1.08 (0.96, 1.22) 1.07 (1.01, 1.14) 0.83 (0.66, 1.04) 0.98 (0.71, 1.37) 1.04 (0.75, 1.45) 0.94 (0.79, 1.10) 1 month/ 6 weeks Primary 1.01 (0.81, 1.25) 1.09 (0.92, 1.28) 1.05 (0.96, 1.15) 1.11 (0.98, 1.26) 1.25 (0.65, 2.39) 1.09 (0.92, 1.28) 1.07 (1.00, 1.15) 1.01 (0.75, 1.36) 1.02 (0.65, 1.58) 1.00 (0.62, 1.61) 1.01 (0.80, 1.27) Extended 1.01 (0.81, 1.25) 1.06 (0.90, 1.26) 1.05 (0.96, 1.15) 1.09 (0.96, 1.24) 1.31 (0.66, 2.58) 1.07 (0.90, 1.26) 1.06 (0.99, 1.14) 1.04 (0.77, 1.41) 1.04 (0.67, 1.62) 1.03 (0.63, 1.69) 1.04 (0.83, 1.32) 1 week/ 6 weeks Primary 0.99 (0.77, 1.27) 1.21 (1.01, 1.45) 1.01 (0.90, 1.12) 1.14 (0.99, 1.31) 0.99 (0.50, 1.95) 1.20 (1.01, 1.44) 1.06 (0.98, 1.16) 0.80 (0.55, 1.17) 0.93 (0.56, 1.54) 0.65 (0.37, 1.13) 0.81 (0.61, 1.06) Extended 0.97 (0.75, 1.26) 1.20 (1.00, 1.44) 1.00 (0.89, 1.11) 1.09 (0.95, 1.26) 1.03 (0.52, 2.06) 1.19 (1.00, 1.43) 1.02 (0.93, 1.11) 0.85 (0.58, 1.25) 0.96 (0.57, 1.61) 0.61 (0.35, 1.08) 0.83 (0.63, 1.09) 2 weeks/ 6 weeks Primary 0.96 (0.77, 1.20) 1.21 (1.03, 1.43) 0.99 (0.90, 1.10) 1.16 (1.03, 1.31) 1.19 (0.66, 2.13) 1.21 (1.03, 1.43) 1.05 (0.97, 1.13) 0.83 (0.59, 1.15) 1.04 (0.68, 1.59) 0.98 (0.61, 1.57) 0.94 (0.74, 1.18) Extended 0.96 (0.77, 1.20) 1.21 (1.02, 1.43) 1.00 (0.90, 1.10) 1.14 (1.01, 1.29) 1.22 (0.67, 2.22) 1.21 (1.02, 1.43) 1.04 (0.97, 1.13) 0.85 (0.61, 1.19) 1.09 (0.71, 1.68) 0.97 (0.60, 1.57) 0.97 (0.76, 1.23)
Table S5 – Characteristics of the Unweighted and Weighted Samples Characteristics mean (SD) or % Maintenance (unweighted) Bolus (unweighted) Maintenance (weighted) Bolus (weighted) Absolute Standardized Difference (weighted) Age, y 61.4 (15.1) 60.1 (15.3 61.1 (15.2) 61.3 (15.1) 0.01 Female 45.1% 45.8% 45.3% 46.7% 0.03
Race: Black race (ref=White) 54.1% 56.7% 54.7% 53.1% 0.03
Other race (ref=White) 5.7% 5.1% 5.6% 5.6% 0.00
Vintage, y 5.1 (5.0) 4.8 (4.7) 5.0 (5.0) 4.8 (4.) 0.04
Body Mass Index 33.9 (29.8) 32.8 (23.5) 34.0 (29.7) 33.0 (24.0) 0.04
Catheter Use 19.5% 21.6% 20.1% 20.9% 0.02 Albumin at baseline 3.9 (0.4) 3.8 (0.4) 3.9 (0.4) 3.9 (0.4) 0.02 Hemoglobin at baseline 12.0 (1.3) 11.5 (1.4) 11.9 (1.3) 11.8 (1.3) 0.01 Index TSAT 31.4 (10.9) 23.7 (9.5) 29.8 (10.9) 29.2 (11.8) 0.05 Ferritin at baseline 745.5 (536.2) 624.6 (478.9) 723.3 (528.5) 723.1 (515.6) 0.00 Iron (mg) at baseline 279.1 (214.3) 313.6 (315.7) 283.4 (233.4) 321.0 (272.7) 0.15
EPO at baseline (1000U) 75.3 (78.3) 110.9 (98.2) 83.5 (84.2) 86.1 (84.9) 0.04
EPO during exposure (1000U) 73.1 (77.0) 113.2 (100.4) 81.9 (84.3) 85.2 (84.4) 0.04
Hospital days in last month 0.6 (1.9) 1.0 (2.3) 0.7 (2.0) 0.7 (2.0) 0.02
Infection in last month 12.6% 17.5% 13.8% 14.2% 0.01
Infection in last 6 mos: Pneumonia 12.8% 16.7% 13.8% 14.3% 0.01
Sepsis 19.0% 23.5% 20.2% 22.0% 0.04 Vascular access 10.1% 15.0% 11.3% 11.7% 0.01 Diabetes 64.1% 67.5% 64.9% 64.9% 0.00 Ischemic stroke 12.9% 16.7% 13.8% 13.9% 0.00 Myocardial Infarction 4.4% 6.2% 4.7% 5.0% 0.01 COPD, Asthma 20.0% 24.4% 21.1% 21.7% 0.01 Cancer 10.9% 12.1% 11.1% 11.0% 0.00 GI bleeding 6.1% 9.5% 6.8% 6.8% 0.00
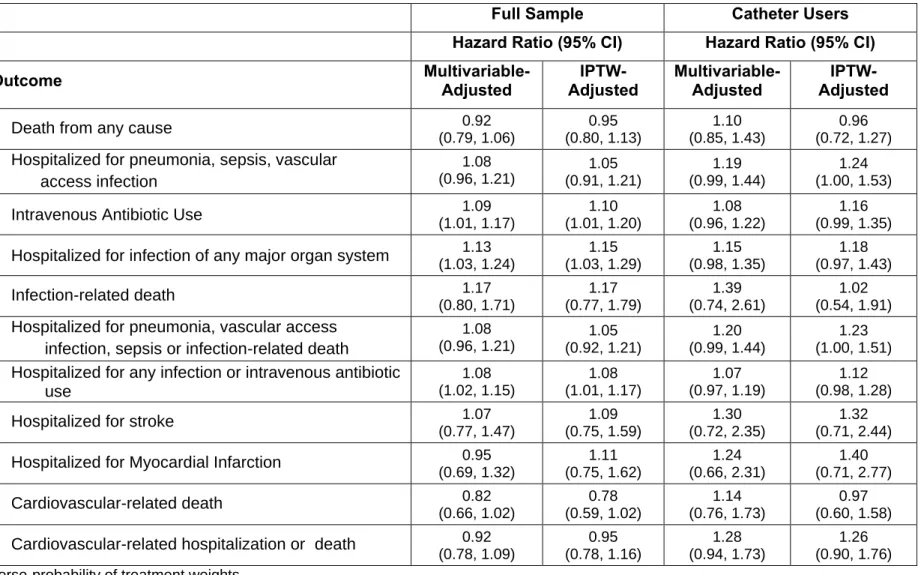
Table S6: Multivariable-Adjusted and IPTW1-Adjusted Associations Between Bolus Versus Maintenance (Referent) Dosing and Study Outcomes (N=48,050)
Full Sample Catheter Users
Hazard Ratio (95% CI) Hazard Ratio (95% CI)
Outcome Multivariable-Adjusted Adjusted IPTW- Multivariable-Adjusted Adjusted
IPTW-Death from any cause 0.92
(0.79, 1.06) 0.95 (0.80, 1.13) 1.10 (0.85, 1.43) 0.96 (0.72, 1.27)
Hospitalized for pneumonia, sepsis, vascular access infection 1.08 (0.96, 1.21) 1.05 (0.91, 1.21) 1.19 (0.99, 1.44) 1.24 (1.00, 1.53)
Intravenous Antibiotic Use 1.09
(1.01, 1.17) 1.10 (1.01, 1.20) 1.08 (0.96, 1.22) 1.16 (0.99, 1.35)
Hospitalized for infection of any major organ system 1.13 (1.03, 1.24) 1.15 (1.03, 1.29) 1.15 (0.98, 1.35) 1.18 (0.97, 1.43) Infection-related death 1.17 (0.80, 1.71) 1.17 (0.77, 1.79) 1.39 (0.74, 2.61) 1.02 (0.54, 1.91)
Hospitalized for pneumonia, vascular access infection, sepsis or infection-related death
1.08 (0.96, 1.21) 1.05 (0.92, 1.21) 1.20 (0.99, 1.44) 1.23 (1.00, 1.51)
Hospitalized for any infection or intravenous antibiotic use 1.08 (1.02, 1.15) 1.08 (1.01, 1.17) 1.07 (0.97, 1.19) 1.12 (0.98, 1.28)
Hospitalized for stroke 1.07
(0.77, 1.47) 1.09 (0.75, 1.59) 1.30 (0.72, 2.35) 1.32 (0.71, 2.44)
Hospitalized for Myocardial Infarction 0.95 (0.69, 1.32) 1.11 (0.75, 1.62) 1.24 (0.66, 2.31) 1.40 (0.71, 2.77) Cardiovascular-related death 0.82 (0.66, 1.02) 0.78 (0.59, 1.02) 1.14 (0.76, 1.73) 0.97 (0.60, 1.58)
Cardiovascular-related hospitalization or death 0.92 (0.78, 1.09) 0.95 (0.78, 1.16) 1.28 (0.94, 1.73) 1.26 (0.90, 1.76) 1