CONVERSION BETWEEN EVAPOTRANSPIRATION REFERENCES AND METHODS James L. Wright, Richard G. Allen and Terry A. Howell]
) 0
3`f
ABSTRACT
Ratios of reference evapotranspiration for alfalfa (ET r) and for grass (ET0) are evaluated using measured ET r and ET,, from lysimeter systems at Kimberly, Idaho and Bushland, Texas. In addition, ratios are evaluated using estimates by the Kimberly Penman and ASCE Penman-Monteith evapotranspiration methods. An ET reference conversion equation from FAO-56 is also compared.The ASCE-PM and Kimberly Penman methods predict differently for both ET, and ET0 so that ratios of ET r / ET° computed from both methods behave differently Ratios of ETr / ET0 from lysimeter measurements averaged 1.15 at both locations.
Key Words: Reference Evapotranspiration, Alfalfa Reference, Grass Reference, ETr, ETo, Kimberly Penman, Penman-Monteith, FAO-56
INTRODUCTION AND BACKGROUND
Evapotranspiration (ET) is commonly predicted for routine engineering, irrigation, and water rights applications using the crop coefficient – reference evapotranspiration approach. Reference evapotranspiration (ETref) h'as traditionally been predicted for either of two types of reference crop: grass (ET0) or alfalfa (ETr). Each of these reference crops has had various "definitions" or descriptions applied. The grass reference has generally been a cool season variety such as fescue or perennial ryegrass clipped to maintain about 0.08 and 0.15 m height (Doorenbos and Pruitt , 1977). The alfalfa (lucerne) reference has been chiefly applied to varieties typically grown in the U.S. and is measured when the stand is 0.3 to 0.6 m in height (Wright, 1982; Jensen et al., 1990). Both references require sufficient plant density and leaf area to represent conditions of full ground cover and ground shading, with water management conditions that facilitate root extraction and transpiration, and with sufficient fetch of similar vegetation for near equilibrium with the boundary layer.
Two widely used equations for daily (24-h) calculations are the Kimberly Penman (Wright, 1982; 1996) as applied to both alfalfa and grass and ASCE Penman-Monteith (or derivative) (Allen et al, 1989; Jensen et al., 1990; Allen et al, 1998) as applied to both alfalfa and grass. These two equations are the focus of this paper.
Generally, the ET predicted for the alfalfa reference is greater than that for the grass reference because the alfalfa reference definition represents vegetation that is taller and has greater leaf area than does clipped grass. Therefore, the alfalfa reference ET definition reflects larger values for both aerodynamic and surface conductance. Albedo and emissivity of alfalfa and clipped grass are usually similar. The ratios of ET , to ET0 vary with weather and climate and may range from 1.05 for humid, calm conditions to 1.2 for semiarid, moderately windy conditions, and to 1.30 for arid, windy conditions.
and Drainage Paper No. 56 implemented this definition within the structure of the Penman-Monteith equation (Allen et al., 1998).
The Technical Committee on Evapotranspiration in Irrigation and Hydrology of the American Society of Civil Engineers (Walter et al., 2000; Allen et al.. 2000) has recommended the adoption of two standardized reference ET equations: ET n representing a tall crop (i.e., alfalfa) and ETos representing a short crop (i.e., grass). The ASCE ET os equation is equivalent to the FAO-56 ET o equation for daily timestep applications.
There is a need to convert between references, especially when crop coefficients (K r) developed for one are to be used with a different reference type. Two approaches for this conversion are evaluated in this paper. These are to:
I) Use a derived "equation" for predicting the relationship between ET r and ETo, for example equation 68 of FAO-56 that varies the ratio as a function of climate .
2) Develop ratios of ET/ET 0 where either the numerator or denominator is calculated using the specific ETref equation that is to be used in making subsequent predictions of a specific crop ET (ET() )and with the other denominator or numerator calculated using the ET ref method that was used in developing the original K r value.
The strength of approach no. 1 is that ratios of ET/ET0 are consistent within variations in climate and calculations of ET r and ETo are not required; its weakness is that the ET r/ETo ratio predicted may not relate to the underlying ETref used to develop the original Kr.
A substantial strength of approach no. 2 is that the conversion ratio ET r/ETo is based on the same ETref that was used in developing the original
lc
value(s) and is based on the ETref equation that is to be used in applying the newly convertedK.
Therefore, there are no systematic biases introduced into the convertedlc
that are purely an artifact of differences between two equations of the same reference type. A weakness of approach no. 2 is that the ET rof used in developing Kr 's in one region or climate may not perform the same in the new region or climate, so that a climatic bias may result. Another weakness is that ratios of ET r/ETo developed for the same location and climatic condition may vary according to the reference equation used in developing the Kr 's to be converted and the reference equation to be applied at the location or region. Therefore, there is potential for inconsistency among ET r/ETo computed for a particular area. FAO-56 equation 68 follows approach no. 1 for converting crop coefficients for reference type:ET,. / ET, =1.2 + 0.58 ( 0.04(u 2 - 2) - 0.004(RHmin - 45) ) (1) where u2 is mean wind speed at 2 m (m s-1) and RH .. is daily minimum relative humidity (%). Generally u2 and RHmin are averages for the particular growth stage. For example, at Kimberly, Idaho, RH., 30% and u2 2.2 m s•1 during the summer months, so that Equation 1 predicts EVET0 = 1.24.
This paper evaluates the above methods for predicting ET r/ETo for purposes of conversion of crop coefficients for reference type. Lysimeter measurements of ET r and ETo are compared for Kimberly, Idaho and Bushland, Texas to complement ratios of ET/ETo predicted from weather data alone.
PROCEDURE
applied as directed in the original publications (Wright, 1982; 1996; Allen et al., 1989, Jensen et al.. 1990). Exceptions were that the 1982 Kimberly Penman equation for ET r was applied using exponentially based wind function coefficients by Wright (1987; Jensen et al., 1990) and the ASCE PM method was applied using net radiation (Re) computed following FAO-56 and with daily soil heat flux (G) set equal to 0.
Daily, paired measurements of ETe and ETr were available for Kimberly, Idaho and Bushland, Texas USDA-ARS locations. Kimberly lysimeter data were analyzed for 63 days from 1991, and Bushland lysimeter data were analyzed for 21 days in 1998 and 29 days in 1999. The Kimberly lysimeter system and grass and alfalfa crops have been described by Wright (1982; 1996). The Bushland grass lysimeter system was described by Schneider et al., (1998) and Howell et al., (1997: 2000 this proceedings). The larger Bushland weighing lysimeters used for the alfalfa have been described by Howell et al. (1995 and 1997). The grass grown at Kimberly on the lysimeters and field was a 'Fawn' tall fescue planted in 1986 and clipped so as to maintain the height at between 0.09 and 0.18 m, averaging 0.12 m for the days analyzed. The alfalfa grown at Kimberly in 1991 was 'WL-316' planted in 1990 and harvested about each 42 days. Height of lysimeter alfalfa for the days analyzed ranged from 0.34 m to 0.76 m, averaging 0.56 m. The lysimeter grass grown at Bushland was 'Emerald III' tall fescue (consisting of equal fractions of 'Jaguar II', 'Mustang', and 'Rebel II') planted in late 1994 and clipped so as to maintain the height at between 0.11 and 0.24 m, averaging 0.145 m for the days analyzed. The alfalfa grown at Bushland in 1998 and 1999 was 'Pioneer 5454' seeded at 28 kg/ha in late 1995 and harvested about each 40 days. Height of lysimeter alfalfa for the days analyzed ranged from 0.45 m to 0.69 m, averaging 0.57m..
RESULTS Comparisons between ET equations and lysimeters
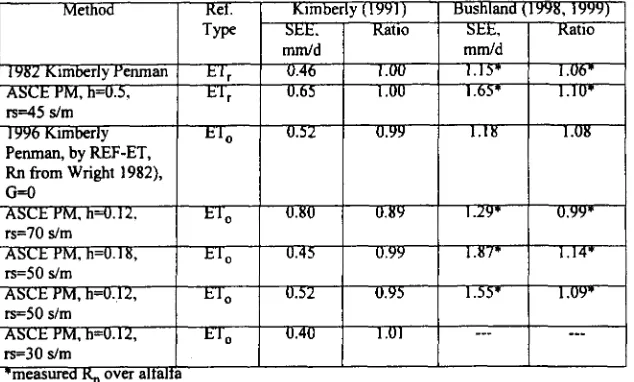
Because the ratio El/h.], is impacted by the performance of the specific ETref method, the Kimberly Penman and Penman-Monteith methods are first compared against lysimeter measurements from the two locations. Results are shown in Table 1 for daily timesteps for Kimberly and for Bushland. Standard errors of estimate (SEE) for unadjusted predictions and ratios of predicted to measured ET are listed.
The 1982 form of the Kimberly Penman equation for ET r performed better than the ASCE PM equation at both Kimberly and at Bushland. The ratio ET ref / ETiy, was 1.0 for both methods at Kimberly. but the Kimberly Penman had a lower SEE. The standardized ASCE PM ETr (height = 0.5 m) performed relatively well at Kimberly with ratio to lysimeter near 1.0. The
standardized ETr method predicted about 10% higher than the lysimeters at Bushland and the 1982 Kimberly ETr predicted about 6% higher than lysimeters at Bushland,(Tablel). The ASCE PM method was applied in the standardized form for ET,. and ET e (Walter et al, 2000) where vegetation height (h) was fixed at h= 0.5 m for alfalfa and h = 0.12 m for grass. The standardized ASCE PM method predicted about 11% lower than measured ET for grass at Kimberly but only about 1% lower than the grassed lysimeter at Bushland (Table 1). The 1996 Kimberly Penman predicted ET° with substantially less error for Kimberly (SEE = 0.52 mm/day vs. 0.80mm/day for the standardized ASCE Penman-Monteith and with slightly less error at Bushland even though the Kimberly Penman overpredicted ETe at Bushland more than did the standardized ASCE P-M equation (Table 1).
The ASCE PM and the 1996 Kimberly Penman equation for ET e predicted about 10% and 20% higher than the grassed lysimeter at Bushland for 1998 data, respectively (not shown in Table 1), and they predicted
dry and windy summer at Bushland (Howell et al.. 2000) while 1999 was a more typical summer with the smaller grass fetch perhaps affecting the Bushland grass ET in 1998 to a greater extent. The lower ET° during 1998 relative to predicted ET, may have been partially caused by some stomata] closure induced by the extreme dryness of the advective environment. These conditions may not have been conducive for representing the hypothetical grass reference. The cooler and less advective conditions of 1999 and reduced impact on stomatal conductance may have Table 1. Unadjusted standard errors of estimate and ratios at Kimberly and Bushland for ET 0 and Err methods vs. lysimeter measurements.
• et o. e .
Type
uzaziski
A
.
, mm/d
mini
alto
1111111111MEMINIUMMIUMINAM
. atm
mm/d
P"-
rir.wmrs ' ... • . . . • io
1111111= I I
I "
111111
.
:t
irn r y Penman, by REF-ET, Rn from Wright 1982),
IIII
III
G=0
rs=70 s/m
MI
0
I : 1 t : '
i . •
• i
• = . ,
rs=50 s/m
ME
1111
i •
MEM
I 'rs=50 s/m
• •
rs=30 s/m
1.' t i ___ ---*measured itti ove a
for the reasons provided earlier. The average prediction for both years combined was 9% higher than the lysimeter with I-, = 50 s m- 1 (Table I ). Because the explanations for the behavior difference in the Bushland grassed lysimeter between 1998 and 1999 are more or less speculative at this time, it is difficult to conclude that one year was a better representation of reference conditions than the other. Therefore it is difficult to make a recommendation for the best value to use for r5 for grass ET, (i.e., r5 = 50 s m- 1 or r5 = 70 s m- 1 ).
It appears that r5 = 45 s m- 1 reproduces alfalfa ETr adequately at both locations with perhaps some overprediction at Bushland. The SEE by the PM equation was greater than for the Kimberly Penman.
Ratios of ET r to ET,
Ratios of daily measured ET r to measured ET° for Kimberly for the three growth periods during 1991 having full cover averaged 1.16, 1.12 and 1.17 and averaged 1.15 for the year. These ratios may appear to be somewhat lower than previously expected for the semiarid climate of Kimberly, based on some literature, and reflect the high ET rates measured from the grassed lysimeter. The standard deviation of measured ET r/ET o over the 130 day period of measurement was 0.17. Ratios of measured ETr to measured ETo for Bushland for conditions of full cover averaged 1.15 for 1999 data. Standard deviations for the 160 day period was 0.12.The daily values for ETr/ETo from measurements at Kimberly compared with ratios of ET r/ET0 computed using the 1982 / 1996 Kimberly Penman and with ratios computed from ETr and ET0 from the ASCE PM equation are shown in Table 2. The day to day variation in EVE; was substantially greater for ETr/ETo based on lysimeter measurements as compared to ratios based on ET equations (Table 2), with the standard deviation for the ratio based on the lysimeter equaling 0.17 for the data period. Averages for ratios for the complete growing season and year are summarized in Table 2 for Kimberly and for Bushland. Also shown in Table 2 are ETr/ET0 ratios as predicted by Eq. 1 (FAO-56 Eq. 68). These latter ratios do not vary substantially from day to day. even as compared to ratios baied on lysimeter measurements. The standard deviation across the lysimeter period was only 0.02 at Kimberly and 0.04 at Bushland for Eq. 1.
The variation in ETr/ET0 from lysimeter measurements for Kimberly compared relatively closely with ratios of ET/ETo based on the Kimberly Penman for the same periods, in regard to magnitude (Table 2) and day to day variation, even though they are for different years. The ratios of ETr/ETo based on the Kimberly Penman exhibit less variation during the middle and late portions of the growing season (June – Sept) than they do during the nongrowing season periods (Nov. – March) and the early part of the growing season.
perhaps the need to apply approach 2 for converting K r 's as well as the need to compute ETAT, ratios by month. The trends exhibited in ET r/ET, ratios are similar between Kimberly and Bushland, although the ratios at Bushland average about 0.1 higher for the ASCE-PM equation. The magnitudes of ratios are similar between sites for the Kimberly Penman equation and are somewhat similar for the ratio of ET r by the Kimberly Penman to ET, by the ASCE-PM. The large ratios of 1.42 and 1.44 for Bushland for ET T/ET0 by the standardized ASCE-PM equation reflect the advective, high wind environment of Bushland. Apparently, the PM equation with aerodynamic roughness and conductance varied to fit the vegetation type is more sensitive to this highly advective condition than is the Kimberly Penman equation.
Ratios of ETr / ET0 were additionally computed for the ASCE-PM method where r s = 50 s/m was used for the ET° estimates. Average ratios and standard deviations are listed in Table 2 for the lysimeter data sets for Kimberly and Bushland. The average ETAT, ratios came closer to those for the Kimberly Penman and for the lysimeter system, but were still somewhat higher. The large day to day scatter in the measured and computed ET A/ET, ratios is of interest, but is probably not useful for carrying into conversion of K c 's . It is probably best to compute ETr/ET( ratios and to make conversions in K c either monthly or for each growth stage.
CONCLUSIONS
The Kimberly Penman equation had more consistent predictive accuracy (smaller SEE) for lysimeter measurements of alfalfa at Kimberly, Idaho and at Bushland, Texas. Prediction by the Kimberly Penman was better at Kimberly and similar to the standardized ASCE-PM equation at Bushland. The Bushland lysimeter installation provides a more unbiased opportunity for equation comparison since no Bushland data were used to develop any of the ET methods. Future work towards development of a standardized form of the Penman-Monteith equation may need to consider reducing the value used for surface resistance from 70sm- i to perhaps 50 s m- i for daily time steps if the intention is to reproduce measurements of ET from clipped fescue at Kimberly and for some periods at Bushland. However, other considerations include maintaining a previously defined hypothetical ET0 reference recommended by FAO to provide for
consistency. This reference definition appears to represent a grassed surface having less stomatal conductance than the clipped fescue grown at Kimberly and in some cases at Bushland. Future measurements of crop ET will help to determine whether grass-based Kr 's summarized in FAO-56 and in other publications are best based on the FAO definition for grass reference or if a "stronger" ET0 reference should be considered.
Table 2. Average ratios of ET,JET r, at Kimberly and Bushland.
Methods Kimberly Bushland
Lysimeter Period, 1991
Growing Season s , 1995-98 Annual, 1995-1998 Lysimeter Period, 1999 Growing Season", 1997-98 Annual. 1997-98 Ave. Ratio Std. Dev. of Ratio Ave. Ratio Std. Dev. of Ratio
L /
Lysimeter
1.15 0.17 1.15 0.12
1982 Kimberly Penman ETr / 1996 Kimberly Penman ET,
1.18 0.05 1.19 1.21 1.16 0.05 1.22 1.26
ASCE PM ETr / ASCE PM ET, (standard)
1.29 0.07 1.32 1.34 1.34 0.0/ 1.42 1.44
ASCE PM ETr / ASCE PM ET, (rs = 50 s/m for ET0)
1.22 0.06 1.23 0.05
1982 Kimberly Penman ETr / ASCE PM ET0
1.29 0.09 1.28 1.25 1.37 0.1 / 1.30 1.26
FAO-56 Eqn. 68
1.24 0.01 1.23 1.12 1.26 0.03 1.27 1.27
"Growing season is cons deredto be April- October for bothsites.
Monthly ETr/ETo - ASCE-PM
la
Kimberly, 1998
• •
$ •
2 4 6 8 10 12
2 4 6 8 10 12 KPen ETrIETo ASCE-PM ETrIETo 82KPen ETrIPM ETo FAO-56 Eqn. 68
—.— —o—
--0
1.701.60
1.50
1.40
1.30
1.20
1.10
1.00 0
0
cc 1.70
1.60
1.50
1.40
1.30
-1.20
1.10
1.00 02
Id
4 6 8 10 12
ETr/ETo - Bushland, 1998-9
O TTs cc
2.00
1.80
1.60
1.40
1.20
1.00
0.80
Lys/Lys 1999 ave • Lys/Lys 1999 ave
LyslLys eve
LyslLyseKin
KPen/KPen
Pktad/PMstd • FAO-56 eqn. lb
•
• • •• •
• •
120 150 180 210 240 270 300
Day of Year
Monthly ETr/ETo - Bushland 1997-98
Month
Monthly ETr/ETo - Kimberly 1995-98
KPen ETrIETo ASCE-PM ETrETo 82KPen ETrIPM ETo FAO-56 Eqn. 68
Month
References
Allen, R.G.. M.E. Jensen, J.L. Wright, and R.D. Burman. 1989. Operational Estimates of Reference Evapotranspiration. Agron. J. 81:650-662.
Allen, R.G.. M. Smith, L.S. Pereira and A. Perrier. 1994. An Update for the Calculation of Reference Evapotranspiration. ICID Bulletin. 43(2):35-92.
Allen. R.G., L.S. Pereira, D. Raes, and M. Smith. 1998. Crop Evapotranspiration: Guidelines for computing crop water requirements. Irrigation and Drainage Paper 56, Food and
Agriculture Organization of the United Nations, Rome, 300 p.
Allen, R.G., I.A.Walter. R.Elliott, B. Mecham. M. Jensen, D. ltenfisu, T. Howell, R. Snyder, P. Brown, S. Echings, T. Spofford, M. Hattendorf, R. Cuenca, J. Wright, D. Martin. 2000. Issues, requirements and challenges in selecting and specifying a standardized et equation. Proceedings of the 4'h Decennial Irrigation Symposium, ASAE, Phoenix, AZ, Nov., 2000.
Doorenbos, J. and W.O. Pruitt, 1975, 1977. Guidelines for predicting crop water Requirements, Irrigation and Drainage Paper 24, (1st and 2nd ed)., Food and Agriculture Organization of the United Nations, Rome, 179 and 156 p.
Howell, T.A. 1998. A Texas Sized Test of the ASCE ET Equation. 1998 ASCE Tipton Award Presentation„ 1998 ASCE International Water Resources Engineering Conference, Memphis, TN, http://www.cprl.ars.usda.gov/wmru/howell/Tipton/index.html.
Howell, T.A., A.D. Schneider, D.A. Dusek. T.H. Marek, and J.L. Steiner. 1995. Calibration and scale performance of Bushland weighing lysimeters, Trans. ASAE 38(4):1019-1024. Howell, T.A., J.L. Steiner, A.D. Schneider, S.R. Even, and J.A. Tolk. 1997. Seasonal and
maximum daily evapotranspiration of irrigated winter wheat, sorghum, and corn – Southern High Plains. Trans. ASAE 40(3):623-634.
Howell, T.A., S.R. Evett, A.D. Schneider, D.A. Dusek and K.S. Copeland. 2000. Irrigated fescue grass ET compared with calculated reference grass ET. Proceedings of the 4' h Decennial Irrigation Symposium, ASAE, Phoenix, AZ, Nov., 2000.
Itenfisu, D., R.L. Elliott, R.G. Allen, and I.A. Walter. 2000. Comparison of reference evapotranspiration calculations across a range of climates. Proceedings of the 4th Decennial Irrigation Symposium, ASAE, Phoenix, AZ, Nov., 2000.
Jensen, M.E., R.D. Burman, and R.G. Allen (ed). 1990. Evapotranspiration and Irrigation Water Requirements. American Society of Civil Engineers, Engr. Pract.,Manual No. 70. 332
Schneider, A.D., T.A. Howell, A.T.A. Moustafa, S.R. Even, and W. Abou-Zied. 1998. A simplified weighing lysimeter for monolithic or repacked soils. Appl. Engr. Agric. 14)3(:267-273.
Smith, M.. R.G. Allen, J.L. Monteith, A. Perrier, L. Pereira, and A. Segeren. 1991. Report of the expert consultation on procedures for revision of FAO guidelines for prediction of crop water requirements. UN-FAO, Rome, Italy, 54. p.
Walter, I.A. et al., 2000. ASCE's Standardized reference evapotranspiration equation. ASCE Standardization of Reference Evapotranspiration Task Committee. Proceedings of the 4 th Decennial Irrigation Symposium, ASAE, Phoenix, AZ, Nov., 2000.
Wright, J.L. 1982. New Evapotranspiration Crop Coefficients. J. of lrrig. and Drain. Div. (ASCE), 108:57-74.
Wright, J.L. 1987. Personal communication to ASCE Committee of Irrigation Water Requirements.
Wright, J.L. 1996. Derivation of Alfalfa and Grass Reference Evapotranspiration. in. Evapotranspiration and Irrigation Scheduling, C.R. Camp, E.J. Sadler, and R.E. Yoder (ed.). Proc. Int. Conf., ASAE, San Antonio, TX. p. 133-140.
•
iter iiiff•U (1"