Open Access
Comparing voxel-based absorbed dosimetry
methods in tumors, liver, lung, and at the
liver-lung interface for
90
Y microsphere selective
internal radiation therapy
Justin K Mikell
1,2, Armeen Mahvash
3, Wendy Siman
1,2, Firas Mourtada
4and S Cheenu Kappadath
1,2** Correspondence:
[email protected] 1Department of Imaging Physics, The University of Texas MD Anderson Cancer Center, 1155 Pressler St, Unit 1352, Houston, TX 77030, USA
2
The University of Texas Graduate School of Biomedical Sciences at Houston, Houston, TX, USA Full list of author information is available at the end of the article
Abstract
Background:To assess differences between four different voxel-based dosimetry methods (VBDM) for tumor, liver, and lung absorbed doses following90Y microsphere selective internal radiation therapy (SIRT) based on90Y bremsstrahlung SPECT/CT, a secondary objective was to estimate the sensitivity of liver and lung absorbed doses due to differences in organ segmentation near the liver-lung interface.
Methods:Investigated VBDM were Monte Carlo (MC), soft-tissue kernel with density correction (SKD), soft-tissue kernel (SK), and local deposition (LD). Seventeen SIRT cases were analyzed. Mean absorbed doses (AD) were calculated for tumor, non-tumoral liver (NL), and right lung (RL). Simulations with various SPECT spatial resolutions (FHWMs) and multiple lung shunt fractions (LSs) estimated the accuracy of VBDM at the liver-lung interface. Sensitivity of patient RL and NLAD on segmentation near the interface was assessed by excluding portions near the interface. Results: SKD, SK, and LD were within 5 % of MC for tumor and NL AD. LD and SKD overestimated RLAD compared to MC on average by 17 and 20 %, respectively; SK underestimated RLADon average by −60 %. Simulations (20 mm FWHM, 20 % LS) showed that SKD, LD, and MC were within 10 % of the truth deep (>39 mm) in the lung; SK significantly underestimated the absorbed dose deep in the lung by approximately −70 %. All VBDM were within 10 % of truth deep (>12 mm) in the liver. Excluding 1, 2, and 3 cm of RL near the interface changed the resulting RLADby −22, −38, and −48 %, respectively, for all VBDM. An average change of −7 % in the NL AD was realized when excluding 3 cm of NL from the interface.
Conclusions: SKD, SK, and LD are equivalent to MC for tumor and NLAD. SK underestimates RLAD relative to MC whereas LD and SKD overestimate. RL AD is strongly influenced by the liver-lung interface.
Keywords: SIRT; Microspheres; SPECT; Dosimetry; Liver; Lung
Background
Liver-directed selective internal radiation therapy (SIRT) has experienced clinical growth in recent years for the management of both hepatocellular carcinomas and metastatic disease from colorectal cancer, breast cancer, and
endocrine tumors. Methods to calculate the administered activity for SIRT rely on body surface area and the assumption that activity is distributed uniformly throughout the liver, while the absorbed dose to the lung is based on the lung shunt fraction (LS) [1, 2]. A major limitation of these models is that they do not separate tumors from non-tumoral liver (NL) and are more accurately character-ized as “safety planning” methods rather than “treatment planning.” The partition model [3] offers an improvement in that it separates tumors from NL, but it sim-plistically models all tumors as a single entity having a singular uptake fraction and assumes uniform activity distribution throughout the tumor and NL compartments.
Recent progress in post-therapy quantitative 90Y imaging with SPECT/CT and posi-tron emission tomography/CT has facilitated voxel-level absorbed dose calculations. Voxel-based absorbed dose calculations are affected by the 90Y image quality in terms of quantitative accuracy and spatial resolution. Unlike other models, voxel-based absorbed dose calculations do not require tumor burden, tumor segmentation, or tumor uptake fraction as inputs for estimating absorbed dose at each voxel. Organ-at-risk and tumor segmentation are still necessary in voxel-based dosimetry, but segmentation is per-formed to report on the calculated absorbed doses and not to explicitly calculate the absorbed dose. Voxel-based dosimetry methods (VBDM) allow the absorbed dose calcula-tion to be independent of the tumor and organ-at-risk segmentacalcula-tion.
There are several methods to calculate voxel-based absorbed doses for SIRT. How-ever, little has been published in the literature comparing different VBDM, and the comparisons have been confined to the liver [4]. Lung dosimetry is of importance for SIRT because absorbed dose to the lung often limits the deliverable activity. The lung shunt fraction is estimated using 99mTc-macroaggregated albumin (MAA) with planar (or sometimes SPECT) imaging [5, 6]. In some instances, 99mTc-MAA SPECT/CT is performed to assess extra-hepatic uptake and these can in principle be used for therapy planning [7]. 99mTc-MAA SPECT scans have superior image quality compared to post-therapy bremsstrahlung 90Y SPECT scans, but there are studies showing MAA does not reliably predict the distribution of delivered 90Y microspheres [8]. To our knowledge, no previous study has reported the use of VBDM for determining absorbed dose to the lung and explored the implications of different VBDM in the liver-lung interface region [9, 10]. Both the EANM [5] and AAPM [6] provide guidance for clin-ical standard of practice90Y microsphere therapy, but neither document addresses the effect of different VBDM which are under investigation.
In this study, we investigated differences among four VBDM for tumor, liver, and lung absorbed doses based on90Y bremsstrahlung SPECT/CT imaging. Accuracy of the different methods at the liver-lung interface was estimated for different spatial resolu-tions and LS. Patient data was analyzed to determine the sensitivity of NL, right lung (RL), and total liverADto the liver-lung interface.
Methods Patient data
dosimetry models can be achieved by using the same input patient data (administered activity and SPECT/CT images) into all of the VBDM. A total of 17 post-therapy 90Y SPECT/CT were selected for this study using a UT MD Anderson Cancer Center Insti-tutional Review Board-approved retrospective chart review protocol where the in-formed consent requirement was waived. The mean administered activity was 2.81 ± 1.04 GBq (range 1.13–5.21 GBq). The administered activities were based on the package insert for the treatment device: ~120 Gy to treatment volume for glass mi-crospheres. Adjustments were made to the activity based on the lung shunt fraction that was estimated by the 99mTc-MAA scans. Diagnostic CT or magnetic resonance images were manually registered to the SPECT/CT to aid in tumor delineation. A single interventional radiologist segmented the liver and tumors for all patients using the co-registered CT and/or magnetic resonance images. NL was generated by subtracting the tumor contours from the liver contour. RL was segmented using re-gion growing in MIM Maestro v6.2 (MIM Software); RL was then inspected and manually adjusted by a physicist.
The90Y SPECT/CT scans were acquired on a Symbia T16 (Siemens Medical Solutions) with medium-energy low-penetration collimation. SPECT data were acquired with a 90–125 keV primary window and 312–413 keV scatter window for 128 views over 360° with 28 s/view. A three-dimensional (3D) ordered-subset expectation maximization (Flash3D, Siemens Medical Solutions) SPECT reconstruction was performed using 4 iterations and 8 subsets with a 9.6 mm FWHM Gaussian post-filtering. The reconstructed isotropic voxel size was 4.8 mm. The reconstruction modeled geometric collimator response, CT-based at-tenuation correction using effective energy of the energy window width, and an energy window-based scatter correction [11]. The spatial resolution of the reconstruction was estimated to be 20 mm FWHM using an90YCl2line source in cold background.
Activity in each voxel (Aijk) was calculated by converting reconstructed SPECT counts to activity through a self-calibration factor defined as Administered Activity/Total Counts. We have assumed that all administered activities were within the SPECT field of view because most of the lung was included in the SPECT field of view; no correction for LS was applied. The Total Counts =∑CijkwhereCijkrepresents the reconstructed counts in a voxel and the summation is over the entire SPECT volume.
Absorbed dose volume histograms of tumor, NL, and RL were generated for each pa-tient and each VBDM. Correlations ofADfrom local deposition (LD), soft-tissue kernel (SK), and soft-tissue kernel with density correction (SKD) with Monte Carlo (MC) were investigated for tumor, NL, and RL. A qualitative evaluation of differences in the iso-dose distributions was also performed.
Voxel-based dosimetry methods investigated: MC, SKD, SK, and LD
90
Y bremsstrahlung SPECT/CT.ρijkwas determined from the CT using a scanner- and technique-specific linear lookup table based on electron density phantom scans. Mijk was generated by mapping ρijk to one of four materials (air [14], lung [15], soft tissue [16], or bone [15]) based on density ranges.
We assume that90Y microspheres have no biological clearance, so the total number of
disintegrations in a voxel is given by Nijk ¼Aijk⋅ln 2Tð Þ1=2 whereT1/2is the physical half-life of 90
Y (64.1 h). 90Y β− has a maximum energy of 2.28 MeV corresponding to a maximum range of 11 mm in soft tissue[17], but the range increases to 44 mm in the lung with density 0.26 g/cc.
Table 1 summarizes the different VBDM investigated in this work. Absorbed doses calculated using MC are a function of material, total number of disintegrations, density, and the energy spectra of the beta particle emitted. Patient MC simulations were performed using 109histories. LD requires only the average energy of the beta particle and mass of each voxel. For SK and SKD, the absorbed dose soft tissue ker-nel was generated from MC simulations in an infinite soft-tissue medium with dens-ity of 1.04 g/cc using 2 × 10⁹ histories; it was validated by comparing with Lanconelli et al. [18]. The simulation yielded statistical uncertainty ≤0.002 % in the source voxel and ≤2.5 % at 40 mm. The kernel had isotropic voxel size of 4.8 mm matching the reconstructed SPECT. SK and SKD were calculated by convolving the total number of disintegrations with the kernel; convolutions were performed in IDL v8.2 (Exelis Visual Information Solutions). SKD was then scaled by the ratio of kernel density to voxel density [4].
Assessing sensitivity of NL, RL, and total liver mean absorbed to the liver-lung interface
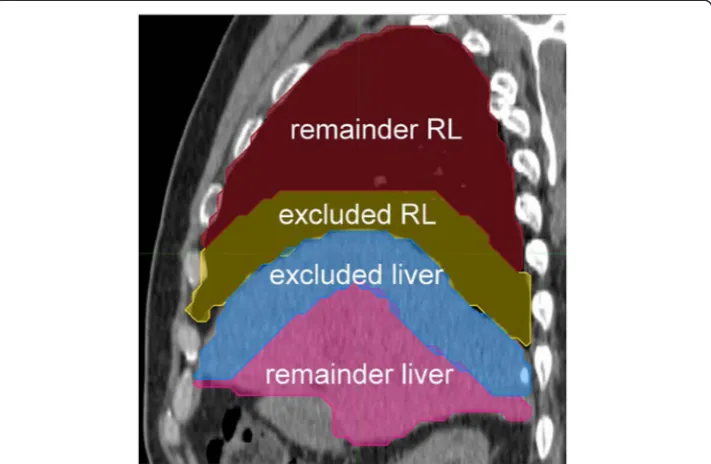
To assess sensitivity of NL, RL, and total liverADto the liver-lung interface in patient data, we generated remainder VOI for total liver, NL, and RL by excluding regions extending 1, 2, or 3 cm from the liver-lung interface into both the liver and lung. The sensitivity ofADon segmentation was analyzed in Excel by plotting theADto the original VOI as a function of theADto the remainder VOIs and fitting a line to the data. Figure 1 shows an example of the remainder VOI generation.
Simulation to estimate the impact of spatial resolution and LS on the accuracy of VBDM
at the liver-lung interface
Simulations were performed to estimate errors in the absorbed dose calculations around the liver-lung interface for the different VBDM as a function of spatial
Table 1Characteristics of the different VBDM investigated
VBDM Functional form Notes
Monte Carlo (MC) F(Mijk,Nijk,ρijk,E90Y) E90Yis the beta energy spectra per disintegration
Local deposition (LD) Nijk⋅ρEavg
ijk⋅ΔV
Eavg(0.937MeV) is the average energy of the beta particle per disintegration.ΔVis the volume of a voxel.
Soft-tissue kernel (SK) Nijk⊗Ki'j'k'
Ki'j'k'is obtained from a MC simulation of infinite uniform soft-tissue material with density of 1.04 g/cc.
Soft-tissue kernel with
density correction (SKD) Nijk⊗Ki0 j0k0
⋅1:04
resolution and LS. We used a slab geometry with multiple spatial resolutions and LS; this simple simulation had two compartments (liver and lung) shown in Fig. 2 and does not use patient data. We placed a uniform amount of activity in the liver compartment representing a true activity distribution. To simulate limited spatial reso-lution, the activity in the liver was convolved with a Gaussian FWHM of 10 or 20 mm caus-ing spill-out of the liver and spill-in to the lung. MC, SK, SKD, and LD voxel-level absorbed
Fig. 1Sagittal view through liver and RL illustrating excluded regions from the liver-lung interface. Remainder RL (red), excluded RL (yellow), excluded liver (blue), and remainder liver (pink)
doses were then calculated on the three activity distributions (0, 10, 20 mm FWHM) and were normalized to the input activity. A similar process was carried out for the lung.
The density of the soft tissue and lung was set to 1.04 [16] and 0.26 g/cc [15], respectively. A newer ICRP report [19] lists the density of the lung as 0.25 g/cc, but we do not expect results to change significantly due to a 0.01 g/cc difference in density. The simulation volume consisted of 61 × 61 × 61 4.8 mm isotropic voxels. These voxels were padded such that the total dimensions were 200 × 200 × 200 cm3 approximating an infinite phantom. One-dimensional (1D) line profiles along the z axis were generated by averaging the central 7 × 7 voxels in each x-y plane.
For the three spatial resolutions, the liver and lung VBDM absorbed doses were combined via superposition by weighting the lung component by LS and the liver by 1-LS. We investigated LS of 1, 10, and 20 %. For quantitative comparison be-tween VBDM, we defined the true absorbed dose distribution as the MC profile of 0 mm FWHM for a given LS; specifically, distance intervals along the 1D pro-file for which the different calculations agreed within ±10 % of the truth are reported.
Results
Comparing SKD, SK, and LD with MC for patients
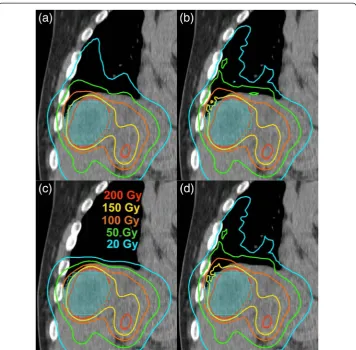
Figure 3 illustrates the salient differences in the apparent absorbed dose distribution stemming from the four VBDM; it shows the different absorbed dose calculations throughout the RL and liver on a coronal CT slice for a patient. The isodose curves deep within the liver were nearly identical for all four methods. The 20 Gy line ex-tended furthest in the lung for SKD and LD followed by MC and then SK (least pene-tration into lung). The LD isodose distribution was very similar to the SKD distribution. There was an unequivocal qualitative difference in the lung absorbed dose distribution when SK was compared with MC, LD, or SKD, owing to the fact that SK assumes soft-tissue density of 1.04 g/cc regardless of the true density and material composition.
The correlations in absorbed dose as estimated using LD, SK, and SKD in relation to the true values from MC are shown in Fig. 4. All the correlations hadR2> 0.975. Slopes of the fit lines ranged from 0.98 to 1.00 for tumors and NL. For RLAD, the slopes were 0.88, 0.90, and 2.32 for SKD, LD, and SK, respectively. The summary of percent differ-ences relative to MC are listed in Table 2.AD to tumors and NL using LD, SK, and SKD were within 5 % of MC . ForADto RL, LD had the best agreement (17 % on aver-age) with MC, whereas SK had the poorest agreement (−60 % on average).
Sensitivity of total liver, NL, and RL mean doses to the liver-lung interface
Fig. 4The correlation of patient absorbed doses from MC with those from LD (green triangles), SK (red squares), and SKD (blue diamonds) for tumorAD(N= 31) (a), NLAD(N= 17) (b), and RLAD(N= 17) (c) shown together with their linear fits. Thegray dashed linerepresents the line of equivalence
Fig. 3A coronal plane through the RL and liver illustrating salient differences between the four different VBDM: MC (a), LD (b), SK (c), SKD (d). The tumor (shaded in cyan) is 5.2 cm in length in the
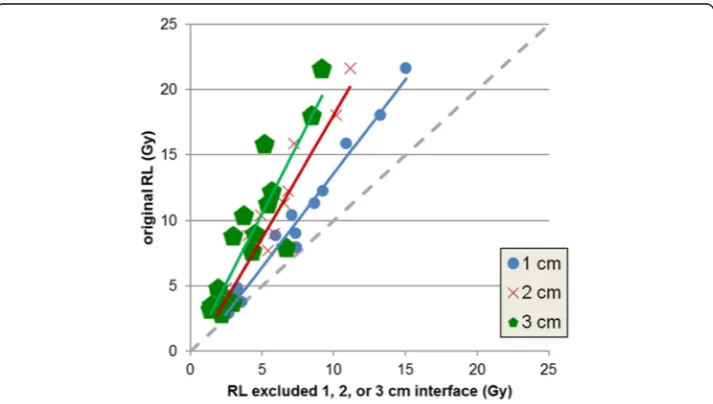
as a strong departure from the line of equivalence (Fig. 5). Excluding up to 3 cm of the liver-lung interface for the total liver and NL resulted in average differences of 4.1 and 6.9 %, respectively, from the originalADto VOIs (without excluded regions), suggesting relative insensitivity to the interface region. On the contrary, excluding up to 3 cm of the interface for the RL led to an average difference of −48.4 % from the originalAD, suggesting that RLADis very sensitive to the interface region.
Effect of spatial resolution and LS on accuracy of the VBDM at the liver-lung interface Figure 6 shows the percent differences of the different absorbed dose calculations rela-tive to the truth (MC of true activity distributions) for different LS and different FWHM. LD is not displayed since the differences are similar to SKD. Errors on the liver side of the interface were generally within 30 % and approached 0 as the blurring decreased to 0 and moved away from the interface deeper into the liver. Near the lung interface, errors for 20 mm FWHM blurring and 1 % LS were within 20 % when using SK compared to errors over 200 % for MC and SKD. Table 3 lists the distance intervals where agreement with MC was within 10 %; on the liver side, agreement to within 10 % for all methods was found beyond 4, 6, and 12 mm from the interface for 0, 10,
Table 2Percent differences inADwhen using SKD, SK, and LD compared with MC
SKD vs. MC SK vs. MC LD vs. MC
TumorAD −0.2 % ± 0.3 %, 1.6 % ± 1.2 %, 0.9 % ± 1.2 %,
[−1.7 %, 0.0 %] [−2.6 %, 3.1 %] [−0.4 %, 4.7 %]
NLAD −0.3 % ± 0.1 %, 1.5 % ± 0.7 %, −0.1 % ± 0.5 %,
[−0.5 %,−0.1 %] [−0.6 %, 2.3 %] [−1.3 %, 0.6 %]
RLAD 19.6 % ± 9.9 %, −60.2 % ± 3.7 %, 17.4 % ± 9.4 %,
[7.3 %, 48.3 %] [−65.8 %,−52.7 %] [6.5 %, 45.1 %] μ±σ, [min, max] of (100 × (calculation−MC)/MC)
Fig. 61D profiles from VBDM simulations with different spatial resolution (20 mm FWHM (blue), 10 mm FWHM (red), 0 mm FWHM (orange)) at the liver-lung interface showing percentage differences from MC without blurring. LD is omitted since it is similar to SKD. LS is 1 % in MC (a), SKD (b), and SK (c). LS is 20 % in MC (d), SKD (e), and SK (f).
Table 3Intervals in millimeters where the VBDM are accurate to within 10 % as a function of LS
and FWHM where positions≤0 represents the liver, positions >0 represents the lung, and 0
represents the liver-lung interface
VBDM LS (%)
Blurring FWHM (mm)
0 10 20
MC
1 (−∞,∞) (−∞,−4) U (31,∞) (−∞,−12) U (39,∞)
10 (−∞,∞) (−∞,−3) U (−2,−1) U (17,∞) (−∞,−11) U (−2,−1) U (26,∞) 20 (−∞,∞) (−∞, 0) U (11,∞) (−∞,−10) U (−2,−1) U (21,∞) LD 1 (−∞,−4) U (−2,−1) U (26,∞) (−∞,−4) U (−2,−1) U (7, 8) U(26,∞) (−∞,−11) U (−2,−1) U (24,∞)
10 (−∞, 0) U (11,∞) (−∞,−5) U (−2,−1) U (7,∞) (−∞,−11) U (−2,−1) U (19,∞) 20 (−∞,∞) (−∞,−5) U (−2,−1) U (8,∞) (∞,−9) U (−2,−1) U (16,∞) SKD 1 (−∞,−2) U (4,5) U (23,∞) (−∞,−6) U (−2,−1) U (10,11) U (23,∞) (−∞,−11) U (−2,−1) U (29,∞)
10 (−∞,−1) U (6,∞) (−∞,−6) U(−2,−1) U(11,∞) (−∞,−11) U (−2,−1) U (23,∞) 20 (−∞,−1) U (7,∞) (−∞,−6) U (−2,−1) U (11,∞) (−∞,−10) U (−2,−1) U (21,∞) SK 1 (−∞,−2) (−∞,−6) (−∞,−11) U (−0.5, 2) U (9, 13)
10 (−∞,−2) (−∞,−6) (−∞,−11)
20 (−∞,−2) (−∞,−6) (−∞,−10)
and 20 mm FWHM blurring, respectively, with a LS from 1 to 20 %. For MC, LD, and SKD in the lung, agreement was found beyond 26, 31, and 39 mm for 0, 10, and 20 mm FWHM blurring, respectively.
SK approximated the true absorbed dose near the lung interface well for 1 % LS with blurring of 10 and 20 mm but significantly underestimated the absorbed dose at the lung interface and deep into the lung for the higher LS. MC matched the true lung absorbed dose better for the higher LS and lower blurring. SKD and LD overestimated near the lung interface compared to MC, but they both approached the true value deep (>39 mm) within lung.
LD, SK, SKD, and MC approached the same value deep (>12 mm) within the liver, and they were all similar on the liver side of the interface, with MC performing slightly better than the others given a larger FWHM. On the liver side of the interface, LD, SK, and SKD all underestimated the absorbed dose similarly when the activity distribution was blurred.
Figure 7 provides context of the relative differences in Fig. 6 by showing line profiles of absorbed dose in arbitrary units for the VBDM with different lung shunt fractions and spatial resolutions. Figure 7 can be used to estimate absolute errors in the absorbed dose near the interface. For example, if one assumes the absorbed dose within the liver far from the interface is 80 Gy, then the SKD
absorbed dose in the lung at 7 mm from the interface for LS = 1 % and FWHM = 20 mm would be ≈9.4E-15/1.1E-14 × 80 Gy≈68 Gy whereas the true value would be≈1.9E-15/1.1E-14 × 80 Gy = 14 Gy.
Discussion
Our NL and tumor absorbed dose results are similar to those reported by Dieudonne et al. [4]; both studies showed better agreement with MC when using SKD instead of SK. Our work adds to the body of knowledge on 90Y dosimetry in part by assessing absorbed dose differences in the patient data due to differences in methodology. We also included LD voxel-based estimates in our comparison; these estimates are relevant since investigators have recently begun using LD in voxel-based absorbed dose calcula-tions following SIRT [20, 21]. Lung dosimetry is also of central importance in SIRT because lung absorbed dose limits the administered activity of90Y and can prevent patients from receiving adequate therapeutic tumor absorbed doses. However, to date, no work has compared VBDM for the lung and in the liver-lung interface based on90Y bremsstrahlung SPECT/CT imaging.
The correlations of LD, SK, and SKD with MC for mean absorbed dose to tumors, NL, and RL could potentially be used to convert mean absorbed doses between the dif-ferent VBDM for our image acquisition protocol.
The sensitivity of the patients’RL, NL, and total liverAD to the liver-lung interface agrees with the trend that larger distances from the interface are required in the lung (relative to the liver) to reach accurate absorbed doses. The RLADdecreased by ~50 % (8.8 ± 5.4 Gy to 4.2 ± 2.3 Gy) when 3 cm of the interface was excluded, whereas the total liverAD only increased by ~3 % (45.1 ± 12.7 Gy to 46.6 ± 15.0 Gy) for a similar interface exclusion. From a clinical perspective, this finding highlights that the liverAD is not sensitive to the interface region, but RLADis sensitive to the interface and the community needs to establish standards and guidelines for lung segmentation to ensure proper reporting of lung absorbed doses when using VBDM. These findings call for careful consideration of lung dose based on post-therapy 90Y imaging (and to a lesser degree pre-therapy 99mTc-MAA) for cumulative lung dose calculation as part of repeat treatments where cumulative lung dose is not to exceed 50 Gy. Patient respiratory mo-tion further degrades the effective spatial resolumo-tion at the liver-lung interface because motion correction techniques are not available in commercial SPECT/CT systems.
The simulated estimates of accuracy for MC, LD, SK, and SKD around the liver-lung interface as a function of LS and spatial resolution FWHM showed that all four VBDM investigated are within 10 % of the true liver absorbed dose when deeper than 12 mm from the liver-lung interface; this distance is expected to increase for larger FWHM and lower LS. Using MC, LD, or SKD, a similar accuracy was achieved in the lung when deeper than 39 mm from the interface. SK is not suitable for estimating accurate deep lung absorbed doses, but in the special case where LS is small and FWHM is large, SK may provide accurate estimates in close proximity to the liver-lung interface; this transient accuracy occurs due to SK errors in lung dosimetry canceling errors due to spill-in/out at the interface.
liver-lung interface through simulations, we have not performed such simulations for patient data. Future work should include the use of virtual phantoms where the true activity distribution is known followed by imaging simulation and application of VBDM to estimate true accuracy of such methods in patients.
Some have argued that LD may be preferable to transport (SK, SKD, or MC) for pure-beta emitters such as90Y [22]; radiation transport spreads90Y beta energy depos-ition locally at ~5 mm scale in soft tissue. Their rationale is that the finite spatial resolution of the imaging system (typically >10 mm in emission imaging) can account for beta radiation transport. However, realistic particle transport will depend on tissue type and density (e.g., soft tissue vs. lung). Although not discussed here, the collapsed cone convolution is another VBDM that is accurate at the lung soft-tissue interface for SIRT [23].
Our results on accuracy suggest that if one uses VBDM, then to reduce errors in absorbed dose estimates at the interface, the effective spatial resolution (physical spatial resolution and motion blurring) at the liver-lung interface should be minimized. Improvements in SPECT image quality would provide improved voxel-based activity distribution, especially at the liver-lung interface.
One limitation of our study stems from the use of a free-breathing CT scan as part of SPECT/CT. Consequently, the contoured liver/lung interface could be from any point of the respiratory cycle. In the analysis of the interface patient data, the results must be viewed critically since there is not a straightforward method to determine the correct spatial location or a reference volume for the lung. We have only estimated errors in 1D absorbed doses for misplaced activity at the lung-liver interface due to effective spatial resolution, not the change in activity due to incorrect attenuation correction at the interface. Future work could involve analysis with some respiratory motion man-agement such as breath hold, average CT, or 4D-CT. There was also uncertainty in the delineation of the tumor, liver, and lung and registration errors between the diagnostic contrast examination and the attenuation scan on the SPECT. Our RL segmentation methodology was similar to Busse et al. who reported that region growing resulted in an average error of 7 % for lung mass estimates based on free-breathing CT scans of the thorax [24]. We would like to point out that the patient data analysis was based on a single SPECT/CT model and customized imaging protocol and segmentation by a single physician using data from our institution.
SPECT calibration is important for reconstructing quantitative images. We estimated the 95 % confidence interval in our self-calibration to be ~10 %, based on 25 different patient scans. The purpose of this work was to investigate differences between VBDM, and thus by design the administered activity and total SPECT counts were the same between different VBDM. Therefore, the results of this work are not sensitive to the uncertainties in SPECT self-calibration.
Conclusions
Voxel-based dosimetry was performed using post-therapy 90Y bremsstrahlung SPECT/ CT. Multiple VBDM (MC, LD, SKD, SK) were investigated and compared to MC for
AD for tumor, NL, and RL. Differences were equivalent (<5 %) for tumor and NLAD, with SKD agreeing best with MC. Larger differences were found for the RL AD , with LD agreeing best with MC and SK producing dramatically incorrect values deep in the lung. Simulations of the liver-lung interface for multiple effective spatial resolutions and LSs were used to estimate nominal distance from the liver-lung interface where good accuracy was achieved deep within the liver and deep within the lung. Finite spatial resolution was shown to cause RLADestimates to be sensitive to the liver-lung interface region.
Abbreviations
VBDM:voxel-based dosimetry methods; MC: Monte Carlo; SK: soft-tissue kernel; SKD: soft-tissue kernel with density correction; LD: local deposition; NL: non-tumoral liver; RL: right lung; LS: lung shunt fraction;AD: mean absorbed dose; SIRT: selective internal radiation therapy; SPECT: single-photon emission computed tomography; CT: computed tomography; FWHM: full width at half maximum; VOI: volume of interest.
Competing interests
The authors declare that they have no competing interests.
Authors’contributions
AM performed segmentation and helped identify patient data for analysis. WS and SCK performed reconstructions. JM, SCK, and FM performed voxel-based dosimetry methods. JM, AM, WS, and SCK performed data analysis. JM and SCK drafted the manuscript. All authors read and approved the final manuscript.
Acknowledgements
For computing resources, the authors thank Dragan Mirkovic Ph.D. from the Department of Radiation Physics and the high-performance computing cluster at MD Anderson Cancer Center. The authors also thank Adam Neff from MIM for providing software for segmentation and analysis.
Compliance with ethical standards
Ethical approval: For this type of study, formal consent is not required.
Informed consent: This study was performed under an Institutional Review Board approved retrospective chart review protocol where the informed consent requirement was waived.
Funding: Research reported in this publication was supported in-part by the National Cancer Institute of the National Institutes of Health under Award Number R01CA138986.
Author details
1Department of Imaging Physics, The University of Texas MD Anderson Cancer Center, 1155 Pressler St, Unit 1352, Houston, TX 77030, USA.2The University of Texas Graduate School of Biomedical Sciences at Houston, Houston, TX, USA.3Department of Interventional Radiology, The University of Texas MD Anderson Cancer Center, Houston, TX, USA. 4Christiana Care Hospital, Newark, DE, USA.
Received: 23 March 2015 Accepted: 7 July 2015
References
1. Therasphere (TM). Biocompatibles UK Ltd: package insert. 2014. 2. SIR-Sphere (TM). Sirtex Medical Inc.: package insert. 2011.
4. Dieudonné A, Hobbs RF, Lebtahi R, Maurel F, Baechler S, Wahl RL, et al. Study of the impact of tissue density heterogeneities on 3-dimensional abdominal dosimetry: comparison between dose kernel convolution and direct Monte Carlo methods. J Nucl Med. 2013;54(2):236–43. doi:10.2967/jnumed.112.105825.
5. Giammarile F, Bodei L, Chiesa C, Flux G, Forrer F, Kraeber-Bodere F, et al. EANM procedure guideline for the treatment of liver cancer and liver metastases with intra-arterial radioactive compounds. Eur J Nucl Med Mol Imaging. 2011;38(7):1393–406. doi:10.1007/s00259-011-1812-2.
6. Dezarn WA, Cessna JT, DeWerd LA, Feng W, Gates VL, Halama J, et al. Recommendations of the American Association of Physicists in Medicine on dosimetry, imaging, and quality assurance procedures for90Y microsphere brachytherapy in the treatment of hepatic malignancies. Med Phys. 2011;38(8):4824–45. doi:10.1118/ 1.3608909.
7. Garin E, Lenoir L, Rolland Y, Edeline J, Mesbah H, Laffont S, et al. Dosimetry based on 99mTc-macroaggregated albumin SPECT/CT accurately predicts tumor response and survival in hepatocellular carcinoma patients treated with90Y-loaded glass microspheres: preliminary results. J Nucl Med. 2012;53(2):255–63. doi:10.2967/
jnumed.111.094235.
8. Wondergem M, Smits MLJ, Elschot M, de Jong HW, Verkooijen HM, van den Bosch MA, et al. 99mTc-macroaggregated albumin poorly predicts the intrahepatic distribution of90Y resin microspheres in hepatic radioembolization. J Nucl Med. 2013. doi:10.2967/jnumed.112.117614.
9. Yu N, Srinivas SM, DiFilippo FP, Shrikanthan S, Levitin A, McLennan G, et al. Lung dose calculation with SPECT/CT for
90Yittrium radioembolization of liver cancer. Int J Radiat Oncol. 2013;85(3):834–9. doi:10.1016/j.ijrobp.2012.06.051.
10. Elschot M, Nijsen JFW, Lam MGEH, Smits ML, Prince JF, Viergever MA, et al. 99mTc-MAA overestimates the absorbed dose to the lungs in radioembolization: a quantitative evaluation in patients treated with 166Ho-microspheres. Eur J Nucl Med Mol Imaging. 2014;41(10):1965–75. doi:10.1007/s00259-014-2784-9.
11. Siman W, Kappadath SC. Energy window based scatter correction for improved90Y bremsstrahlung imaging
[abstract]. J Nucl Med. 2013;54(Supplement 2):527.
12. Kawrakow I, Rogers DWO. The EGSnrc Code System: Monte Carlo simulation of electron and photon transport. Vol Technical Report PIRS-701. (Ottawa: National Research Council of Canada)
13. Walters B, Rogers DWO. DOSXYZnrc Users Manual. Ottawa, Ontario, Canada: National Research Council of Canada; 2002.
14. Berger MJ, Coursey JS, Zucker MA, Chang J. ESTAR, PSTAR, and ASTAR: computer programs for calculating stopping-power and range tables for electrons, protons, and helium ions (version 1.2.3). Gaithersburg, MD.: National Institute of Standards and Technology; 2005. http://www.nist.gov/pml/data/star/. Accessed July 20, 2015.
15. Snyder WS, Cook MJ, Nasset ES, Karhausen LR, Howells GP, Tipton IH. Report on the task group on reference man. In: ICRP Publ. No. 23. Oxford: International Commission on Radiological Protection; 1975.
16. Cristy M, Eckerman KF. Specific absorbed fractions of energy at various ages from internal photon sources: 1. Methods. 1987.
17. Eckerman KF, Endo A. User guide to the ICRP CD and the DECDATA software. Ann ICRP. 2008;38(3):e1–25. doi:10.1016/j.icrp.2008.10.001.
18. Lanconelli N, Pacilio M, Lo Meo S, Botta F, Di Dia A, Aroche AT, et al. A free database of radionuclide voxel S values for the dosimetry of nonuniform activity distributions. Phys Med Biol. 2012;57(2):517–33. doi:10.1088/0031-9155/57/2/517. 19. Valentin J, Streffer C. Basic anatomical and physiological data for use in radiological protection: Reference
values—ICRP Publication 89. Ann ICRP. 2002;32(3-4):1-265. doi:10.1016/S0146-6453(03)00002-2.
20. Pasciak AS, Bourgeois AC, Bradley YC. A comparison of techniques for90Y PET/CT image-based dosimetry following radioembolization with resin microspheres. Front Oncol. 2014;4. doi:10.3389/fonc.2014.00121
21. Kao Y-H, Steinberg JD, Tay Y-S, Lim GK, Yan J, Townsend DW, et al. Post-radioembolization yttrium-90 PET/ CT—part 2: dose-response and tumor predictive dosimetry for resin microspheres. EJNMMI Res. 2013;3(1):57. doi:10.1186/2191-219X-3-57.
22. Pasciak AS, Erwin WD. Effect of voxel size and computation method on Tc-99m MAA SPECT/CT-based dose estimation for Y-90 microsphere therapy. IEEE Trans Med Imaging. 2009;28(11):1754–8. doi:10.1109/ TMI.2009.2022753.
23. Sanchez-Garcia M, Gardin I, Lebtahi R, Dieudonné A. A new approach for dose calculation in targeted radionuclide therapy (TRT) based on collapsed cone superposition: validation with 90Y. Phys Med Biol. 2014;59(17):4769. doi:10.1088/0031-9155/59/17/4769.
24. Busse N, Erwin W, Pan T. Evaluation of a semiautomated lung mass calculation technique for internal dosimetry applications. Med Phys. 2013;40(12):122503. doi:10.1118/1.4830433.
25. Rong X, Du Y, Ljungberg M, Rault E, Vandenberghe S, Frey EC. Development and evaluation of an improved quantitative90Y bremsstrahlung SPECT method. Med Phys. 2012;39(5):2346–58. doi:10.1118/1.3700174.
Submit your manuscript to a
journal and benefi t from:
7Convenient online submission 7Rigorous peer review
7Immediate publication on acceptance 7Open access: articles freely available online 7High visibility within the fi eld
7Retaining the copyright to your article