Uncertainty Analysis of Watershed-Based Flow
and Water Quality Modelling with Different
DEM Data Sources
Maryam Roostaee
1*and Zhiqiang Deng
1* 1 Louisiana State University, Baton Rouge, USA.[email protected], [email protected]
Abstract
DEMs are important data required in watershed-based hydrological and water quality modeling since they are employed to derive critical characteristics of watershed through a watershed delineation process. This study aims to analyze the uncertainties associated with DEM sources in watershed modeling and compare them to DEM resolution-originated uncertainties. Toward this end, six different scenarios, involving 3 DEMs of 30-m resolution and 3 DEMs of 90-m resolution from NED, ASTER and SRTM sources, were developed using HSPF model for an agricultural watershed in Iowa, USA. The HSPF model was run for each scenario to produce simulated flow and loads of sediment, nitrate, and phosphorus. Results suggested that the level of uncertainty involved in the DEM sources was considerably (up to twofold) greater than those originated from decreasing DEM resolution. The finding is important to the proper selection of DEM data source and thereby to the reduction of uncertainties involved in watershed-based hydrological and water quality modelling.
1
Introduction
Digital Elevation models (DEMs) are generally employed as the core input data in watershed modelling for the creation of stream networks and the derivation of hydrologic features through the watershed delineation process. While DEMs with a wide range of spatial resolutions are available from various sources (Lin et al., 2013), results of watershed modelling with different DEM sources
and resolutions may be significantly different, making simulated flow and water quality parameters highly uncertain. Uncertainties caused by DEM resolutions in flow and water quality simulations have been extensively investigated (Chaubey et al., 2005, Cotter et al., 2003, Lin et al., 2013). However,
uncertainties originated from DEM sources in watershed modelling have not been well understood.
* Maryam Roostaee performed the watershed-based flow and water quality modeling and prepared the first version of this
paper under the direction of Zhiqiang Deng who finalized the paper.
Volume 3, 2018, Pages 1778–1786
The source-induced uncertainties become more and more important due to the availability of several DEMs of same resolution from various sources, such as 1 arc-second DEM (approximately 30m resolution or 30-m DEM) from National Elevation Dataset (NED), 30-m DEM from SRTM (Shuttle Radar Topography Mission), 30-m DEM from ASTER (Advanced Space-borne Thermal Emission and Reflection Radiometer) for the U.S., and the availability of multiple methods for resampling DEMs from LIDAR (light detection and ranging) data or other similar high-resolution datasets. While DEM source effects on watershed modelling results and critical source area identification have been assessed with the Soil and Water Assessment Tool (SWAT) model (Lin et al., 2013, Tan et al., 2015,
Xu et al., 2016) and the Water Erosion Prediction Project (WEPP) model (Zhang et al., 2008), it is
not clear how the results of the HSPF (Hydrological Programing Simulation- FORTRAN) model would be affected by the uncertainty in DEM sources.
The primary objective of this study is to identify the uncertainties introduced by DEM sources into watershed modelling particularly related to the application of the widely used BASINS/HSPF modelling system developed by the U.S. Environmental Protection Agency (USEPA). The secondary objective is to determine the relative importance of uncertainties produced by the DEM source and the DEM resolution to watershed modelling. To that end, daily flow, sediment, nitrate, and phosphorus loads were simulated for the Wolf Creek watershed in Iowa, USA using the BASINS/HSPF modelling system.
2
Material and Methods
2.1
Study Area and Data Collection
In order to identify the uncertainties originated from DEM sources and entered into the simulation of flow and water quality parameters, NED (https://nationalmap.gov/elevation.html), ASTER and SRTM (https://gdex.cr.usgs.gov/gdex) DEMs with original resolutions of 30-m were downloaded from the corresponding websites and employed in the automatic watershed delineation in BASINS. The employed DEMs are displayed in Error! Reference source not found..
Other required datasets include (1) hourly precipitation data obtained via BASINS for IA138315 station (Traer). Other meteorological data were obtained from BASINS for the IA725461 station (Marshalltown Muni); (2) USGS National Land Cover Dataset (NLCD) 2006
https://www.mrlc.gov/nlcd2006.php; (3) STATSGO (State Soil Geographic) data layers
https://water.usgs.gov/lookup/getspatial?ussoils; (4) daily streamflow data for Wolf Creek obtained from USGS station 05464220 (Wolf Creek near Dysart); and (5) water quality data for temperature, Dissolved Oxygen (DO), nitrate (NO3), phosphorus (P) and TSS (Total Suspended Sediment) concentrations obtained from Iowa Department of Natural Resources (DNR) station: 10070002 (Wolf Creek at La Porte City) http://www.iowadnr.gov/Environmental-Protection/Water-Quality.
2.2
Description and Calibration of BASINS and HSPF Modelling
System
Better Assessment Science Integrating Point and Nonpoint Sources (BASINS) is a support tool from USEPA for environmental analysis such as watershed- and water quality-based studies. HSPF model is one of the spatially distributed watershed models that are coupled with BASINS. HSPF is a powerful, conceptual model that is capable of performing flow and point and non-point source water quality simulations involving in-stream hydraulic and sediment-chemical interactions. More
information about these models can be found at https://www.epa.gov/exposure-assessment-models/surface-water-models.
In order to identify the uncertainties from DEM sources in watershed modelling and to further compare these uncertainties with the uncertainties originated from DEM resolution, various scenarios were created. DEMs with 30-m and 90-m resolutions, from 3 different free of charge, large-area elevation datasets (sources) including NED, ASTER, and SRTM, were utilized and six different HSPF scenarios were developed. As there were no 90-m NED and ASTER DEMs available, ArcGIS software package was used to obtain resampled 90-m DEM using the nearest neighbor method from the available 30-m DEMs. Resolutions coarser than 90m were not used in this study as the application of such DEMs is not common in watershed-scale analysis.
The six DEMs were employed as the core data in the automatic delineation of subwatersheds and stream networks. The 30-m NED DEM was selected as the reference DEM as it is the most popular DEM among the three sources in U.S. HSPF parameters were calibrated for flow, water temperature, DO, NO3, P, and TSS using the automatically delineated 30-m NED DEM for Wolf Creek watershed and the observed flow and water quality data from 2002 to 2006. Besides the visual comparison of simulated and measured time-series of flow and water quality parameters, the coefficient of determination (R2) and Relative Error (RE) (Devore, 2012) were also utilized to measure the performance of the calibrated HSPF model and defined in Equations (1) and (2) below.
n i n i obs i obs sim i sim n i obs i obs sim i sim y y y y y y y y R 1 1 2 2 1 2 ) ( ) ( ) ( ) ( (1) 100 ) ( ) ( 11
n i i obs n i i obs i sim y y y RE (2)In which i sim
y andyobsi , respectively, are the simulated and observed daily flows (or water quality parameters) for the ith day while
sim
y andyobs, respectively, denote the simulated and observed average stream flows (or water quality parameters).
2.3
Uncertainty Analysis of DEM Sources
In order to quantify the uncertainties in watershed-based flow and water quality modeling from different DEM data sources, parameter values of the calibrated HSPF model were used for all the 6 HSPF model scenarios of the watershed. The outputs of HSPF models, including daily flow, NO3, P and TSS loads, were then compared with the corresponding ones of the calibrated reference scenario (30-m NED DEM) using the RE and R2 indicators.
3
Results and Discussion
3.1
HSPF Model Calibration
simulation was proved to be very good since the values of R2 and RE for flow were 0.79 and 16%, respectively. RE values for simulation of NO3, P and TSS were 1.6, 4.9 and 26%, respectively, while the corresponding R2 values were 0.49, 0.57 and 0.6, respectively. These values indicated that R2 and RE indeed provide a different perception of model performance. Particularly, the HSPF was capable of capturing the variation trend in TSS concentration better than those in NO3 and P concentrations, as evidenced by the highest R2 value of 0.6 even though the RE value of 26% for TSS concentration was highest. Overall, the performance of the calibrated HSPF model in simulating trends, timings, and magnitudes of flow, sediment, and nutrients was good (Donigian, 2002).
3.2
DEM Source/Resolution Effect on Flow and Water Quality
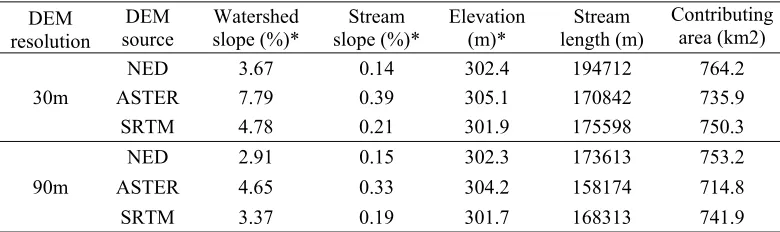
DEM source and resolution influence certain topographic characteristics of the watershed through delineation process, which in turn affect the hydrological and water quality simulation at watershed scale. Derived values of some of the substantial topographic parameters, such as contributing drainage area (to the gage station near the watershed outlet), total length of stream, average elevation as well as average slope of watershed and streams, are presented in * Average values
Table 1. Despite minor variations in the average elevation, the watershed and stream slopes are significantly influenced by the DEM source. The 30-m ASTER DEM produced the steepest watershed and stream slopes (7.79% and 0.39%, respectively) which are more than twice the slopes calculated from 30-m NED DEM (3.67 and 0.14%). The total length of streams and the contributing area extracted from 30-m ASTER DEM are lowest amongst DEMs of various sources at 30-m resolution. These two parameters are also highly correlated (R=0.9).
DEM resolution
DEM
source Watershed slope (%)* slope (%)* Stream Elevation (m)* length (m) Stream
Contributing area (km2)
30m
NED 3.67 0.14 302.4 194712 764.2
ASTER 7.79 0.39 305.1 170842 735.9
SRTM 4.78 0.21 301.9 175598 750.3
90m
NED 2.91 0.15 302.3 173613 753.2
ASTER 4.65 0.33 304.2 158174 714.8
SRTM 3.37 0.19 301.7 168313 741.9
* Average values
Table 1:DEM source/resolution effects on extracted topographic features of the study watershed
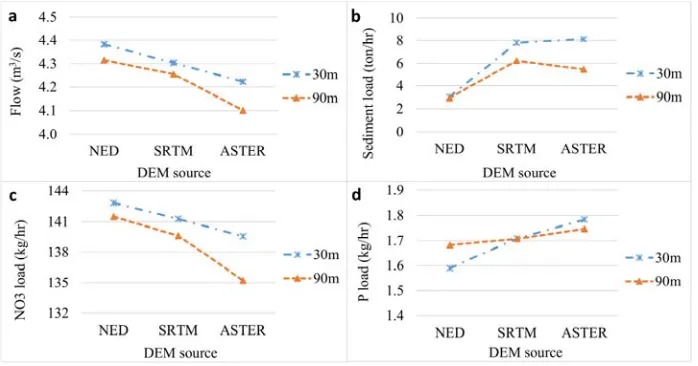
The uncertainties originated from DEM source and resolution are illustrated in Error! Reference source not found.. The figure compares flow rates as well as sediment, NO3 and P loads simulated with the calibrated HSPF models for various scenarios and presents an analogy between uncertainties related to DEM sources and resolutions. It can be seen from the figure that the parameter values simulated using the 90-m DEMs were systematically lower than the corresponding values from the 30-m DEMs (except for P load), clearly illustrating how uncertainties are entered into flow and water quality simulations by the DEM resolution. The difference between the simulated flow from 30 and 90-m ASTER DEMs (0.12m3/s) is greater than the counterpart discrepancies (0.05 and 0.07 m3/s) from DEMs of other sources. The errors were obviously transferred into the water quality simulations.
Error! Reference source not found. also shows that uncertainties from SRTM DEM are smaller than uncertainties from ASTER DEM since the results from SRTM DEM are closer to the results from the reference DEM (30m NED) for the study area. In addition, Error! Reference source not found. suggests that although considerable uncertainties arise due to DEM resolution (32% RE in sediment loads from 30-m and 90-m ASTER DEMs), uncertainties related to DEM sources are much greater. For example, the maximum difference between the simulated sediment loads using 30-m DEM and 90-m DEM of the same source is 2.64 ton/hr while the maximum difference between the simulated sediment loads from various sources is 5.07 ton/hr. Likewise, the uncertainties involved in DEM source outweigh those induced by DEM resolution in the extracted topographic parameters.
More detailed results are provided in Error! Reference source not found. where the simulated results from the 30-m NED were used as the references. The RE values for other DEM sources and resolutions were computed using the reference values of the 30-m NED. According to the RE values listed in Error! Reference source not found., sediment load has the highest sensitivity to changes in DEM resolution and source (167%), followed by P (12.2%), flow (6.4%) and NO3 loads (5.3%). The results confirm the significance of uncertainties related to DEM sources in watershed modelling using HSPF model while the literature (Tan et al., 2015) inferred that the resolution is the most sensitive
DEM parameter in flow simulation using SWAT model. Considering the DEM sources incorporated in previous studies (Tan et al., 2015, Xu et al., 2016) and the current study, it is clear that the factor
controlling the significance of DEM source versus resolution is the vertical accuracy of DEM.
Although vertical accuracy of different DEM sources may vary based on the study location (Elkhrachy, 2017, Santillan & Makinano-Santillan, 2016), the overall accuracy could be used as a guidance. When the vertical accuracies of employed sources are more or less similar, such as ASTER and SRTM with vertical accuracy of 17 meters at the 95% confidence level (https://asterweb.jpl.nasa.gov/GDEM.ASP) and less than 16m at the 90% confidence level (https://www2.jpl.nasa.gov/srtm/statistics.html), respectively, DEM resolution may play a critical role. However, the source is the determinant DEM parameter when comparing these DEMs to Lidar-derived DEMs or NED dataset-based DEMs.
As various sources are incorporated in NED dataset, the vertical accuracy of the NED DEM varies spatially regarding the accuracy of the source dataset. The RMSE and mean values describing the overall reported absolute vertical accuracy of conterminous United States are 1.55 and -0.29 meters, respectively (Gesch et al., 2014). Figure 3 indicates that the simulated flow (panel a) and the
simulated NO3 load (panel c) are strongly affected by DEM sources even though the DEM resolution effects are also important, as evidenced by the clear variation trends of flow and NO3 load with the sources (R=0.98). While the variation trends of sediment load (panel b) and P load (panel d) with the DEM source are different from those of the flow and NO3 load, both panels demonstrate that the simulated sediment and P loads highly affected by DEM sources. The variation trends of sediment and P loads with the DEM source are similar to those in the slope due to the critical role of stream and watershed slope in simulation of sediment detachment and deposition processes.
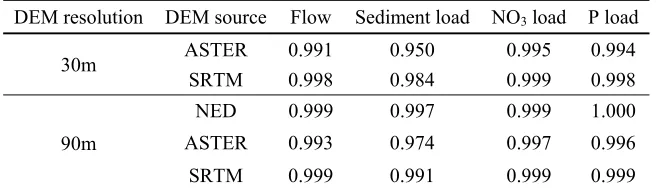
In order to further understand the effects of DEM source/resolution on watershed-based simulations of flow, sediment, NO3 and P, the R2 values are calculated for different scenarios by considering the simulated results from the 30-m NED as the references and summarized in Table 3. The results in Error! Reference source not found. indicate that the most R2 values are greater than 0.99, suggesting that the variation trends of simulated parameters using various DEMs perfectly match with the corresponding ones resulted from 30-m NED despite the considerable differences seen in Error! Reference source not found.. Since the same time series of rainfall is incorporated for flow simulation within various scenarios and flow is the main driver of sediment and nutrient transport, it is expected to obtain time series with similar trends from different scenarios. Although the differences between calculated R2 values are minor, these slight changes are in compliance with the variations seen in Error! Reference source not found.. For instance, the average sediment load calculated from 30-m ASTER and SRTM DEMs (RE values 166.7 and 156.1, respectively) were significantly higher than that simulated using the 30-m NED. The RE results are consistent with the relatively low R2 values of 0.95 and 0.98 in Table 3.
It should be pointed out that the statistical metrics, RE and R2, measure different aspects of DEM effects on HSPF model results. RE describes the DEM effect in terms of the difference between the magnitudes of simulated parameters while R2 describes the agreement of the variation trends. According to the R2 values in Table 3, the DEM source/resolution has trivial impact on results of
DEM resolution DEM source Flow Sediment load NO3 load P load
30-m ASTER -3.6 166.7 -2.3 12.2
SRTM -1.8 156.1 -1.1 7.6
90-m
NED -1.51 -3.57 -0.92 5.87
ASTER -6.41 80.05 -5.32 9.94
SRTM -2.90 105.03 -2.23 7.47
hydrological and water quality simulations using HSPF model. However, the marked changes revealed by the RE indicator in Table 2 suggest that the use of DEM from different data sources/resolutions may cause high uncertainties in watershed-based flow and water quality simulations. The findings are particularly important to the proper selection of DEM data source and thereby to the reduction of uncertainties involved in watershed-based hydrological and water quality modelling.
4
Conclusion
While the DEM resolution was commonly considered as one of the major sources of uncertainties in watershed modelling results, the results from this study indicate that the level of uncertainty involved in the DEM sources could be considerably (up to twofold) higher than those originated from decreasing DEM resolution. Depending on the vertical accuracy of the accessible elevation datasets and the available computational resources, either the DEM source or the DEM resolution could be a major source of the uncertainties in watershed modelling results. The findings are important to the proper selection of DEM data source and thereby to the reduction of uncertainties involved in watershed-based hydrological and water quality modelling. When high precision datasets (such as NED) are available, DEMs from other sources are not recommended.
References
Chaubey, I., Cotter, A. S., Costello, T. A. & Soerens, T. S. (2005) Effect of DEM data resolution on SWAT output uncertainty. Hydrol. Process.19(3), 621–628. doi:10.1002/hyp.5607
Cotter, A. S., Chaubey, I., Costello, T. A., Soerens, T. S. & Nelson, M. A. (2003) Water Quality Model Output Uncertainty As Affected By Spatial Resolution of Input Data. J. Am. Water Resour. Assoc.39(4), 977–986. doi:10.1111/j.1752-1688.2003.tb04420.x
Devore, J. L. (2012) Probability and statistics for engineering and the sciences. Brooks/Cole,
Cengage Learning.
Donigian, A. S. (2002) Watershed model calibration and validation: The HSPF experience. Proc. Water Environ. Fed.2002(8), 44–73.
Elkhrachy, I. (2017) Vertical accuracy assessment for SRTM and ASTER Digital Elevation Models: A case study of Najran city, Saudi Arabia. Ain Shams Eng. J. Elsevier.
doi:10.1016/J.ASEJ.2017.01.007
DEM resolution DEM source Flow Sediment load NO3 load P load
30m ASTER 0.991 0.950 0.995 0.994
SRTM 0.998 0.984 0.999 0.998
90m
NED 0.999 0.997 0.999 1.000
ASTER 0.993 0.974 0.997 0.996
SRTM 0.999 0.991 0.999 0.999
Gesch, D., Oimoen, M. & Evans, G. (2014) Accuracy assessment of the US Geological Survey National Elevation Dataset, and comparison with other large-area elevation datasets: SRTM and ASTER. doi:10.3133/ofr20141008
Lin, S., Jing, C., Coles, N. A., Chaplot, V., Moore, N. J. & Wu, J. (2013) Evaluating DEM source and resolution uncertainties in the Soil and Water Assessment Tool. Stoch. Environ. Res. risk Assess.
27(1), 209–221.
Santillan, J. R. & Makinano-Santillan, M. (2016) VERTICAL ACCURACY ASSESSMENT OF 30-M RESOLUTION ALOS, ASTER, AND SRTM GLOBAL DEMS OVER NORTHEASTERN MINDANAO, PHILIPPINES. doi:10.5194/isprsarchives-XLI-B4-149-2016
Tan, M. L., Ficklin, D. L., Dixon, B., Yusop, Z. & Chaplot, V. (2015) Impacts of DEM resolution, source, and resampling technique on SWAT-simulated streamflow. Appl. Geogr.63, 357–368.
Xu, F., Dong, G., Wang, Q., Liu, L., Yu, W., Men, C. & Liu, R. (2016) Impacts of DEM uncertainties on critical source areas identification for non-point source pollution control based on SWAT model. J. Hydrol.540, 355–367.
Zhang, J. X., Chang, K. & Wu, J. Q. (2008) Effects of DEM resolution and source on soil erosion modelling: a case study using the WEPP model. Int. J. Geogr. Inf. Sci. 22(8), 925–942. Taylor &