201 Mullica Hill Road Glassboro, NJ 08028
Comprehensive Energy and Water Assessment
Substitute_FACILTY
Street Address
City, State, Zip
Month Year
Prepared For:
NJ Department of Military and Veterans Affairs 101 Eggerts Crossing Road
Lawrenceville, NJ 08648
Prepared By:
Undergraduate Student(s): Student Names Graduate Student: Student Name
Advisor(s): Faculty Names
Commented [A1]: In this document, blue and red text are used to indicate text that needs to be changed. Red text is can often be replaced using find/replace, e.g., find and replace ‘substitute_FACILITY’ throughout document. Blue text is example information that needs to be rewritten for the specific facility.
Commented [A2]: As you insert changes throughout the report, change any red and blue fonts back to black, and resolve any comments that you have completed. This allows you to see where additional work needs to be done as you progress towards the final submission. Commented [A3]: Address for facility
Commented [A4]: Month you submit your final report Commented [A5]: Insert a picture of the front of the building.
1
TABLE OF CONTENTS
EXECUTIVE SUMMARY 1
INTRODUCTION 3
Site Visits 3
Post-Audit 4
FACILITY DESCRIPTION 5
ISR Analysis 5
Site & Grounds 6
Sustainment 6
Building Exterior 6
Bathrooms/Shower Rooms 6
Heating, Ventilation & Air Conditioning (HVAC) 6
Lighting 6
Guiding Principles Compliance 6
ENERGY AND WATER PROFILE 7
Electricity Consumption 7
Natural Gas Consumption 7
Water Consumption 7
Sustainability Analysis – Greenhouse Gas Emissions 8
MODELS 10
Model Accuracy 10
SIGNIFICANT ENERGY CONSUMERS 11
Appliances 11
Lighting 11
HVAC 11
ENERGY CONSERVATION MEASURES 12
WATER CONSERVATION MEASURES 13
RENEWABLE ENERGY MEASURES 14
CONCLUSION 15
REFERENCES 16
APPENDIX A: LIGHTING SCHEDULE 17
APPENDIX B: PLUG LOAD SCHEDULE 18
APPENDIX C: HVAC – COMPONENTS AND eQUEST INPUTS & OUTPUTS 19
APPENDIX D: WATER FIXTURE SCHEDULE 21
APPENDIX E: ISR ANALYSIS 22
APPENDIX F: ENERGY STAR PORTFOLIO MANAGER ANALYSIS 23
APPENDIX G: DEGREE DAYS VERSUS GAS USE 24
APPENDIX H: OCCUPANT SURVEYS 27
APPENDIX I: MONTIORING DEVICE DATA 28
Commented [A7]: Use Heading 1 and Heading 2 styles for headings.
2
LIST OF FIGURES
Figure 1: Aerial imagery of Substitute_FACILTY, Substitute_LOCATION (RU GeoLab
2015) 0
Figure 2: Floor plan of Substitute_BUILDING 0
Figure 3: Current conformance with Guiding Principles – Substitute_FACILITY 1
Figure 4: Monthly electricity consumption in kWh 2
Figure 5: Monthly natural gas consumption in therms 2
Figure 6: Quarterly water consumption in thousand gallons 3 Figure 7: Annual energy consumption breakdown by energy type,
substitute_YEAR(s) 4
Figure 8: Annual energy cost breakdown by energy type, substitute_YEAR (s) 4 Figure 9: Annual greenhouse gas emissions by energy type, substitute_YEAR (s) 4 Figure 10: Distribution of electricity consumption at Substitute_FACILITY from LPM
6 Figure 11: Largest electricity consuming appliances at Substitute_FACILTY. 6 Figure 12: Distribution of electricity consumption by bulb type at
Substitute_FACILTY 6
Figure 13: eQUEST model output 6
LIST OF TABLES
Table 1: Summary of energy saving, water saving, and renewable energy measures 2 Table 2: Summary of audit timeline and building contact information 0
Table 3: Summary of Building Information. 0
Table 4: Unit cost and CO2e emissions of energy consumed 3 Table 5: Amount of utility consumed and annual CO2 emissions at
Substitute_FACILITY in substitute_YEAR(S) 3
Table 6: Financial Summary of Substitute_MEASURE 7
Table 7: Summary of energy saving, water saving, and renewable measures 10
Commented [A8]: If you use the style ‘caption’ for Table titles, not just text, the list of figures/tables can be automatically updated.
References>Insert Captions
Update just before final submission: right click and select ‘Update Field’. This will fix the substute_ items.
Commented [A9]: If you use the style ‘caption’ for Table titles, not just text, the list of figures/tables can be automatically updated.
References>Insert Captions
3 List of Common Acronyms
ARNG - Army National Guard CO2 - Carbon Dioxide
DMAVA - Department of Military and Veteran Affairs ECM - Energy Conservation Measure
FMS - Field Maintenance Shop GP – Guiding Principles
HVAC - Heating, Ventilation, and Air Conditioning ISR – Installation Status Report
kWh - kilowatt hour LED - Light Emitting Diode LFL - Linear Fluorescent Light LPM - Light and Plug Load Model
NJ DMAVA – New Jersey Department of Military and Veteran’s Affairs POV - Privately Owned Vehicle
REM - Renewable Energy Measure UBAR – Utility Bill Analytics and Reporting WCM - Water Conservation Measure
4
EXECUTIVE SUMMARY
The Rowan University Energy Audit Team conducted an energy audit on substitute_DATE of substitute_FACILTY located at substitute_ADDRESS. The audit was conducted per the request of the New Jersey Department of Military and Veteran Affairs (NJ DMAVA) in order to meet federal energy mandates. The objectives of this audit were to find the significant sources of energy consumption and to offer suggestions to NJ DMAVA to reduce the total energy consumption through economically viable measures. The three possible measures identified by this audit are (a) Energy Conservation Measures (ECM) (b) Water Conservation Measures (WCM) and (c) Renewable Energy Measures (REM).
Based on the energy audit and the analysis, the energy consumption of substitute_FACILITY substitute_FACILITY can be minimized by the replacement or modified usage of appliances, lights, HVAC and other devices as well as by using Solar, a renewable measure, based on the armory’s physical location.
A Light and Plug Load Model (LPM) of the entire facility was completed by identifying all energy consuming items. An eQUEST model was created to simulate the facility’s electric and fuel consumption. The LPM accounts for electricity consumption within X% of the electric bills. The ECM’s presented in this report include LED replacement, delamping, utilizing energy star appliances and installation of programmable thermostats. The ECM’s account for a potential savings of ---kWh of energy annually which approximately is $---. The WCM presented in this report include replacing the current water fixtures with Water Sense fixtures in the bathrooms, the shower rooms, and the faucets in the facility. The WCM’s account for a potential savings of --- gallons of water annually. The REM’s included in this report include the installation of the roof top solar system. Implementing Solar panels to this facility would significantly lower energy usage and cost. However, included with this is a high initial installation cost, making it slightly less feasible than smaller and less drastic measures. All Substitute_XX saving measures recommended in Table 1 were evaluated with a lifetime of Substitute_XX.
This report walks the reader through the process used to perform the energy audit, identifies the significant sources of energy consumption, and recommends possible solutions that reduce the amount of energy consumed by each source and save money for the substitute_FACILTY.
Table 1: Summary of energy saving, water saving, and renewable energy measures
Commented [A11]: Write this section last. The executive summary and the rest of the report should be independent of each other. Meaning, a reader should be able to understand this section without reading the rest of the report, and be able to understand the rest of the report without reading this section.
Commented [A12]: List here what is recommended in the report
Commented [A13]: Example of what should be described here. Keep it brief, because this is just the executive summary and you’ll be going into more detail in the report.
5 ENERGY CONSERVATION MEASURES (ECMs)
Description Net Install Cost Annual Energy
Savings
Annual Cost
Savings Simple Payback (Years)
Savings to Investment Ratio
$ $
$ $
$ $
TOTAL: $ $
WATER CONSERVATION MEASURES (WCMs) Description Net Install
Cost Annual Gal Savings Annual Cost Savings Simple Payback (Years)
Savings to Investment Ratio
$ $
$ $
TOTAL: $ $
RENEWABLE ENERGY MEASURES (REMs) Description Net Install
Cost Annual Production Annual Cost Savings Simple Payback (Years)
Savings to Investment Ratio
$ $
$ $
TOTAL: $ $
6
INTRODUCTION
The scope of the building energy and water audit is:
1. The audit would take place for the substitute_FACILTY and any exterior lighting surrounding the building, with a focus on X.
2. The primary motivation for the audit is to determine if the annual energy use and costs are explainable and/or remediable.
3. If the energy consumption is remediable, this report will contain suggestions for reducing costs and saving energy.
4. The site would be examined for feasibility of implementing renewable energy.
Table 2 is used to describe the audit schedule and identify the building contact
Table 2: Summary of audit timeline and building contact information
Floor Plans Obtained Substitute_DATE Bills Accessed Substitute_DATE(s) Site Visit(s) Substitute_DATE(s)
Site POC Substitute_NAME(with Rank/Job Title)
Phone Number
Site Visits
To complete the energy audit of Substitute_FACILITY, the Rowan University Energy Audit Team visited the facility on Substitute_DATE(s). Substitute_NAME accompanied the team during various parts of the walkthrough of the building, and provided additional information regarding appliance, lighting, and heating, ventilation, and air conditioning (HVAC) specifications and use patterns. Several building occupants were interviewed to determine operation times for lights and appliances. In addition, occupants were asked to respond to survey questions regarding energy consumption habits. Occupant surveys can be found in Appendix H.
The following data were collected to develop a Light and Plug Load Model (LPM) of the facility:
a) Light bulb models and ballast types for all lighting in the building.
b) Average illumination levels of various rooms, as measured with an Extech EasyView™ 30 Digital Light Meter.
c) Appliance power consumption for all appliances in the building, based on the product specifications or by direct measurement with a Kill-A-Watt Electricity Usage Monitor.
d) Typical operation patterns for lights and appliances.
To develop a computer simulation of Substitute_BUILDINGin eQUEST, a common building energy simulation software, the following data were collected:
a) Building envelope details including insulation, wall type and thickness, and windows specifications.
Commented [A16]: If applicable
Commented [A17]: This date or date range should reflect the time period you accessed the bills in UBAR, giving a more accurate frame of reference of which bills were available at the time.
Commented [A18]: If more than one trip was made make this plural
7
b) Location and estimated size of gaps where excess air infiltration may be occurring through the building envelope, as identified by visual/tactile inspection or thermal camera.
c) Specifications of heating, ventilation, and air-conditioning equipment, including size, fuel source, and operation patterns, as determined through visual examination of units, discussion with Substitute_XX, or from design documents.
Post-Audit
After the site visit, the team compiled a schedule of lighting fixtures and appliances, annual use, and annual electricity consumption to create the LPM, which can be found in Appendices A and B. From the LPM, the total annual electricity consumption of Substitute_BUILDING(s), minus electricity used for HVAC, was determined. A model of the building was created in eQUEST to simulate annual energy consumption. The HVAC components and eQUEST model inputs can be found in Appendix C. In addition, a schedule of all water fixtures and water flowrate and consumption estimates can be found in Appendix D.
The LPM and eQUEST models are tuned by comparison with utility bills. To isolate the effects of heating and cooling, the team looked at the amount of electricity consumed (metered and billed) in the months of Substitute_XXand/through Substitute_XX. These months typically have mild temperatures; heating and cooling operations are minimal. As such, electricity consumption during these months is from plug loads and appliances, not HVAC, and can be averaged to find the baseline monthly electricity consumption. While HVAC components may be used occasionally during these months, they are not in operation enough to make a significant impact on the accuracy of the electricity consumption model.
Commented [A20]: Delete any of these your team did not do, but check with your supervisor before not doing anything on this list! Add anything additional your team did that is not already listed.
Commented [A21]: If a second building was modeled, rewrite this paragraph to reflect that.
Commented [A22]: They are tuned by varying consumption levels and operating time, etc. Make sure you use reasonable values! Don’t just do anything to tune a model.
8
FACILITY DESCRIPTION
The Substitute_FACILITY Substitute_FACILITY (Figure 1) is brief description of the facility. Provide a few sentences on building(s) dimensions, occupancy, and typical use. Reference floor plan. —Figure 2. A summary of Substitute_BUILDING is presented in Table 3.
<Insert aerial shot of the armory>
Figure 1: Aerial imagery of Substitute_FACILTY, Substitute_LOCATION(RU GeoLab 2015)
<Insert floor plan>
Figure 2: Floor plan of Substitute_BUILDING
Table 3: Summary of Building Information.
Construction Date Substitute_YEAR
Building Size Substitute_SQUAREFOOTAGE
Occupancy
Energy Sources Electricity, oil, natural gas, propane,
renewables
Water Sources Municipal, well
Building Material/Construction
Number of Occupants Daily, drill
ISR Rating GREEN AMBER RED
HVAC – Major Components Furnace, Space heaters and window A/C
units?
Commented [A24]: Include pictures. Remember that this is the only description of the building in the whole report, so it should be complete. Someone who has never been to the armory should be able to understand what the building is like from your description. Commented [A25]: EX: The X Armory (Figure 1) is one of many Readiness Centers throughout the state utilized and maintained by the NJARNG and NJDMAVA.
Commented [A26]: EX: The X Armory is # square feet and accompanied by a Field Maintenance Shop (FMS) of # square feet. The armory is typically occupied by # people Monday through Friday. There are # offices used by XX and a maintenance office used by the armorer, as shown in the floor plan in Figure 2. *Whatever other spaces are used should also be described. * In addition to the regular office use, the armory is used for drills one weekend per month or to fulfill other duties of the National Guard. A unit of approximately # attends drill. *Also indicate if the building’s are rented out at all, or used regularly by someone else.*
Commented [A27]: The aerial view should include site boundaries and meter locations. A PDF in the resources folder contains aerial views of all federally-owned NJDMAVA buildings, which includes site boundaries. Meter locations need to be added. INCLUDE A NORTH ARROW.
Commented [A28]: If more than one floor, include floor plans as Figure 2a, 2b, etc.
9
ISR Analysis
The Installation Status Report (ISR), a web-based integrated executive information system, was developed by the Department of the Army in 1994 as a method to assess installation level conditions and performance against Army-wide standards. ISR supports funding decisions, including those relating to Sustainment, Restoration and Modernization (SRM)
and ARNG Military Construction (MILCON). Some ISR-I (Infrastructure) information pertaining to energy was collected during the audit to support reporting. The components of ISR evaluated in this report include Site & Grounds, Sustainment, Building Exterior, Bathrooms/Shower Rooms, Heating, Ventilation, & Air Conditioning, and Lightning. The overall ISR rating for a facility is determined by summing the values of each category. The completed ISR worksheet used is attached as Appendix E. The substitute_FACILITY received an overall rating of GREEN/AMBER/RED.Each component is described in detail in the following sections.
Site & Grounds
Sustainment
Building Exterior
Bathrooms/Shower Rooms
Heating, Ventilation & Air Conditioning (HVAC)
Lighting
Guiding Principles Compliance
The U.S. Department of Energy Federal Energy Management Program (FEMP) created a Guiding Principles Checklist as a voluntary tool for evaluating and tracking a building’s progress towards meeting the evaluation criteria defined in the GP Compliance Documentation. The Substitute_FACILITY’s progress towards meeting the evaluation criteria of the Guiding Principles can be found in Figure 3. Substitute_XX out of 18 metrics have been achieved at the time of the audit.
The six Guiding Principles that apply to both existing buildings and new construction or modernization are: 1) employ integrated design; 2) optimize energy performance; 3) protect and conserve water; 4) enhance indoor environmental quality; 5) reduce environmental impact of materials; and 6) assess and consider climate change risks.
<Complete GP Worksheet and make a pie chart of metrics achieved>
Figure 3: Current conformance with Guiding Principles – Substitute_FACILITY
Commented [A30]: No boiler plate for these sections because this can vary so widely. Make sure to describe the component in as much detail as possible. Limit these sections to just what the facility is currently like, including the ISR rating, but be as comprehensive as possible. Don’t discuss potential improvements or anything here,e.g., lighting should state the types of lights, but shouldn’t suggest replacement with LEDs. Save that for the Conservation Measures sections. Commented [A31]: This section of the report is completed by going through and filling out the Guiding Principles checklist, which can be found in an excel file in the Google Drive. Once your facility has been assessed, create a pie chart showing the breakdown of your choices for each of the 18 metrics.
10
ENERGY AND WATER PROFILE
The Energy and Water Profile compiles and presents data from the utility bills collected within the Energy Solve UBAR system for Substitute_FACILITY. The UBAR system allows for the user to view basic information for the facility, utility vendor information, and the billing history of the facility as seen through images of the bills that have been paid for each utility used. Information for the energy consumption of the facility can be analyzed and displayed with graphs and charts. Listed below is the utility vendor information for Substitute_FACILITY.
Electric Utility Provider: Utility Company
Meter Number: Meter #
Account Number: Account #
Location of the meter: Outside, Mechanical Room, etc
Gas Utility Provider: Utility Company
Meter Number: Meter #
Account Number: Account #
Location of the meter:
Fuel Oil Provider: Utility Company
Meter Number: Meter #
Account Number: Account #
Location of the meter:
Water Utility Provider: Utility Company
Meter Number: Meter #
Account Number: Account #
Location of the meter:
Electricity Consumption
<InsertBar graph of electric bills by month>
Figure 4: Monthly electricity consumption in kWh
Natural Gas Consumption
<Insert bar graph of gas/oil per month>
Figure 5: Monthly natural gas consumption in therms
Commented [A33]: This information can be found in Portfolio Manager and/or UBAR. Talk to the graduate student if you don't have access to these.
Commented [A34]: Reference the aerial image of the site you put in the Facility Description section and mark the meter locations on it. Meters are usually located outside the building or inside in a mechanical room.
Commented [A35]: Repeat for additional buildings/meters
Also indicate if distributor or supplier
Commented [A36]: Discuss/describe each graph. For electricity graph, paragraph should include baseline avg. monthly consumption
Commented [A37]: Or Fuel Oil
11
Water Consumption
<Insert bar graph of water consumption per month or quarter>
Figure 6: Quarterly water consumption in thousand gallons
Sustainability Analysis – Greenhouse Gas Emissions
Tables 4 and 5 show the cost of energy and water, equivalent CO2 emission of energy,
amount of energy consumed and the annual CO2 emissions at substitute_FACILTYbased
on data collected from the utility bills.
Energy is measured in a variety of units. For example, electricity is typically sold in units of kWh, while natural gas is typically sold in therms. To compare different forms of energy, they must be converted to a common unit of measure. Conversion to BTU (BTU) is standard practice in energy management. A BTU is the amount of heat necessary to raise one pound of water by 1 Fahrenheit degree. CO2e is the equivalent amount of CO2 from a
specific energy source.
Table 4: Unit cost and CO2e emissions of energy consumed
Energy Type Units Cost/Unit CO2e /Unit Heat Content
(BTU/unit) Electricity kWh $substitute_UNI
T COST* Natural Gas therms $
substitute_UNIT COST** Water gallons $
substitute_UNIT COST***
-- --
*Average unit cost/kWh obtained from substitute_YEAR(S) utility bills. **Average unit cost/therm obtained from substitute_YEAR(S) utility bills. *** Average unit cost/gallon obtained from substitute_YEAR(S) utility bills.
Table 5: Amount of utility consumed and annual CO2 emissions at Substitute_FACILITY
in substitute_YEAR(S)
Fuel Source Annual Consumption
(variable units) Annual Energy Consumption, MBTU
Equivalent metric tons of CO2
Annual Cost*
Electricity # substitute_kWh $ Natural Gas # substitute_therms $ Water # substitute_gallons -- --
*Average annual cost obtained from bills. NOT calculated using average unit prices from Table 4.
Figures 7, 8, and 9 depict energy consumption, energy cost, and greenhouse gas emissions by energy type for substitute_YEAR(S) based on data collected from the utility bills.
Discuss!
Commented [A39]: Check the Master Water Spreadsheet in the Resource Folder. If your building isn't in there, talk to Samantha Valentine. If water consumption is not tracked for your building, state so here.
Commented [A40]: For each of these sections, 1: State total annual cost and energy/water consumed, 2: use intensity (EUI, WUI, etc) and 3: discuss anything odd about the data, e.g., if June has excessive energy consumption, explain why (billing issue, warmer/colder than normal, etc)
Commented [A41]: This should include both utility and 3rd party costs.
Commented [A42]: We should reference a document that keeps all the conversions and emissions in one place, with appropriate sourcing.
Commented [A43]: Add another row for kW consumption in this table and the next table if kW charges are a significant portion of the total electricity cost.
Commented [A44]: Obviously if they use fuel oil, switch this to fuel oil and correct the footnote
Commented [A45]: There are some estimates for CO2 associated with Municipal water. Should we include this?
Commented [A46]: ACTUAL cost from bills, not based on cost per unit in previous table. Use this as a check to make sure your $/unit costs are in the correct range.
Commented [A47]: Again, if fuel oil fix the table
Commented [A48]: We should think carefully about how we want to figure out cost. Historically, we have smushed energy and demand costs together and then divided by the bill to get average $/kWh. This needs to be codified in a document.
12 <insert Pie chart of energy use per source (electric, gas, etc.) in BTUs or BTU
equivalent>
Figure 7: Annual energy consumption breakdown by energy type, substitute_YEAR(s)
<Pie chart of energy use per source by cost>
Figure 8: Annual energy cost breakdown by energy type, substitute_YEAR (s)
13
MODELS
[Discuss eQUEST and LPM models. Include major assumption made and what was neglected from the models, if anything. For eQUEST, discuss modification made to the model to make it accurate, like infiltration calculations and altered temperature settings.]
Model Accuracy
- Compare calculated energy usage for a year to bills (compare LPM to bills and eQUEST to bills separately. Do NOT compare LPM to eQUEST. Comparing models to each other is comparing 2 sets of experimental data to find out how accurate each is to the theoretical calculated value .)
-Discuss any assumptions
- Identify potential and known sources of error ( info you can't or didn't collect)
Commented [A50]: Your goal is less than 20% error. DO NOT TWEAK YOUR MODEL just to fit this range. You can make reasonable changes, but don't go overboard. It is better to have a less accurate model and know/state the causes of error than to have a more accurate model where you don't know what is causing the inaccuracies.
14
SIGNIFICANT ENERGY CONSUMERS
[Identify all of the significant energy consumers in the armory using pie charts to show categories of consumption from LPM (lighting and applicances) and eQuest (HVAC). Do AFTER LPM and eQuest models are properly tuned.. Have separate graphs for consumption from whole building, lights, appliances and HVAC. Identify main consumers from these charts]
<Insert pie chart with breakdown of lighting, appliances, and HVAC>
Figure 10: Distribution of electricity consumption at Substitute_FACILITY from LPM
Note that the Appliance and Lighting portions of Figure 10 represent annual electric energy consumption calculated using the LPM. The HVAC portion of the graph represents the difference between the actual total annual energy consumption obtained from the utility bills, and the baseline LPM-calculated Lighting and Appliance usage. This method ensures the most accurate HVAC usage approximation.
Appliances
<Insert pie chart of appliances>
Figure 11: Largest electricity consuming appliances at Substitute_FACILTY.
Lighting
<Insert pie chart of lighting>
Figure 12: Distribution of electricity consumption by bulb type at Substitute_FACILTY
HVAC
<Insert eQUEST output>
Figure 13: eQUEST model output
Commented [A52]: WE NEED TO WORK ON THIS!
Commented [A53]: Discuss the (%) contribution of the appliances towards the Armory’s total energy consumption
Commented [A54]: Discuss the (%) contribution of the lighting towards the Armory’s total energy consumption
15
ENERGY CONSERVATION MEASURES
- Look into the implementation of all possible ECMs, WCMs, and REMs.
- Calculate the replacement of fluorescent bulbs with LEDs. Include this measure in Excel spreadsheet even if it isn’t a feasible recommendation to include in the report.
- Write the commissioning section. State issues in the building that require an expert/ consultant to look at and the benefit of having DMAVA hire someone for that purpose. -DMAVA does not pay taxes, so don't suggest they take advantage of tax credits
Table 6: Financial Summary of Substitute_MEASURE Substitute_MEASURE
ENERGY SAVINGS SUMMARY
Parts Installation Cost $1,596
Labor Installation Cost $80
Total Installation Cost $1,676
Annual Energy Savings 9000 kWh
Annual Cost Savings $1,073
Estimated Lifetime 20
Payback 1.6
Lifetime ROI 1179.9%
Lifetime Savings $19,775
Internal Rate of Return (IRR) 2%
Net Present Value (NPV) $15,942
Savings to Investment Ratio 12.8
Commented [A56]: Look at older reports. If they evaluated the same measure, you can use the same text (just make it fit the facility in report and edit)
Commented [A57]: Include this table for each and every strategy. Update the name for each measure being looked at. ECM, WCM, REM
16
WATER CONSERVATION MEASURES
Table 7: Financial Summary of Substitute_MEASURE Substitute_MEASURE
WATER SAVINGS SUMMARY
Parts Installation Cost $1,596
Labor Installation Cost $80
Total Installation Cost $1,676
Annual Energy Savings 9000 kWh
Annual Cost Savings $1,073
Estimated Lifetime 20
Payback 1.6
Lifetime ROI 1179.9%
Lifetime Savings $19,775
Internal Rate of Return (IRR) 2%
Net Present Value (NPV) $15,942
Savings to Investment Ratio 12.8
Commented [A58]: Conduct a cost analysis on water conservation measures that could be implemented at your facility and discuss your findings.
Commented [A59]: Include this table for each and every strategy. Update the name for each measure being looked at. ECM, WCM, REM
17
RENEWABLE ENERGY MEASURES
Table 8: Financial Summary of Substitute_MEASURE Substitute_MEASURE
RENEWABLE ENERGY SUMMARY
Parts Installation Cost $1,596
Labor Installation Cost $80
Total Installation Cost $1,676
Annual Energy Savings 9000 kWh
Annual Cost Savings $1,073
Estimated Lifetime 20
Payback 1.6
Lifetime ROI 1179.9%
Lifetime Savings $19,775
Internal Rate of Return (IRR) 2%
Net Present Value (NPV) $15,942
Savings to Investment Ratio 12.8
Commented [A60]: Conduct a cost analysis on renewable energy measures that could be
implemented at your facility and discuss your findings.
Commented [A61]: Include this table for each and every strategy. Update the name for each measure being looked at. ECM, WCM, REM
18
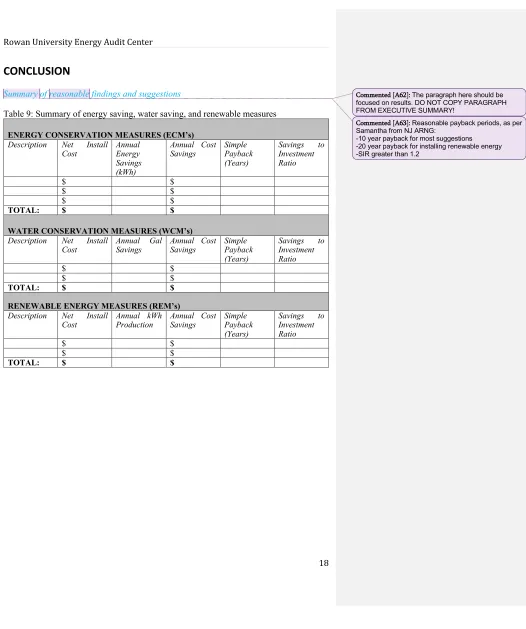
CONCLUSION
Summary of reasonable findings and suggestions
Table 9: Summary of energy saving, water saving, and renewable measures
ENERGY CONSERVATION MEASURES (ECM’s) Description Net Install
Cost Annual Energy Savings (kWh)
Annual Cost
Savings Simple Payback (Years)
Savings to Investment Ratio
$ $
$ $
$ $
TOTAL: $ $
WATER CONSERVATION MEASURES (WCM’s) Description Net Install
Cost Annual Gal Savings Annual Cost Savings Simple Payback (Years)
Savings to Investment Ratio
$ $
$ $
TOTAL: $ $
RENEWABLE ENERGY MEASURES (REM’s) Description Net Install
Cost Annual kWh Production Annual Cost Savings Simple Payback (Years)
Savings to Investment Ratio
$ $
$ $
TOTAL: $ $
Commented [A62]: The paragraph here should be focused on results. DO NOT COPY PARAGRAPH FROM EXECUTIVE SUMMARY!
Commented [A63]: Reasonable payback periods, as per Samantha from NJ ARNG:
19
REFERENCES
Cite your references here. Group them into sections, which could include lighting, appliances, renewable energy, etc.
Examples:
1. Refrigerator.
http://products.geappliances.com/ApplProducts/Dispatcher?REQUEST=SpecPage&Sku= GIE18CTHWW. Accessed 8-20-15.
2. Solar Water Heater. www.energystar.gov/products/certified-products/detail/water-heater-solar Accessed 4-2-15.
20
APPENDIX A: LIGHTING SCHEDULE
Locati on Fixtu re Type Bulb Type # of Fixtu res Bulb s per Fixtu re Total Bulb s kWh/ year Light Intens ity Bright ness (Lux) Ballas t Type A Wing Female Bathro om Surfa ce moun t 4 ft.
T8 3 4 12 720
A wing Hallwa y Surfa ce Mou nt 4 ft.
T5 6 3 18
A Wing Male Bathro om
4 ft.
T8 3 4 12 730
A103 4 ft. T5 2 2 4 300
Commented [A65]: Schedule = Inventory. This should be a summary of the lights in the building. Your LPM should be submitted with this report, as a single Excel file, with a separate tab for Lights, Appliances, Water, and Bills.
21
APPENDIX B: PLUG LOAD SCHEDULE
Location Type Make/Model Wattage Quantity kWh/year
Commented [A67]: Schedule = Inventory. This should be a summary of the appliances in the building, from your LPM Excel spreadsheet.
Commented [A68]: Show 2 different tables, one without HVAC load and one with HVAC only
22
APPENDIX C: HVAC – COMPONENTS AND eQUEST INPUTS &
OUTPUTS
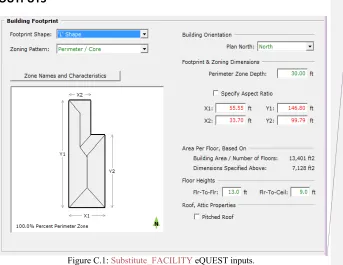
Figure C.1: Substitute_FACILITY eQUEST inputs.
Windows and Doors: There were two exterior doors. The door that faced south was the main entrance, 7x6 feet of Single Clear ¼ in (1001). The second exterior door was a solid steel door measuring 7x3 feet. The windows were all 3x3 feet, Double Clear ¼ in ½ in Air (2004). They covered 10% of the floor-to-ceiling on all sides of the building. There were no shade overhangs or skylights.
Schedule: The armory typically opens at 8:30 am and closed at 5:00 pm. It is closed on weekends, holidays and one Friday each month. The armory also hosts drills that can have approximately 100 soldiers in the facility for one weekend each month.
Thermostats: The armory has two non-programmable thermostats. The first thermostat controls a private, mostly unused office, and was set at 73° F. The second thermostat controls the temperature for the rest of the building approximately 95% of the available space. This thermostat was set at 67° F.
HVAC System: The armory uses window A/C units for cooling and a furnace for heating. The system type is a packaged multizone, and the return air path is ducted. Typical cooling units were approximately 6500 Btu/hr, with an EER of 11.
Commented [A70]: Replace with an image from your facility’s eQUEST input, making sure the image is the same width as your text.
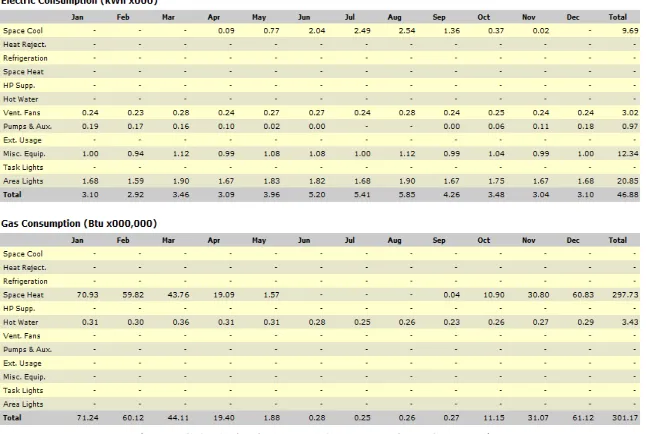
23 Simulation Outputs:
The charts found in the report were generated using the data produced by eQUEST, which can be found below:
24
APPENDIX D: WATER FIXTURE SCHEDULE
Location Type Make/Model CFM of Flow Quantity
A Wing Female
Bathroom Toilet A Wing Female
Bathroom Sink
A Wing Hallway Water fountain Urinals
Showers
25
APPENDIX E: ISR ANALYSIS
GREEN AMBER RED
Site & Grounds
- Sustainability 6 6 6
Totals
Sustainment
- Smart Meter (Electricity) 6 6 6
- Smart Meter (Natural Gas) 6 6 6
- Smart Meter (Steam) 6 6 6
- Smart Meter (Water) 6 6 6
- Utilizing Alternative Water Source (Grey) 4 4 4
Totals
Building Exterior - Roof
- Roof 10 10 10
Totals
Building Exterior - Walls
- Building Envelope 10 10 10
Totals
Building Exterior - Windows
- Windows 10 10 10
Totals
Building Exterior - Doors
- Exterior Doors 10 10 10
- Exterior Door Hardware 6 6 6
Totals
Bathroom / Shower Rooms
- Water Efficiency 6 6 6
Totals
Heating, Ventilation, & Air Conditioning
- Heating 10 10 10
- Water Heating 10 10 10
- Cooling 10 10 10
- Controls 6 6 6
- HVAC Distribution System 6 6 6
- Radiators 4 4 4
Totals
Lighting
- Interior Admin 10 10 10
- Exterior POV - Lighting 10 10 10
- Exterior Military Parking - Lighting 10 10 10
- Interior Assembly Area 6 6 6
- Grounds - Lighting 6 6 6
- Interior Storage 4 4 4
Totals
Grand Totals:
Commented [A73]: Use "ISR Analysis Directions Guide" to fill this out. The sections in "Facility Description" should reflect these ratings.
26
APPENDIX F: ENERGY STAR PORTFOLIO MANAGER ANALYSIS
Printout from Portfolio Manager Commented [A75]: Directions:
●Log into Portfolio Manager. ●Find the building, and update utility info.
●Click on "Reporting," the 4th tab from the left at the top, directly under the "Portfolio Manager" logo.
●Click on the "Progress & Goals Report" link, under the title ENERGY STAR Performance Documents, on the right side of the page.
●Answer the 3 questions: 1) Progress and Goals Report. 2) the building/property name. 3) Current year. Then click the "Generate & Download Report(s)" button at the bottom of the page.
27
APPENDIX G: DEGREE DAYS VERSUS GAS USE
Heating degree days (HDD) are valuable in evaluating the energy efficiency of a building. The heating degree days for one day is the difference between a specific reference temperature and the current temperature. The specific reference temperature is chosen based on the desired temperature in the building. A common standard reference temperature is 65°F. A good way of understanding how heating degree days work is through an example. If the daily average outside temperature is 40°F, the number of heating degree-days for that day is 25 HDD (65°F-40°F). A running tally of HDD is kept for an entire heating season to get the total number of HDD for an entire heating season. The significance of heating degree days is that they can be used to estimate the heat loss through the building envelope.
Figure G.1 shows monthly heating degree days plotted against monthly gas consumption for YEAR(s). This time period was selected because that was the maximum amount of data accessible from a nearby data collection station from DegreeDays.net. The gas consumption versus number of heating degree days tends to follow a linear relationship. Plotting a linear best-fit line, the slope of this line represents the heat loss per degree day. The heat loss through the building envelope, called UA infiltration of a building, can be calculated by dividing the slope by 24. This UA infiltration value can be used to compare building heating efficiencies because this value accounts for differences in building sizes. The UA is the sum of heat loss due to heat transfer through the roof, walls, and floor. The infiltration is the heat transfer due to leaks, cracked windows, open doors, and open windows. The heat loss of the building is given by Equation G.1, where (U) represents the overall heat transmission coefficient of the building, (A) represents the exposed area of the building, and (∆T) is the difference between the outside temperature and the inside temperature.
𝑄̇ = 𝑈 ∗ 𝐴 ∗ ∆𝑇 (Equation G.1)
The 𝑄̇ of a building is the rate of heat loss of a particular building. The total annual heat loss can be calculated by integrating this equation with respect to time. The product of the change in temperature (∆𝑇) and change in time is the number of heating degree days. So, the annual heat loss of the building can be calculated by multiplying the UA infiltration by the number of heating degree days per heating season. This can be seen in Table G.2. When the UA value was determined using this data, it was compared to the UA value calculated using the assumptions from EQUEST. The UA value from this model (## therms/F*hour) yielded a ##% error (## therms/F*hour).
Commented [A76]: Reference this when you are talking about HVAC. Comparing yearly heat loss (scaled for building size) to other buildings will let you compare how efficient your building is to those other buildings. (Efficiency of heating system and building envelope. No easy way to separate the two, unless you calculate what the heat loss through the envelope should be, with minor/negligible infiltration, then calculate infiltration, as in "Degree Days Versus Gas Use.xls" Fall 2012, referencing Cherry Hill Armory)
Commented [A77]: To Do:
●Graph monthly heating degree days versus gas use. HDD on X axis, gas on Y axis.
●Add a linear best fit line, with equation and R2 value. ●Record slope and y intercept of best-fit linear line in the table below.
●Fill out the table using the calculations provided in the degree day Excel spreadsheet. If you can't access the spreadsheet, the basic equations are below:
§UA + Infiltration = slope/24. U is the thermal property of material, A is area. Infiltration is the air/heat loss through gaps in the building envelope.
§Yearly heat loss = slope * Heating Degree Days per year. This should be compared to total gas consumption from the same time period as for the degree days.
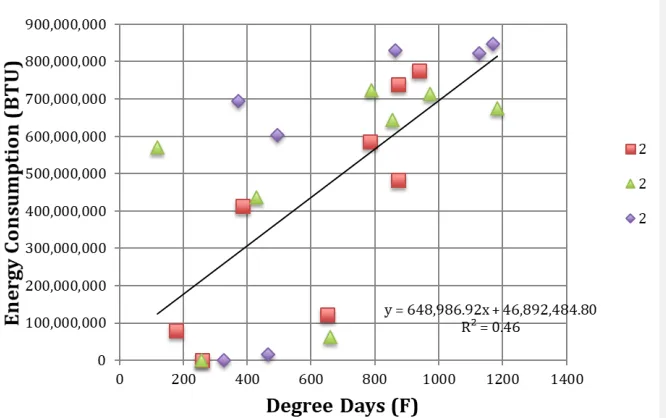
28 Figure F.1. Heating degree days versus gas consumption
Table F.2.
Slope(m) 648,986 BTU/(F*day) Y-Intercept 46,892,484 Qgen (BTU/Month)
Heating Degree Days/year 5,104 Degree Days (F from 70) UA + Infiltration 27,041 BTU/(F*hour)
Yearly Heat Loss 3,312,424,544 BTU Annual Gas Consumption 3,638,249,817 BTU
Percent Error 9% %
Commented [A79]: Get monthly HDD from degreedays.net or weatherunderground.com with a temperature of 70 F.
29
APPENDIX H: OCCUPANT SURVEYS
Summarize the responses received for each survey question. The survey is available as a one page document in the "New Student Resources" folder, "Occupant Survey for Energy Audits.doc".
30
APPENDIX I: MONITORING DEVICE DATA
For example:
Table I.1. shows the consumption data collected from the Kill-A-Watt meters for --- Armory during the second site visit. Consumption values were recorded for the time between --- and ---, a time period of --- number of days.
See an example below.
Table I.1: Kill-A-Watt Data
Appliance/Location Refrigerator
(Kitchen) Printer (Supply Room) Refrigerator (FMS) Vending Machine (FMS)
Voltage 121.5V 122.3V 121.8V 121.5V
Amperage 0A (off)
0.18 (on) 1.15-5.15A (fluctuation) 6.55A 3.12A
Consumption 1.68kWh 3.71kWh N/A N/A
Power 0W (off)
11.8W (on) 4.46-481W (fluctuation) 486W 245W
Commented [A83]: This appendix is only necessary if you collected data with Kill-A-Watt meters. Talk with one of the professors or the grad student prior to your site visit to determine if there are any appliances that you could collect data for.