Copyright © The Author(s). All Rights Reserved. Published by American Research Institute for Policy Development DOI: 10.15640/jea.v6n1a10 URL: https://doi.org/10.15640/jea.v6n1a10
Switching and Intelligent Management Systems for Battery Recharging in Electric
Vehicles
Enrique Miguel Tébar-Martínez
1,
Daniel Boix-Cano
2,
Alfonso García-García
3José María López-Martínez
4,
& Juan Carlos Brotons-Sánchez
5Abstract
This article starts from a model to recharge the batteries of an Electric Vehicle from a small-scale photovoltaic solar plant whereas the energy injected into the batteries is obtained at the instant production itself, with no need of storage in between. From here on, the paper commences by offering precise information on the devices that enable both switching and intelligent management of the different loads that are present in our system, where the Electric Vehicle is undoubtedly one of the most important but not the only one to consider and manage. Therefore, our goal will be to tackle how to manage the vehicle batteries from the photovoltaic inverter, how to manage the switching of both sources and loads with an Industrial Programmable Automaton (OMRON CP1-E), how it affects the network and how it should be adapted for a big-scale scenario, from the complete system dimensioning. For our purposes, a study of typical loads (including the Electric Vehicle), several solutions to implement a prioritisation of loads (with a review of several devices working under priority algorithms) and a real average of annual consumptions with a system projection by adding an Electric Vehicle with daily recharge and different charging features and patterns, will be shown.
Keywords: Electric Vehicle; Battery Charging; Priority Loads; Photovoltaic Window; Sensors and Actuators;
Automaton
1. Introduction
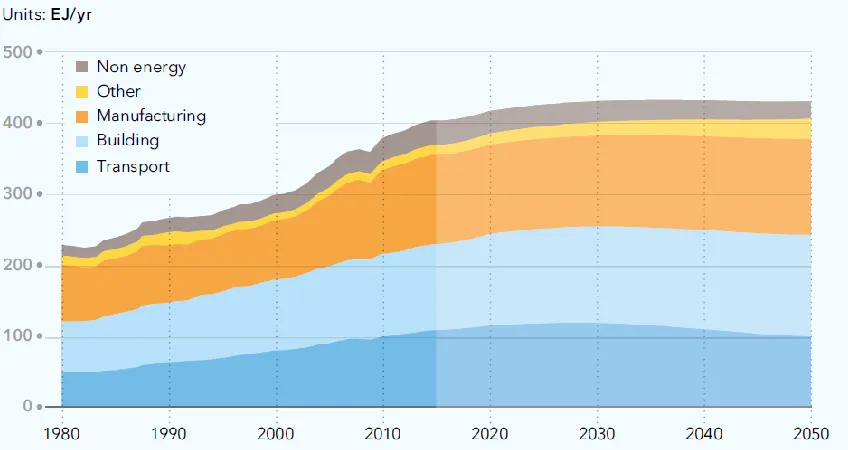
Just as a global indicator of how the electrification trend of the Road Transport sector would affect the global energy consumption, we can take its impact inside the final structure as a starting point. The report ‘First Energy Transition Outlook 2017, a global and regional forecast of the energy transition to 2050’ which forecasts global energy demand and supply through to 2050 and published by DNV GL [1] shows how today, the world’s energy is used 27% in the transport sector, 30% in the building sector and 31% in manufacturing.
1Doctor Telecommunication Engineer - University of Alicante. Email: [email protected]
2Electrical Engineer - Master's Degree in Solar Energy and Renewables - Miguel Hernández University.
3Doctor in Physics - Building Technologies Dpt. – Building Engineering School - Polytechnic University of Madrid.
4Doctor Industrial Engineer - Director of the University Institute of Automobile Research (INSIA) and the Alternative
Propulsion Systems Unit - Polytechnic University of Madrid. [email protected]
Figure 1. World Final Energy Demand by Sector. Source: ‘First Energy Transition Outlook, a global and
regional forecast of the energy transition to 2050’, DNV GL.
This means that, if we want the Road Transport sector to become progressively electric, the grids must be ready to increase their capacity to absorb this consumption growth. However, it is also true that the energy efficiency of an Electric Vehicle is higher than one from its fossil-based equivalent, given that on average, a gasoil-based ICEV (Consumption: 6 litres/100 km), assuming a calorific value of 10.8 kWh/l for gasoil, can achieve a 0.65 kWh/km rate, whilst for an equivalent BEV is usually around 0.15 kWh/km. We are not considering the energy needed to obtain the fuel or the electricity to feed the vehicle in any case, given that this amount is unknown.
Moreover, the intermediary steps between energy production and consumption are much fewer for an Electric Vehicle as well. And the most efficient case in terms of less intermediary steps is without a doubt the electrical self-consumption based on renewables with distributed generation, where energy production and battery charging occur exactly at the same place. So, for distributed generation, losses because of intermediary steps are even lower, and the cost to obtain the electricity is also known since power is not coming from unknown sources, as it happens when taking the electricity from the mains.
Besides, if we moved to a scene composed by a small-scale photovoltaic solar plant (e.g. for a single family home), in self-consumption regime with grid exchange, the incorporation of a Battery Electric Vehicle simply implies an addition of a new electrical appliance, with high consumption needs and special use. In short, it is another appliance.
The authors have recently described a model to recharge the batteries of an Electric Vehicle from a small-scale photovoltaic solar plant whereas the energy injected into the batteries is obtained at the instant production itself, with no storage need in between.
For the PV plant sizing, the annual net metering balance has been considered to match generation and demand for over 365 days, so at the end, a 100% renewable-based model is applied.[2]The objective was twofold: on the one hand, to apply a true zero emissions system for the energy supply of the EV, impossible to get from nightly charge or other scenarios. On the other hand, to project a distributed generation system that makes possible the so-called ‘democratisation of production’ and the cost reduction for the user. Our purpose of modelling a scene as close as a zero emissions system comes from a very clear starting point: The advance of electric mobility must make its way jointly with the renewable energies. If one of the main reasons to justify the electrification of transport is to reduce the emission of polluting gases into the atmosphere, this ‘go-electric’ is useless if the sources that make up the energy share to produce the electricity that will recharge the batteries of the Electric Vehicle still come from fossil fuels.
As described in [3], the system that supplies electricity to users, what we all know as Electric Power Network, is highly complex, but a balance between generation and demand must be guaranteed at all times, so the power generated in every moment must be exactly balanced out by loads. Hence, keeping a close watch on this balance means controlling several parameters. The most difficult challenge is that both the network frequency and the voltage level remain stable while taking into account the different situations that will be constantly happening and interfering with the balance between generation and demand.
Likewise, the network working frequency (Usually 50 or 60 Hz, depending on the country) and its unchanged maintenance are closely connected with the balance between generation and demand.This occurs because in permanent regime all the Electrical Network generators operate in a synchronised way to the network frequency. However, if the generation increases, the electric frequency also increases and if demand increases, the electric frequency decreases. This phenomenon is due to the basic principles of production, processing and energy consumption in a rotating turbines system, as described in [4]. Thus, if we compare the chart lines shown at [5] we can check how Scheduled Demand (broken line, in red colour), follows Real Demand (continuous line, in yellow colour) as much as possible.
Figure 2. Example of Scheduled and Real demands. Source: Red Eléctrica de España (REE), Information of System Operator (e-sios).
Besides, progressive growing of renewable energy sources and distributed generation imply larger variations to ensure the load-generation balance, given that the higher the volume renewables represent inside the energy share ([6], Figure 2.3.1 shows how in 2014 Renewables are the second source with 25.4% of the total primary energy production of the European Union, just behind Nuclear), the higher that variability and uncertainty will also increase, as widely explained in [7].
Furthermore, the increasing penetration of renewable energy-based generators can affect the Power Quality (frequency and voltage variations, voltage drop, power factor reduction and harmonic distortion) in distribution systems under varying weather and loading conditions, as shown in [8].
This is why, in order to respond to increasing variations both in generation and demand, it is imperative for the EPN to rely on complex frequency control mechanisms to maintain this necessary load-generation balance, as well as the reference frequency of the system (Network Frequency), the energy exchange commitments among neighbouring areas and the safeguard of a sufficient reserve of energy. All this, in addition, must be organised within the current regulatory framework that corresponds to a competitive energy market.
Finally, and as explained in [9], EVs can significantly reduce the amount of excess renewable energy produced in an electric system. Therefore, the EV can be also a very good ally in order to keep the balance between generation and demand, whenever we can postpone the recharge inside a time frame that can be in turn programmed depending on our needs and preferences.
3. Study of Typical Loads, Including Electric Vehicle
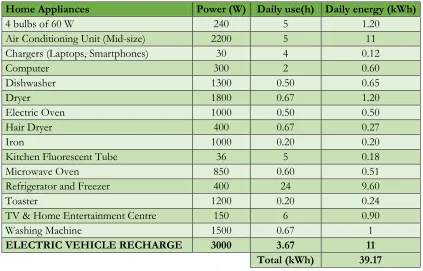
Table 1 shows the most common loads we can find in the residential area and their approximate power needs, daily conditions of use and, therefore, the total energy consumed throughout the day. As a last charge, we have included the total recharge of the batteries of a mid-range electric car such as the Renault Fluence Zero Emissions [10]. The choice of this EV is twofold: On one hand because it is a mid-range electric car, so extrapolating results to other vehicles of superior and inferior performance is easier. On the other hand because this vehicle is ready for battery swapping thanks to ‘QuickDrop’ robotised system, an interesting feature in case that we want to break the barrier of simultaneity between PV production and vehicle use, as explained afterwards:
Table 1: Inventory of typical electrical consumption for a single family with an Electric Vehicle.
Home Appliances Power (W) Daily use(h) Daily energy (kWh)
4 bulbs of 60 W 240 5 1.20
Air Conditioning Unit (Mid-size) 2200 5 11
Chargers (Laptops, Smartphones) 30 4 0.12
Computer 300 2 0.60
Dishwasher 1300 0.50 0.65
Dryer 1800 0.67 1.20
Electric Oven 1000 0.50 0.50
Hair Dryer 400 0.67 0.27
Iron 1000 0.20 0.20
Kitchen Fluorescent Tube 36 5 0.18
Microwave Oven 850 0.60 0.51
Refrigerator and Freezer 400 24 9.60
Toaster 1200 0.20 0.24
TV & Home Entertainment Centre 150 6 0.90
Washing Machine 1500 0.67 1
ELECTRIC VEHICLE RECHARGE 3000 3.67 11
Total (kWh) 39.17
We have chosen a single-family housing with photovoltaic self-consumption (3 kW PV plant) and grid exchange since it can be a good starting point for more complex scenes like a condominium, an industrial building or a mall (always provided with a PV plant in self-consumption and grid exchange modality) among others. In a nutshell, it is about considering more parameters and higher variability and uncertainty for production and demand.
For our model, whether the battery is extracted from the vehicle or not while being charged, is not relevant: We are just considering that the EV recharge must take place inside the ‘PV Window’ (said in another way, during the times when solar modules are producing electricity).
Our next question is: What happens to the rest of the loads regarding ‘PV Window’? It will depend on their needs. Some appliances such as the Refrigerator and Freezer need electricity 24/7, so these ones will always rely on the grid, at least for nightly feed. Other ones, like the Washing Machine, Dryer and Dishwasher, are easily programmable to be used inside the ‘PV Window’. The other appliances are just switched on when they are needed, so these ones will be used inside ‘PV Window’ or not, depending on their hours of use.
Therefore, as a consequence of the orders of magnitude between the energy consumption of the Electric Vehicle and other system loads, we can conclude that if we want to be as close as possible from a zero emissions scenario for the energy supply of the EV, we can design the system according to the needs of the vehicle, and the rest of the loads will be fed from either the photovoltaic system or the grid, based on the production and consumption levels, as we will see in the next section.
4. Prioritisation of Loads
Once our electrical needs are known, from both our inventory of appliances and our lifestyle needs, our goal should be to determine when the appliances should be fed. Firstly, we must use a PV inverter adapted for self-consumption and grid-exchange. The majority of the inverters available in the market include a built-in automatic breaker (typical switching time is 10 ms) that allows the internal by-pass of the electricity coming from the grid through the inverter when loads consumption is higher than PV production. Some inverter manufacturers, as Kostal, have gone one step further and have implemented a programmable sensor called Piko BA, which can be assembled inside a new generation inverter, allowing remote monitoring of self-consumption and grid exchange, and even to control how much power can be injected into the mains [11].
However, these inverters are not capable of determining which loads are priority to be fed from our PV modules, they just switch if necessary, depending on our total consumption. Hence, we must establish our priority criteria among our loads and from our sources or generators. Our generators, in priority order are firstly the PV plant and then the grid, in case that our utility rate does not include hourly discrimination. Otherwise, our generators in order of priority will be: PV plant, grid ‘valley rate’, grid ‘medium rate’ and finally grid ‘peak rate’, the one we should try to avoid if possible. Some studies show different algorithms for Power Management Algorithm for EV Charging based on PV, as the one shown in [12], considering distributed topology and by using a unique control strategy relying on DC link voltage sensing, which decides the direction of power flow. In turn, the one shown in [13], is based on achieving several ‘Vehicle-To-Grid’ services, such as voltage regulation, spinning reserve, load shifting, peak load shaving and load levelling, and a relation diagram for V2G types, V2G services, optimization objectives and constraints is presented. Not considering EVs, but inside a PV scenario as well, the authors of [14] have also developed a priority load control algorithm, by which a better energy management efficiency is provided by classifying loads into four general categories depending on their priority (convenient, essential, critical, and emergency). The main difference between that scenario and ours is that in [14], a stand-alone PV device is assumed whereas for our case we have considered from the beginning a battery-less system with grid exchange. However, since we want to guarantee a Zero Emission scenario for our battery charge, we can also focus on an energy management as efficient as possible to guarantee the clean energy supply for our EV.
The last parameter to have in mind is the EV battery as an energy provider to the rest of the system loads (short-time storage option), so we would have in fact a ‘Vehicle-to-Grid’ (V2G) or a Vehicle-to-Home (V2H) system, as widely explained in [13, 17, 18], and even a specific study for a PV parking lot playing a ‘smart grid’ role [19].Therefore, we could implement a V2G/V2H scenario under an assumption of tariff convenience to feed home appliances from EV batteries during ‘peak window’ and then to charge EV batteries from the grid during ‘valley window’ or ‘super valley window’, and also on the following day. Like this, and even in case that we are not charging our EV battery from the PV plant, we are actually making a net metering by which the same amount of green energy that was supposed to feed the EV battery is feeding the rest of the loads, and we are saving money.
5. Programming Based on OMRON’sCP1-E and CX-Programmer
Firstly, we need a Programmable Logic Controller (PLC) to implement our prioritisation algorithm. For our purposes, we have chosen OMRON’s CP1-E [20] Industrial Programmable Automaton, given that CP1-E counts with relay-diagram programming language CX-Programmer [21], a powerful and easy-interfaced software tool.
We have also chosen CP1-E because of its extended use and the great amount of compatible peripherals that are available in the market. CP1-E counts with 12 physical inputs (24V DC) for sensors connection, 8 physical outputs (24V DC) for actuators connection, 1 USB port to transfer the programme to the PLC, and 1 COM port to connect a system operation screen.
Figure3. OMRON’S CP1-E Industrial Programmable Automaton and relay-diagram programming language CX-Programmer.
As a starting point, we have assumed 3 loads we can manage, by adapting their use at different times during the day, in addition to the Electric Vehicle charger: Washing Machine, Dishwasher and Dryer. These are the ones we have considered for the example discussed below. For rural environments, we could also add water pumping or drip irrigation systems.
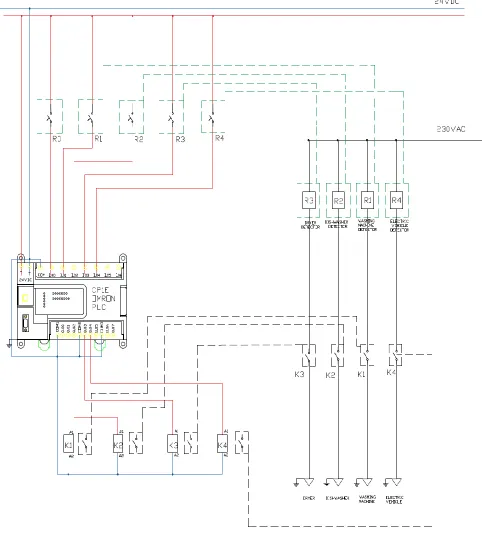
Figure 4. Internal connection diagram to determine if the PV production exceeds or is under the demand of the loads.
On the other hand the PLC will receive information through 24V continuous pulses generated by the power source and driven through 5 sensors; in our case, 1 comparator relay (e.g. Victron Transfer Switch ATS40V230 5kVA/10kVA [23]) through input I0.0 (Comparison between PV power and loads demand) and 4 current relays (e.g. Circutor WI [24]) through inputs I0.1 (Washing Machine), I0.2 (Dishwasher), I0.3 (Dryer) and I0.4 (EV Charge).The comparator relay will compare the voltage levels to determine if the PV production exceeds or is under the demand of the loads. In this last case, AC mains will be added on, as a reinforcement to feed the system needs. Next figure shows an internal connection diagram, where we can distinguish the terminals of the PV generator (yellow), the AC mains (blue) and the loads network (green). In red colour, the comparator relay that will be used to give the PLC the precise information (by means of the terminal voltage) about the adding of the AC mains contribution.
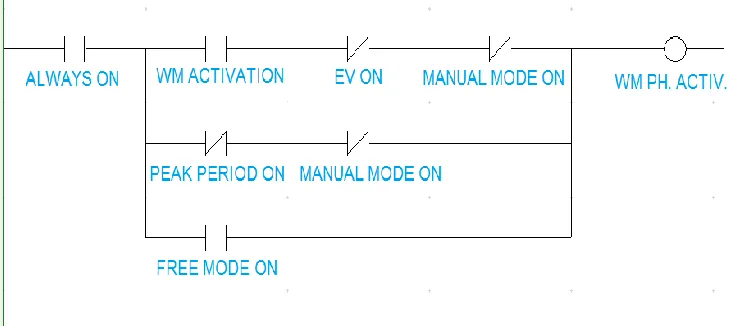
Figure. 5. Relay Diagram implemented with CX-Programmer for a load (Washing Machine) with several
operation modes.
‘FREE MODE ON’ is the manual contact to activate a load in permanent mode. Finally, ‘WM PH. ACTIV.’ (‘Washing Machine Physical Activation’) is a digital coil to activate Q100.01 address (corresponding to Washing Machine).
The hourly information to activate or deactivate the loads depending on whether the current time corresponds to ‘Peak’, ‘Medium’ or ‘Valley’ time intervals will not be obtained from an external clock, but by using an internal CP1-E’s instruction called ‘DT’ that establishes a comparison between the current time and a hourly range to activate or deactivate a digital coil.In order to prioritise loads we must take into account that the average EV’s consumption is high compared to the loads that we could control in a housing. Therefore, EV charging inside the photovoltaic window would imply that the other 3 loads should be deactivated, and they can be reactivated at the end of EV charging, preferably when we are inside the PV Window or the ‘Valley’ period. On the other hand, a Washing Machine, a Dishwasher or a Dryer should not be deactivated during their operating cycle, unlike the EV, whose batteries are supposed to be half-charged when EV’s user does not count with time enough to perform a full charge. For this reason, the priority for load charging inside the photovoltaic window is firstly EV with respect to the other 3 loads.
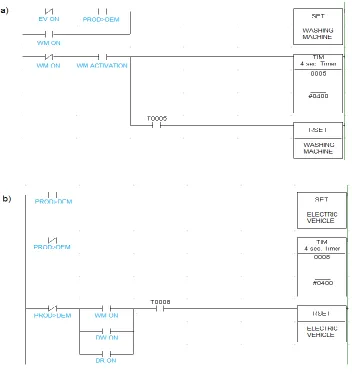
Figure 5 shows a Relay Diagram implemented with CX-Programmer, where several operating modes are considered, whilst Figures 6a and 6b show an automatic activation inside PV Window. Finally, Figure 7 shows the final schema of the CP1-E adapted for our purposes with both sensors and actuators.
Figure 6.Relay Diagram implemented with CX-Programmer to activate programmable loads (6a for the
(Production > Demand) is a digital contact that will be activated by means of the comparator Relay when PV Production is bigger than loads demand through input I0.4 ‘WM ON’, ‘DW ON’ and ‘DR ON’ are the ON/OFF state detectors for the Washing Machine (I0.1), the Dishwasher (I0.2) and the Dryer (I0.3) respectively. ‘T000X’, where X is a number between 0 and 9, is a timer instruction to delay the loads deactivation, so it cannot occur simultaneously.
Smart grids incorporating Renewables and EVs will increase enormously in the years to come. And the key points will be to determine suitable algorithms considering usual needs and behaviours in order to optimise consumption, making it as green as possible.
In Spain, country where the authors come from, there is even one Research Programme financed by Spanish Ministry of Science and Innovation called SIDER (Smart Inverter for Distributed Energy Resources), to promote the development of an inverter able to actively manage the interconnection interface with the network. In [25], an Intelligent Energy Device is developed to provide the inverter with the capability to analyse parameters, events, protections and communications.
One key factor to reach Smart Grids is undoubtedly the promotion the PV self-consumption, and for those EV users not counting with their own charging infrastructure, the role called ‘Charging Retailer’ to allow thirds’ EV charging by using Charging Retailer’s infrastructure.
Once that EV sector will get developed and Charging Retailers will operate normally, new charging points for EVs will appear and consequently, new counters and switching devices will be needed to determine how much power has been consumed by every EV fed by the retailer.
Battery recharging (for the EVs), and in general way, consumption (for the joint of appliances) based on distributed PV adds efficiency to the whole value chain, by minimizing intermediary steps: From the oil extraction, passing through Refinery, Transportation and Petrol Station concerning the conventional vehicles, and from the electrical sources (Nuclear, Hydraulics, Coal, Combined Cycle, and Centralised-Production Renewables as big solar or wind farms) up to the plug, passing through Power Stations and Transport Networks for the electricity taken from the grid. But it is also true that variability and uncertainty are inevitably present inside the game when we rely on solar and even more when we rely on wind.
Fortunately, a big part of home/office/industry appliances work 24/7 so therefore we can easily delimit our lower threshold. Concerning the higher one, we can resort to statistics or consumption history given by electricity bills.
One key idea mentioned in [9] can be a good closing conclusion for the article: ‘The idea behind smart charging is to charge the vehicle when it is most beneficial, which could be when electricity is at its lowest price, demand is lowest, when there is excess capacity, or based on some other metric.’
References
Engel D, Tørstad EH, Walker D. First Energy Transition Outlook 2017, a global and regional forecast of the energy transition to 2050, DNV GL, https://www.dnvgl.com/publications/index.html
Tébar EM, López JM, Navarro FJ et al. A Microgrid based on Solar Energy as a viable alternative for electric Mobility, Dyna Ingeniería, http://dx.doi.org/10.6036/8278
Fassbinder S, De Wachter B. The Electrical System as a Tandem Bicycle, Leonardo Energy, September 2005
Ledesma P. Regulación de frecuencia y potencia [Regulation of frequency and power]. Carlos III University of Madrid, September 2008
Red Eléctrica de España, Information of SystemOperator (e-sios), URL < https://www.esios.ree.es/en>
Jortay M. Energy, transport and environment indicators, 2016 Edition. Publications Office of the European 344 Union, 2016. http://dx.doi.org/10.2785/138586
Verzijlbergh RA, De Vries LJ, Dijkema GP et al. Institutional challenges caused by the integration of renewable energy sources in the European electricity sector. Renewable and Sustainable Energy Reviews (2016), http://dx.doi.org/10.1016/j.rser.2016.11.039
Farhoodnea M, Mohamed A, Shareef H et al. Power quality impacts of high-penetration electric vehicle stations and renewable energy-based generators on power distribution systems. Measurement (2013),
http://dx.doi.org/10.1016/j.measurement.2013.04.032
Richardson DB. Electric vehicles and the electric grid: A review of modeling approaches, impacts, and renewable energy integration. Renewable and Sustainable Energy Reviews (2012),
http://dx.doi.org/10.1016/j.rser.2012.11.042
URL <http://www.renault-leman.ch>
Sellas C. Zero grid-feeding with PIKO BA Sensor. KOSTAL Solar Electric Ibérica S.L. URL <https://www.piko-solar-portal.com>
Goli P, Shireen W. Control and Management of PV Integrated Charging Facilities for PEVs. In: Rajakaruna S, Shahnia F, Ghosh A, editors. Plug In Electric Vehicles in Smart Grids Charging Strategies, 2015. ISBN: 978-981-287-316-3; 2015, p.23-53.
Miao-Tan K, Ramachandaramurthy V, Ying-Yong J. Integration of electric vehicles in smart grid: A review on vehicle to grid technologies and optimization techniques. Renewable and Sustainable Energy Reviews (2015), http://dx.doi.org/10.1016/j.rser.2015.09.012
Faxas-Guzmán J, García-Valverde R, Serrano-Luján R et al. Priority load control algorithm for optimal energy management in stand-alone photovoltaic systems, Elsevier Renewable Energy. Vol. 68 (2014) p.156-162. DOI: http://dx.doi.org/10.1016/j.renene.2014.01.040
Daina N, Sivakumar A, Polak JW. Modelling electric vehicles use: a survey on the methods. Renewable and Sustainable Energy Reviews (2016), http://dx.doi.org/10.1016/j.rser.2016.10.005
Dallinger D, Wietschel M. Grid integration of intermittent renewable energy sources using price-responsive plug-in electric vehicles. Renewable and Sustainable Energy Reviews (2012),
http://dx.doi.org/10.1016/j.rser.2012.02.019
Liu L, Kong F, Liu X et al. A review on electric vehicles interacting with renewable energy in smart grid. Renewable and Sustainable Energy Reviews (2015), http://dx.doi.org/10.1016/j.rser.2015.06.036
Mwasilu F, Justo JJ, Kim EK et al. Electric vehicles and smart grid interaction: A review on vehicle to grid and renewable energy sources integration. Renewable and Sustainable Energy Reviews (2014),
http://dx.doi.org/10.1016/j.rser.2014.03.031
Nunes P, Figueiredo R, Brito MC. The use of parking lots to solar-charge electric vehicles. Renewable and Sustainable Energy Reviews (2016), http://dx.doi.org/10.1016/j.rser.2016.08.015
OMRON Advanced Industrial Automation – CPU CP1L –Introduction Guide, 2007. http://www.infoplc.net OMRON Advanced Industrial Automation – SYSMAC CX-Programmer Ver. 9, 2011.
https://assets.omron.eu/downloads/manual/en/w446_cx-programmer_operation_manual_en.pdf Datasheet of Phœnix Contact PLC-BSC- 24DC/21 Relay
https://www.phoenixcontact.com/us/products/2966016
Datasheet of Victron Transfer Switch ATS40V230 5kVA /10kVA Relay
https://www.victronenergy.de/upload/documents/Manual-Transfer-Switch-EN.pdf
Datasheet of Circutor WI Current Detector Control Relay - http://circutor.es/docs/FT_P3_WI_SP.pdf
Real-Calvo R, Moreno-Munoz A, Pallares-Lopez V et al. Sistema Electrónico Inteligente para el Control de la Interconexión entre Equipamiento de Generación Distribuida y la Red Eléctrica [IntelligentElectronicSystem to Control theInterconnectionbetweenDistributedGenerationResources and PowerGrid]. Elsevier Revista Iberoamericana de Automática e Informática industrial. Vol 14 (2017) p. 56–69.