cells by promoting autophagy and preventing
senescence
Caroline Andrique, … , Martine Cohen-Solal, Dominique
Modrowski
JCI Insight.
2018;
3(17)
:e121225.
https://doi.org/10.1172/jci.insight.121225
.
Sarcomas are still unsolved therapeutic challenges. Cancer stem cells are believed to
contribute to sarcoma development, but lack of specific markers prevents their
characterization and targeting. Here, we show that calpain-6 expression is associated with
cancer stem cell features. In mouse models of bone sarcoma, calpain-6–expressing cells
have unique tumor-initiating and metastatic capacities. Calpain-6 levels are especially high
in tumors that have been successfully propagated in mouse to establish patient-derived
xenografts. We found that calpain-6 levels are increased by hypoxia in vitro and calpain-6 is
detected within hypoxic areas in tumors. Furthermore, calpain-6 expression depends on the
stem cell transcription network that involves Oct4, Nanog, and Sox2 and is activated by
hypoxia. Calpain-6 knockdown blocks tumor development in mouse and induces depletion
of the cancer stem cell population. Data from transcriptomic analyses reveal that calpain-6
expression in sarcomas inversely correlates with senescence markers. Calpain-6
knockdown suppresses hypoxia-dependent prevention of senescence entry and also
promotion of autophagic flux. Together, our results demonstrate that calpain-6 identifies
sarcoma cells with stem-like properties and is a mediator of hypoxia to prevent senescence,
promote autophagy, and maintain the tumor-initiating cell population. These findings open
what we believe is a novel therapeutic avenue for targeting sarcoma stem cells.
Research Article
Oncology
Find the latest version:
Conflict of interest: The authors have declared that no conflict of interest exists.
Submitted: March 21, 2018
Accepted: July 24, 2018
Published: September 6, 2018
Reference information:
JCI Insight. 2018;3(17):e121225. https://doi.org/10.1172/jci. insight.121225.
Calpain-6 controls the fate of sarcoma
stem cells by promoting autophagy and
preventing senescence
Caroline Andrique,1,2 Laetitia Morardet,1,2 Laetitia K. Linares,3,4 Madi Y. Cissé,3 Candice Merle,5
Frédéric Chibon,5,6,7 Sylvain Provot,1,2 Eric Haÿ,1,2 Hang-Korng Ea,1,2 Martine Cohen-Solal,1,2
and Dominique Modrowski1,2
1Inserm UMR-1132, Paris, France. 2Université Paris Diderot, Sorbonne Paris Cité, Paris, France. 3IRCM, Institut de Recherche
en Cancérologie de Montpellier, INSERM U1194, Université de Montpellier, Institut régional du Cancer de Montpellier, Montpellier, France. 4Institut du Cancer de Montpellier, (ICM), Montpellier, France. 5CRCT/UMR1037 INSERM-Université
Toulouse 3, Toulouse France. 6ERL5294 CNRS, Toulouse France. 7ICR-IUCT-ONCOPOLE, Toulouse, France.
Introduction
Despite improvements in surgical techniques and aggressive chemotherapies, the survival rate of patients with sarcoma has not improved for decades. It is 60% for patients with a local tumor and 20% for patients with relapse or metastases (1, 2). Indeed, the number of patients with long-term metastatic disease has reached a plateau.
The malignant progression of cancers may rely on the emergence of cell clones with cancer stem cell (CSC) properties (3, 4) depending on genetic modifications, epigenetic regulation, and specialized environ-ments (5, 6). The concept of CSCs is currently accepted as a major contributor to leukemia and carcino-mas, but we have only few data documenting this hypothesis for sarcomas because we lack specific tools to distinguish and characterize such cells, which could be rare (7, 8).
Calpain-6 is an atypical calpain that controls microtubule network stability during cytokinesis (9). Cal-pain-6 functions as an inhibitor of skeletal muscle differentiation during development and regeneration in mice (10). Besides being detected in placenta, embryonic tissues, and macrophages under pathological condi-tions, calpain-6 has been detected in tumor cells (11–14). We previously reported that calpain-6 is present in osteosarcomas and its expression is especially high in bone tumor recurrence (14). Moreover, calpain-6 expres-sion in cancer cells is associated with the inhibition of apoptosis and chemoresistance (14–16). Together, these data suggest that calpain-6 expression may be related to the malignant progression of primary tumors.
To identify the calpain-6–expressing cells among sarcoma cell populations, we used the regulatory sequence of calpain-6 in reporter constructions. Calpain-6–expressing cells had high tumorigenic abil-ity that was related to CSC features. Calpain-6 expression depended on the stem-cell pathway involving
Oct4, Sox2, and Nanog, especially for upregulation by hypoxia. In human tumors and cell lines, cal-pain-6 expression was inversely associated with that of senescence markers, and calcal-pain-6 knockdown restored entry into the senescent state. Calpain-6 was associated with a dynamic autophagic flux that was suppressed by calpain-6 knockdown.
Results
Calpain-6 expression is associated with sarcoma malignancy. Although calpain-6 was found to be aberrantly expressed
in different tumors and found to act as an antiapoptotic and proangiogenic factor, we had few data from large genomic analyses documenting the relationship between calpain-6 expression and tumor grade or prognostics. To further determine the possible role of calpain-6 in sarcoma cell malignancy, we used cellular and mouse sar-coma models and reporter constructs, thereby avoiding the pitfalls of antibody-based methods. First, we identi-fied the active promoter in CAPN6 and characterized the regulatory activities in the 6,988-bp sequence upstream of the ATG codon (Calp6-P) (Supplemental Figure 1, A–C; supplemental material available online with this article; https://doi.org/10.1172/jci.insight.121225DS1). This DNA fragment was inserted upstream of the luciferase-coding sequence (Calp6-P-LUC), which allowed the demonstration that Calp6-P transactivation activ-ity is upregulated by endothelin-1 by activating the NF-κB pathway (Supplemental Figure 1, D and E). Hence, the same mechanisms control Calp6-P activity and calpain-6 mRNA expression (14).
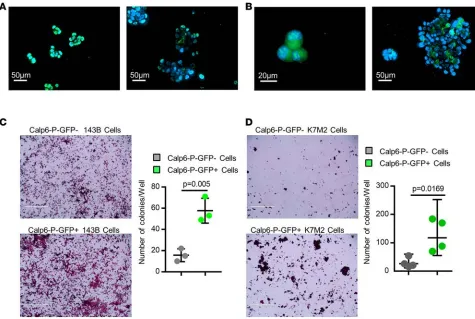
Luciferase was then replaced by membrane GFP as a reporter gene under the control of Calp6-P (Calp6-P-GFP). Different cell lines with various origins and gene alterations were transfected and selected for stable integration of the GFP reporter construct (Figure 1, A and B, and Supplemental Figure 2A). Levels of cal-pain-6 mRNA and protein were higher in sorted human GFP-expressing cells (Calp6-P-GFP+) than non– GFP-expressing cells (Calp6-P-GFP–) or unsorted cells (Calp6-P-GFP) (Supplemental Figure 2, B and C). The calpain-6 mRNA level was also higher in Calp6-P-GFP+ than GFP– mouse K7M2 cells (Figure 1C), even though Calp6-P was the human sequence. Hence, Calp6-P–driven GFP and calpain-6 expression were actu-ally associated, which validated our reporter construct used to study calpain-6–expressing cells.
We then used immunofluorescence and bioluminescence to investigate the fate of calpain-6–express-ing cells in vivo in a syngeneic model of bone tumor that involved injectcalpain-6–express-ing Calp6-P-GFP K7M2 cells into the tibia of BALB/c mice, as previously described (17). These cells were transduced and selected to express luciferase under the control of a strong promoter, EFIα (Luc-Calp6-P-GFP K7M2). Six weeks later, luciferase-expressing cancer cells were detected in the bone marrow of tibias implanted with unsorted and sorted Luc-Calp6-P-GFP+ cells but not sorted Luc-Calp6-P-GFP– cells (Figure 1D). Local bioluminescent signal was continuously increased with implantation of Luc-Calp6-P-GFP+ K7M2 cells (Figure 1, E and F). In mice injected with sorted Luc-Calp6-P-GFP– cells, the signal increased slightly until the second week, then decreased thereafter (Figure 1, E and F).
In H&E-stained sections of mouse lungs, metastatic nodules were larger with implantation of unsorted or Luc-Calp6-P-GFP+ than Luc-Calp6-P-GFP– K7M2 cells (Figure 1, G and H). To determine whether the reduced metastatic disease in Luc-Calp6-P-GFP– mice was related to the absence of bone tumor or whether calpain-6–expressing cells were directly involved in the metastatic process, we injected 10-fold fewer sorted Luc-Calp6-P-GFP– or -GFP+ K7M2 cells into mouse tibias. Mice did not show local bone tumor within 3 months after cell implantation. At this time, lung tissues were dissociated and lung cells were cultured with neomycin to select cancer cells. Sarcoma cell colonies grew only in cultures of lung cells from mice injected with Calp6-P-GFP+ K7M2 cells (Figure 1I). Together, our results show that calpain-6–expressing cells are responsible for primary bone tumor formation and metastatic progression of osteosarcoma in the K7M2 cell–derived mouse model.
Calpain-6 expression is a marker of stem-like cells. We next investigated the mechanisms involved in the
Figure 1. Calpain-6–expressing cells are tumor-initiating cells.
(A) Fluorescence microscopy of Calp6-P-GFP K7M2 cells. (B) Flow cytometry of GFP in Calp6-P-GFP K7M2 cells. (C) RT-qPCR analysis of calpain-6 mRNA expression in sorted Calp6-P-GFP– and -GFP+ K7M2
cells. Data are the mean ± SD from 3 independent RNA extracts compared by 2-tailed Student’s t test. (D) Immu-nofluorescence of luciferase-expressing cells (tumor cells) in sections of bone injected with unsorted Luc-Calp6-P-GFP or sorted Luc-Calp6-P-GFP+ or
-GFP– K7M2 cells. The bones
were collected at 6 weeks after implantation. Bone tissues from noninjected mice served as control. Scale bars: 100 μm. (E) Quantification of biolumi-nescent signals in tibias of Luc-Calp6-P-GFP K7M2–implanted mice during tumor growth. n = 6 mice/group. Data are medians, box edges are the interquartile range, and whiskers are the range. Outliers were identi-fied by Grubbs’ test (α = 0.05). Data were compared by 2-way ANOVA. (F) Typical images of the bioluminescent signals in tibias of K7M2-implanted mice. (G) Representative H& E-stained lung sections from mice implanted for 6 weeks with unsorted Calp6-P-GFP or sorted Calp6-P-GFP– or -GFP+
K7M2 cells. Scale bars: 100 μm. (H) Metastasis area. n = 7 mice (unsorted Calp6-P-GFP K7M2 cells), n = 7–8 mice (sorted Calp6-P-GFP– or -GFP+ K7M2
self-renewal activity in these cells (Figure 2E). However, the proportion of GFP+ cells decreased and that of GFP– cells increased during human and mouse cell proliferation (Supplemental Figure 4, A and B). Therefore, the populations were not stable when the cells rapidly grew.
We then sorted 143B Calp6-P-GFP– and -GFP+ cells to culture them separately for 5 days. The Calp6-P-GFP– cell culture contained only 0.1% GFP+ cells, whereas the Calp6-P-GFP+ cell culture contained 35.4% GFP– cells (Figure 2F). These results suggest that Calp6-P-GFP–cells could result from GFP+ cell division. On the other hand, Calp6-P-GFP+ K7M2 cell–derived tumors displayed histological heterogeneity and looked like tumors obtained with unsorted K7M2 cells (Figure 2G). Together, these results suggest that calpain-6–expressing cells behave like self-renewing stem cells at the top of the cellular hierarchy.
To further characterize the possible stem-cell features of these cells, we performed sphere formation assays as a classical test to show self-renewing stem-like cells (18). Human and mouse cells were cultured on nonadherent plastic in stem-cell-specific medium. Every cell of the floating spheres at the 2- to 3-cell stage expressed GFP, but the proportion of Calp6-P-GFP+ cells was decreased in larger spheres and was not significantly different from that in adherent monolayer cultures of unsorted Calp6-P-GFP cells (Figure 3, A and B, and Supplemental Figure 4C). Colony-formation ability was greater for sorted Calp6-P-GFP+ cells of the different cell lines than Calp6-P-GFP– cells (Figure 3, C and D). Hence, Calp6-P-GFP+ cells appeared to be sphere-initiating cells. Finally, we used immunohistochemical detection of calpain-6 in tumor samples from liposarcomas that were tested for engraftment in mice. Calpain-6 expression was great-er in sections of sarcomas successfully transplanted in mice to obtain patient-dgreat-erived xenografts (PDXs) versus tumors that failed to grow in mice (Supplemental Figure 5A). Consistently, a high level of calpain-6 mRNA was found only in grade 3 liposarcomas (Supplemental Figure 5B). These findings strengthen the idea that calpain-6–expressing cells have high tumorigenic potential because they have stemness features.
Calpain-6 expression depends on the hypoxic environment and stem-cell pluripotency factors: Oct4, Sox2, and Nanog. A striking feature of the Calp6-P sequence is the high number and distribution of consensus sites for
the stem-cell pluripotency factors Oct-4, Nanog, and Sox2 (Figure 4A). Under standard culture conditions (21% O2), chromatin immunoprecipitation (ChIP) failed to show that Nanog or Sox2 bound to Calp6-P. However, as previously reported (19, 20), reducing the O2 level to 3% to activate HIF-1α–dependent trans-activation (Supplemental Figure 6A) resulted in the upregulation of Oct-4, Nanog, and Sox2 expression (Supplemental Figure 6, B–D), which in turn allowed the detection of Calp6-P–associated Oct-4, Nanog, and Sox2 in sarcoma cells (Supplemental Figure 6E). Hypoxia also increased the transactivation activity of Calp6-P (shown by increased GFP expression) and calpain-6 expression in diverse cancer cell lines (Figure 4B and Supplemental Figure 7, A–C).
To determine whether calpain-6 expression was associated in vivo with hypoxic environments, mice with K7M2 cell–derived bone tumors were injected with pimonidazol as a hypoxyprobe (21). Immunofluorescence showed the highest calpain-6 expression in hypoxic areas within tumor sections (Figure 4C). Also, in human osteosarcoma sections, calpain-6 was detected in areas where hypoxia-inducible factor 1 α (HIF-1α) accumulated (Figure 4D). We then used specific siRNA to knock down HIF-1α, Oct-4, Nanog, or Sox2 expression induced by hypoxia (Supplemental Figure 6, B–D). Consis-tent with the interdependency previously reported (22), the suppression of only 1 of the 4 transcription factors (HIF-1α, Oct-4, Sox2, and Nanog) was sufficient to block the hypoxia-dependent expression of Oct-4, Nanog, and Sox2 (Supplemental Figure 6, B–D). Knockdown of Oct-4, Sox2, and Nanog also blocked the increase in calpain-6 mRNA level in hypoxic cells (Figure 4E). In contrast, coexpression of Oct-4, Nanog, and Sox2 but not their individual expression increased the calpain-6 mRNA level in cells cultured with 21% O2 (Figure 4F). Hence, Oct-4, Nanog, and Sox2 induced via HIF-1α act to mediate hypoxia-dependent promotion of calpain-6 expression.
Together, these findings show that Oct-4, Nanog, and Sox2 function together as direct transactivators binding the regulatory sequence of calpain-6. Hence, calpain-6 is expressed in cells with a functional stem-cell pathway.
Calpain-6 expression is required for sarcoma-cell tumorigenicity. To determine whether calpain-6 has a
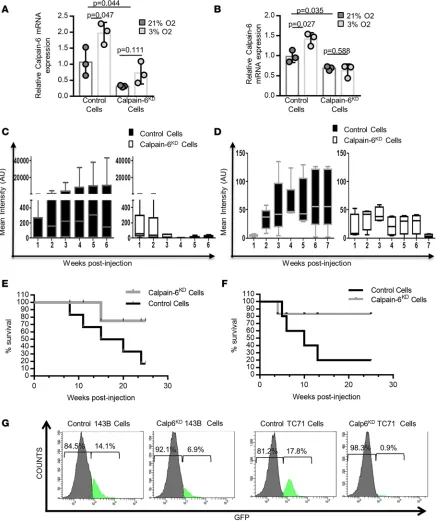
Calpain-6KD or control cells were then implanted into tibias of BALB/c mice or immunodeficient mice. Luciferase-expressing calpain-6KD K7M2 cells generated a weak bioluminescent signal for the first 2 weeks, which disappeared thereafter. In contrast, control K7M2 cells formed tumors over time (Figure 5C). Simi-larly, knockdown of calpain-6 expression in human osteosarcoma 143B cells strongly reduced tumor devel-opment in tibias of immunodeficient mice (Figure 5D). Survival was better for mice with calpain-6KD cell injection than control cell injection (Figure 5, E and F). Therefore, calpain-6 not only can identify CSCs but also has a functional role during tumorigenesis. Indeed, calpain-6 knockdown greatly decreased the propor-tion of Calp6-P-GFP+ cells in osteosarcoma populations (Figure 5G). Consistently, calpain-6 knockdown strongly suppressed colony formation on nonadherent plastic in serum-free stem cell medium (Supplemen-tal Figure 8, C and D). Hence, calpain-6 may function to maintain the stem cell population.
Lack of calpain-6 in sarcoma cells is associated with senescence. To further investigate the calpain-6 function in
Figure 2. Calpain-6–expressing cells are at the top of the cellular hierarchy. (A
and B) Analysis of cell cycle in Calp6-P-GFP– and -GFP+ 143B cells (A) and K7M2
cells (B). (C and D) Flow cytometry of the proliferation marker Ki67 in 143B cells (C) and K7M2 cells (D). Data are mean fluorescence intensity compared by 2-tailed Student’s t test (50,000 cells were analyzed). (E) The proportion of Calp6-P-GFP+ cells analyzed by flow
cytometry in confluent cells at multiple passages in different cell lines. (F) Flow cytometry of Calp6-P-GFP–/+ cells 5
days after seeding of unsorted, sorted Calp6-P-GFP–, or sorted Calp6-P-GFP+
143B cells. (G) H&E staining of K7M2 and Calp6-P-GFP+ K7M2 cell–derived
CSCs, we analyzed transcriptomes of primary untreated human sarcomas (23, 24), comparing tumors with low and high levels of calpain-6. Both RNA-sequencing (RNA-seq) and microarray transcriptome profiling revealed lower levels of markers of senescence in calpain-6–expressing than –nonexpressing tumors (Figure 6, A and B). Because senescence plays a crucial role in the response to chemotherapy and suppresses tumor growth by limiting the lifespan of cancer cells (25, 26), these results appeared of particular interest. PCR con-firmed that the expression of senescence-associated secretory phenotype (SASP) genes and levels of senes-cence markers p21 and p16 were lower in sorted Calp6-P-GFP+ than -GFP– populations (Figure 6, C and D). In situ, senescence-associated β-galactosidase (SA-β-Gal) activity was mostly detected in very confluent GFP– cells (Figure 6E). Flow cytometry further revealed that SA-β-Gal activity was reduced in Calp6-P-GFP+ cells of the different cell lines (Figure 6F). However, calpain-6 knockdown increased SASP gene expression and enhanced the number of cells with SA-β-Gal activity (Figure 6, G–I).
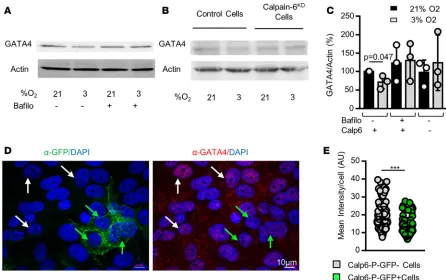
GATA4 is a p53-independent transcription factor regulated by p62/SQSTM1-mediated selective autophagy that controls SASP gene expression and senescence (27). Consistent with data showing that hypoxia can pre-vent senescence, reducing O2 pressure resulted in decreased GATA4 protein level in 143B cells by enhancing its degradation via autophagy since bafilomycin 1A that blocks late phase of autophagy suppressed this effect of hypoxia (Figure 7, A and C). Hypoxia did not reduce GATA4 in calpain-6KD cells (Figure 7, B and C). More-over, the GATA4 level was still higher in the nucleus of Calp6-P-GFP– than in GFP+ cells cultured in 3% O
2 (Figure 7, D and E). These results suggest that hypoxia influences senescence differently in Calp6-P-GFP– and GFP+ cells and that calpain-6 is involved in the protective function of hypoxia in sarcoma cells.
Calpain-6 expression is associated with dynamic autophagic flux. The protein p62/SQSTM1 is processed
with GATA4 in autophagic flux. Immunofluorescence showed an accumulation of p62/SQSTM1 puncta in hypoxic Calp6-P-GFP– cells (Supplemental Figure 9, A and B). On the other hand, Western blot analyses revealed higher levels of the autophagosome-associated form of LC3, LC3-II, in Calp6-P-GFP+ 143B cells
(Supplemental Figure 9C). Together, these results suggest a more dynamic autophagic process in Calp6-P-GFP+ cells. We therefore measured autophagic flux using bafilomycin 1A to disrupt autophagic flux and measure the accumulation of LC3-stained autophagosomes. Immunofluorescence and cytometry analyses revealed that bafilomycin induced more LC3 puncta and greater LC3 accumulation (ΔLC3) in
Calp6-P-Figure 5. Calpain-6 knockdown inhibits tumorigenesis. (A and B) RT-qPCR of calpain-6 in control and calpain-6KD K7M2 (A) and 143B (B) cells cultured in
21% or 3% O2. Results are the mean ΔΔCT ± SD of 3 extracts from different cultures compared by 1-way ANOVA. (C and D) Mean bioluminescence intensity in control and calpain-6KD K7M2 cell–implanted (C) and control and calpain-6KD 143B cell–implanted (D) mice. n = 6 mice/group for K7M2 cell–implanted and
n = 5 mice/group for 143B cell–implanted mice. Data are medians, box edges are the interquartile range, and whiskers are the range. Outliers were identi-fied by Grubbs’ test (α = 0.05). Data were compared by multiple t test corrected by the 2-stage step-up method of Benjamini, Krieger, and Yekutieli. (E and
F) Kaplan-Meier survival curves for mice implanted with K7M2 (E) and 143B (F) cells. (G) Flow cytometry of Calp-6-GFP+ cells in calpain-6KD 143B and TC71
GFP+ than -GFP– cells (Figure 8, A–D, and Supplemental Figure 9, D and E). The difference between GFP– and GFP+ cells was only detected when autophagy was challenged by hypoxia. These data support a more active autophagy in hypoxic GFP+ than GFP– cells. This hypoxia-dependent autophagic flux (ΔLC3) was inhibited in calpain-6KD cells and strongly increased in calpain-6–overexpressing 143B cells (Figure 8, E and F, and Supplemental Figure 9F).
Together, these data suggest that calpain-6 may be involved in the regulation of sarcoma stem-cell fate and tumor progression in hypoxic environments by promoting autophagy and preventing senescence (Figure 8G).
Discussion
Despite evidence that sarcomas contain cells with stem-like characteristics (28–32), explaining the develop-ment of these tumors using the general concept of CSC is a challenge (8). Probably because of their various cellular origins and the multiple genetic alterations involved, specific and common markers or genetic signa-tures were still missing to distinguish stem cells from the bulk of sarcoma cells. Here, we used the calpain-6 regulatory sequence–based reporter to identify cells that generated the other cell populations in monolayer and sphere cultures and in vivo during tumor formation in mice. We found that calpain-6 identified cells that behave like stem cells at the top of the cellular hierarchy. Moreover, calpain-6 expression is restricted to a cell population with a functional regulatory network involving Oct-4, Sox2, and Nanog. Hence, calpain-6 is a tar-get gene of a stemness pathway that is part of the common signature of embryonic stem and cancer cells (33). Valent et al. defined CSCs as cells that confer malignancy to the tumors (4). The stemness pathway that controls calpain-6 expression was found to be upregulated in poorly differentiated tumors and associated with worse outcome (34). In our osteosarcoma mouse model, only calpain-6–expressing cells were able to generate a tumor, and suppression of calpain-6 inhibited tumor development in mouse- and human cell– based mouse tumor models. Therefore, calpain-6–expressing cells are tumor-initiating cells.
Calpain-6–expressing cells had unique metastatic capacities in our syngeneic mouse model. Moreover, we show that calpain-6 expression is high in grade III liposarcomas as compared with lower-grade lipo-sarcomas. Although liposarcomas could be very different tumors and diseases, the grading predicts cancer progression and our results indicate that calpain-6 expression is associated with worse prognosis. Finally, we and others previously found that calpain-6–expressing cells are responsible for tumor chemoresistance (14, 35). Hence, calpain-6 expression is definitively associated with malignant characteristics of sarcoma cells. Calpain-6 was able to identify these populations in cell lines from diverse origins and with various genetic alterations. Therefore, we propose calpain-6 as a marker of sarcoma stem cells.
Importantly, our results bring the first evidence to our knowledge of a possible hierarchical orga-nization of sarcomas and what we believe are new insights into the contribution of stem cells to the development of these tumors.
The hypoxic environment supports chemoresistance and aggressiveness of tumor cells (36). HIFs con-trol the stemness pathway modulating the loop involving Oct4, Sox2, and Nanog (37). Our results indicate that calpain-6 expression is increased when O2 levels are reduced. We also show that calpain-6 is required for hypoxia-dependent prevention of senescence. Thus, calpain-6 may be induced to mediate a specific stem-cell adaptation to the tumor environment.
Because calpain-6 knockdown did not modify the expression of autophagy-related genes at the mRNA level but strongly impaired LC3 accumulation, calpain-6 may not alter upstream signaling that controls autophagy induction but rather it directly participates in the late phases of this process. This
Figure 6. Calpain-6 expression is associated with reduced senescence markers. (A and B) Senescence-associated secretory phenotype (SASP) gene expression in tumors with and without calpain-6 expression from transcriptomic analysis of soft-tissue sarcomas. (A) RNA sequencing. Cutoff = 1 for calpain-6 expression. n = 71 tumors for calpain-6 <1, n = 24 tumors for calpain-6 >1. (B) Affymetrix RNA microarray. Cutoff = 3 for calpain-6 expression. n = 239 tumors for calpain-6 <3, n = 100 tumors for calpain-6 >3. Data are medians, box edges are the interquartile range, and whiskers are the range. P values are from 2-tailed Mann-Whitney U test. (C and D) RT-qPCR analyses of mRNA levels of senescence markers in sorted Calp6-P-GFP– and GFP+ human
sar-coma 143B cells (C) and mouse K7M2 cells (D). Data are the mean ± SD of 3 independent cell extracts evaluated by 2-sided Student’s t test. (E) Detection of senescence-associated β-galactosidase (SA-β-Gal) activity in Calp6-P-GFP– and -GFP+ 143B and K7M2 cells. Membrane GFP was revealed by
immuno-histochemistry. (F) Flow cytometry of SA-β-Gal activity in Calp6-P-GFP– and -GFP+ 143B, TC71, and K7M2 cells and quantification. Data are the mean ±
SD from n = 34,980 (143B), 35,150 (TC71), and 33,282 (K7M2) GFP– cells; n = 9,630 (143B), 7,243 (TC71), and 13 390 (K7M2) GFP+ cells compared by 2-tailed
Student’s t test. (G) RT-qPCR analyses of mRNA levels of SASP genes in control and calpain-6KD 143B cells. Data are the mean ± SD of 3 independent cell
extracts evaluated by 2-tailed Student’s t test. (H) Representative images of SA-β-Gal+ cells in confluent control and calpain-6KD 143B cells. Scale bars: 400 μm. (I and J) Quantification of SA-β-Gal+ cells in control and calpain-6KD 143B cells (I) and K7M2 cells (J). Data are the mean ± SD of 3 cultures evaluated by
suggestion would be consistent with its role in microtubule stabilization and actin cytoskeleton orga-nization (9, 12) and could explain why the genomic analyses failed to reveal any relationship between calpain-6 expression in tumors and autophagy. Although autophagy may be involved as a tumor sup-pressor in early phases of cancer development, it seems to be required in advanced tumors. In particular, autophagy was found to be increased in various cancer cell spheres (38, 39). Inhibition of autophagy in these models altered CSC behavior. Moreover, autophagy was proposed to be a key mechanism that contributes to the maintenance of normal and CSC populations. Garcia-Prat et al. recently demonstrated that autophagy maintains the stemness of satellite cells by preventing senescence (40). The possible switch between autophagy and senescence should be further investigated to determine how it contributes to the maintenance of the CSC population and tumor progression. Together, our findings open a poten-tially novel therapeutic avenue for targeting sarcoma stem cells.
Methods
Osteosarcoma and Ewing sarcoma cells. Human 143B and U2OS and murine K7M2 osteosarcoma cell
lines, human PC3 prostate, and MDA-MB-231 breast adenocarcinoma cell lines were obtained from ATCC. Ewing sarcoma TC71 cells were provided by Didier Surdez (Institut Curie, Paris, France). The different cell types were maintained in Dulbecco’s Modified Eagle’s Medium (DMEM) supplemented with 10% of fetal calf serum (FCS) and antibiotics (100 IU/ml penicillin and 100 μg/ml streptomy-cin). The cells were transfected with reporter plasmids using Transfast reagent (Promega) or trans-duced with lentiviral particles that were prepared in 293T cells using the Lentiviral Packaging Plasmid kit (Cellecta) and then mixed with FSC-free medium containing 1 μl/ml polybrene. Premade lentiviral particles were used for luciferase expression under the control of the EF1α promoter (LVP433 Ams-bio). For stable genomic integration of exogenous DNA, transfected or transduced cells were selected with G418 (Gibco) or blasticidin (Invitrogen). To block autophagy the cells were treated for 4 hours with 10 nM bafilomycin A1 (Sigma-Aldrich).
Figure 7. Calpain-6 mediates the hypoxia-dependent prevention of senescence entry. (A) Western blot analysis of GATA4 in 143B cells in the absence or presence of bafilomycin A1. (B) Western blot analysis of GATA4 in control and calpain-6KD 143B cells. (C) Quantification of the Western blots. Data are the
mean ± SD from 3 independent blots. Actin was used as a loading control. (D) Representative immunofluorescence images of GFP and GATA4 in Calp6-P-GFP 143B cells. White and green arrows indicate Calp6-P-GFP– and GFP+ cells, respectively. (E) Quantification of GATA4 labeling. Data are the mean ± SD compared
Calp6-P constructions. The promoter sequences in CAPN6 were extracted from the 5′ region upstream of the ATG codon and transcription factor analysis was performed using the Genomatix MatInspector software suite. To determine the transcription start site we used the SMARTer RACE cDNA Amplification Kit (Clontech). The 6,988 bp upstream of ATG were amplified using PAC RCPI-6 (Life Technologies) as template and inserted between the BamHI and EcoRV sites in pcDNA3.1zeo (Clontech) and then subcloned into the Kpn1-XhoI
Figure 8. Calpain-6 controls autophagy in sarcoma stem cells. (A) Representative immunofluorescence of GFP and LC3 in Calp6-P-GFP 143B cells. White and green arrows indicate GFP– and GFP+ cells, respectively. (B) Quantification of LC3 puncta in 143B cells. Data are the mean ± SD evaluated by 1-way
ANOVA. (C) Flow cytometry of LC3 in 143B cells. (D) Quantification of LC3 accumulation in the presence of bafilomycin (ΔLC3). n = 25,000 GFP– cells and
3,800 GFP+ cells. (E) ΔLC3 quantification in control and calpain-6KD 143B cells. n = 50,000 cells. (F) ΔLC3 quantification in control and
sites in pGL4.10 (Promega) or in the Kpn1-BamHI sites in pZsGreen1-1 (Clontech). Then pzsGreen sequence was replaced by membrane GFP using the In-Fusion cloning kit (Clontech). The different constructions were checked by sequencing. The primers that were used for amplifications are listed in Supplemental Table 1.
Gene knockdown. To selectively inhibit HIF-1α, Oct4, Sox2, or Nanog, sarcoma cells were transiently
transfected with control or specific siRNA (Santa Cruz Biotechnology). Calpain-6 expression was sup-pressed in mouse sarcoma cells using a set of plasmids (Santa Cruz Biotechnology) encoding crRNAs and Cas9 for double nicking of Capn6. Two different single crRNAs subcloned into the pLentiCRISPR v2 (GenScript) were tested for calpain-6 knockdown in human cells. The crRNA targeting exon 2 (TGAT-GACCCCCATCTGATTG) showed greater ability to decrease calpain-6 expression.
Transactivation assays. Sarcoma cells were seeded in 24-well plates and transfected with 1.5 μg
Calp6-P-LUC or empty pGL4.10 plasmid with 2.5 ng/well phRL-SV40, a Renilla expression plasmid serving as internal transfection control. Firefly and Renilla luciferase activities were measured sequentially using a Luciferase Reporter Assay System (Promega) 24 hours after transfection. Luciferase activity was normal-ized to Renilla activity and to values obtained with cells transfected with empty pGL4.10.
ChIP. To test binding of Oct4, Sox2, and Nanog to Calp6-P we used the Stem Cell Master Regulator
Assay kit (Cell Signaling Technology). Briefly, the cells were fixed with 1% formaldehyde in the medium, genomic DNA was extracted, fragmented by sonication, and incubated with specific antibodies or control immunoglobulin for immunoprecipitation on magnetic beads. Immunoprecipitated DNA or control inputs were then amplified using Calp6-P–specific primers (Supplemental Table 1).
Immunoblot analyses. The cells were washed with cold phosphate-buffered saline and then lysed on ice
in 50 mM Tris (pH 7.5) buffer containing 150 mM NaCl, 1% NP-40, 10% glycerol, and protease inhibi-tors. Proteins lysates were subjected to SDS-PAGE, electrotransferred to PVDF membranes, incubated with the primary antibodies and then with appropriate horseradish peroxidase–conjugated antibody. The signals were visualized using a chemiluminescent detection system (Azure Spectra). Band quantifica-tions were performed using ImageJ (NIH).
RT-qPCR analysis. Total RNA was isolated from sarcoma cells or human samples using TRIzol reagent
(Invi-trogen). Reverse transcription (RT) was performed with random primers using High-Capacity cDNA Reverse Transcription Kit (Applied Biosystems). Real-time quantitative PCR was then performed using primers listed below and SensiFAST SYBR No-ROX Kit (Bioline) on a LightCycler 480 (Roche Applied Science). Actin and PPia or actin and HPRT served as housekeeping genes. Fold changes were normalized using the ΔΔCt formula.
SA-β-Gal activity. For in situ determination of SA-β-Gal activity the cells were washed in
phos-phate-buffered saline, fixed with 1% formaldehyde and 0.2% glutaraldehyde, and incubated for 24 hours at 37°C in freshly prepared staining buffer (5 mM K3Fe[CN]6, 5 mM K4Fe[CN]6, and 2 mM MgCl2, pH 6) containing 1 mg/ml X-gal (5-bromo-4-chloro-3-indolyl-β-D-galactoside). The cells were then fixed with 4% paraformaldehyde for immunocytochemistry. To determine SA-β-Gal activity using flow cytometry, the cells were cultured in the presence of 33 μM 4-methylumbelliferyl-β -D-galactopyranoside (MUGal, Sigma-Aldrich) for 2 hours.
Sphere formation assay. Cells were plated at a density of 106 cells in 75-cm2 ultralow-attachment flasks (Corning) and cultured in serum-free xeno-free DMEM/F12 containing Essential 8 supplement (Thermo-Fisher Scientific). This medium is optimized for pluripotent stem cell culture. At day 7, the spheres were dissociated and replated in the same conditions. Floating colonies were analyzed using a Zeiss fluorescence microscope interfaced with the software ZenPro. To quantify sphere formation, sarcoma cells (3,000 cells/ well) were plated on Geltrex (ThermoFisher Scientific) matrix-coated ultralow-attachment plates and cul-tured in the same condition as for the sphere formation assay. Geltrex is a soluble form of reduced growth factor basement membrane extract that allowed for cell attachment. The cell colonies were stained using crystal violet and analyzed with an Evos cell imaging system (ThermoFisher Scientific).
Immunochemistry. Sets of osteosarcoma sections from patients were provided by Jean-Marc
Image acquisitions and processing. Image acquisitions were done using the ApoTome optical sectioning
system (Zeiss) with inverted microscope (Zeiss Axio Observer Z1) for immunofluorescent images, and with a Nikon microscope (type 120c) for chromogenic images. Zenpro (Zeiss) and Adobe Photoshop were used for image processing. For comparison of fluorescence images, contrast and brightness were adjusted identi-cally. All other quantifications were performed using ImageJ software.
Flow cytometry analyses. For intracellular staining the cells were fixed and permeabilized using a
Fix-Perm kit (eBiosciences) before incubation with the antibodies. A PKH26 Red Fluorescent Cell Linker Kit (Sigma-Aldrich) was used as membrane marker at the onset of the culture. Fluorescence analysis was performed in a FACSCanto II using Diva software (Becton Dickinson). A representative gating strategy is shown in Supplemental Figure 4.
Transcriptomic analysis. The FSG database, which is part of the Conticabase (www.conticabase.org),
was previously described (41, 42). It contains data from adult soft tissue sarcomas treated in 11 centers, including a description of subjects, primary tumors, treatment, follow-up, and availability of tumor sam-ples. Every case was histologically reviewed by the pathologist subgroup and classified according to the 2002 World Health Organization classification by histology, immunohistochemistry, and molecular genet-ics and cytogenetgenet-ics when needed. We selected 2 cohorts of soft-tissue sarcomas with no recurrent chro-mosomal translocations and for which a frozen tissue of the primary untreated tumor was available. Gene expression was analyzed from a microarray experiment using the GeneChip human genome U133 Plus 2.0 Array (Affymetrix) that has been deposited at NCBI’s Gene Expression Omnibus (GEO) with accession number GSE21050 or from RNA-seq expression data available at the GEO under accession GSE71119.
Mouse osteosarcoma model. S/SPF BALB/cByJ and S/SOPF SWISS NU/NU mice were purchased from
Charles River Breeding Laboratories. They were 4- to 5-week-old males. Mice were kept in accordance with the institutional guidelines of the French Ethical Committee and under the supervision of authorized investi-gators. Bone tumors were obtained by injecting the cells into the right tibia of the mice as previously described (17). Mice were anesthetized with a ketamine/xylasine mix (100/50 mg/kg), the right tibia was drilled and a needle was inserted to inject the cell suspension (5 × 10³ to 5 × 10⁴ cells in 5 μl). Tumor growth was monitored in live animals every week by bioluminescence imaging, using D-luciferin (Promega). Image acquisition was performed with the ONYX dark box system (Stanford Photonics, Inc). Animals were sacrificed 6 weeks after tumor inoculation. For histological analysis, resected bone and lung specimens were fixed in 4% paraformal-dehyde and paraffin embedded for immunofluorescence or H&E staining.
Statistics. Data are presented as mean ± SD. Every experiment was performed at least 3 times.
Sta-tistical analysis was performed using unpaired 2-sided Student’s t test or 1-way ANOVA for multiple comparisons. GraphPad and LePAC softwares were used for the statistical analyses. A P value less than 0.05 was considered significant.
Study approval. In vivo experiments were approved by the Local Ethical Committee (no. CCEA70,
Paris, France, date APAFIS 6947). For patients included into the Conticabase, according to French law at the time of the study, experiments were performed in agreement with the Bioethics Law 2004 800 and the Ethics Charter from the National Institute of Cancer; all subjects signed a non-opposition statement for research use of the sample.
Author contributions
CA designed and performed most of the experiments, data analyses, and interpretations and was one of the pri-mary writers of the manuscript. LM performed and analyzed the experiments concerning metastatic potential of sarcoma cells and contributed to reporter system construction. LKL provided liposarcoma sections corre-sponding to PDX assays. MYC performed RNA extraction from liposarcomas and RT-qPCR analyses. CM and FC performed analyses from transcriptomic assays and contributed to writing the manuscript. SP contributed to in vivo experiments, data analyses, and helped in writing the manuscript. EH contributed data analyses and interpretations. HKE contributed to experiments on autophagy and helped in data analysis. MCS contributed to data analyses, interpretations, and manuscript construction. DM constructed the project, designed and super-vised the experiments, and had a major role in data interpretation and writing the manuscript.
Acknowledgments
Fran-çaise de lutte Contre les Cancers et les leucémies de l’Enfant et de l’adolescent (SFCE) for their support, and Jean-Marc Guinebretière (Department of Pathology, Institut Curie-Centre René Huguenin, St. Cloud, France) for providing human osteosarcoma sections. The authors thank the CRB-ICM (BB-033-0059) for biological resources supplied for the study. This work was supported by grants from the Fédération Enfants et Santé (R12118HH), Ligue contre le cancer (R14148HH), and European Calcified Tissue Society (ECTS) (EEE09002HHHA). English was corrected by Laura Smales (BioMedEditing, Toronto, Canada).
Address correspondence to: Dominique Modrowski, UMR-1132 Inserm, 2 rue Ambroise Paré, 75010, Paris, France. Phone: 33.149.95.6352; Email: dominique.modrowski@inserm.fr.
1. Doyle LA. Sarcoma classification: an update based on the 2013 World Health Organization Classification of Tumors of Soft Tissue and Bone. Cancer. 2014;120(12):1763–1774.
2. Allemani C, et al. Global surveillance of cancer survival 1995-2009: analysis of individual data for 25,676,887 patients from 279 population-based registries in 67 countries (CONCORD-2). Lancet. 2015;385(9972):977–1010.
3. Eide CA, Druker BJ. Understanding cancer from the stem cells up. Nat Med. 2017;23(6):656–657.
4. Valent P, et al. Cancer stem cell definitions and terminology: the devil is in the details. Nat Rev Cancer. 2012;12(11):767–775. 5. Zaidi SK, et al. Bivalent Epigenetic Control of Oncofetal Gene Expression in Cancer. Mol Cell Biol. 2017;37(23):e00352–17. 6. Aponte PM, Caicedo A. Stemness in cancer: stem cells, cancer stem cells, and their microenvironment. Stem Cells Int.
2017;2017:5619472.
7. Pattabiraman DR, Weinberg RA. Tackling the cancer stem cells - what challenges do they pose? Nat Rev Drug Discov. 2014;13(7):497–512.
8. Magee JA, Piskounova E, Morrison SJ. Cancer stem cells: impact, heterogeneity, and uncertainty. Cancer Cell. 2012;21(3):283–296. 9. Tonami K, Kurihara Y, Aburatani H, Uchijima Y, Asano T, Kurihara H. Calpain 6 is involved in microtubule stabilization and
cytoskeletal organization. Mol Cell Biol. 2007;27(7):2548–2561.
10. Tonami K, et al. Calpain-6 deficiency promotes skeletal muscle development and regeneration. PLoS Genet. 2013;9(8):e1003668. 11. Lee SJ, et al. Increased expression of calpain 6 in uterine sarcomas and carcinosarcomas: an immunohistochemical analysis. Int
J Gynecol Cancer. 2007;17(1):248–253.
12. Tonami K, et al. Calpain-6, a microtubule-stabilizing protein, regulates Rac1 activity and cell motility through interaction with GEF-H1. J Cell Sci. 2011;124(Pt 8):1214–1223.
13. Miyazaki T, et al. Calpain-6 confers atherogenicity to macrophages by dysregulating pre-mRNA splicing. J Clin Invest. 2016;126(9):3417–3432.
14. Marion A, Dieudonné FX, Patiño-Garcia A, Lecanda F, Marie PJ, Modrowski D. Calpain-6 is an endothelin-1 signaling depen-dent protective factor in chemoresistant osteosarcoma. Int J Cancer. 2012;130(11):2514–2525.
15. Liu Y, et al. miR-449a promotes liver cancer cell apoptosis by downregulation of calpain 6 and POU2F1. Oncotarget. 2016;7(12):13491–13501.
16. Lee SJ, et al. Increased expression of calpain 6 in uterine sarcomas and carcinosarcomas: an immunohistochemical analysis. Int J Gynecol Cancer. 2007;17(1):248–253.
17. Dieudonné FX, Marion A, Marie PJ, Modrowski D. Targeted inhibition of T-cell factor activity promotes syndecan-2 expres-sion and sensitization to doxorubicin in osteosarcoma cells and bone tumors in mice. J Bone Miner Res. 2012;27(10):2118–2129. 18. Grimshaw MJ, et al. Mammosphere culture of metastatic breast cancer cells enriches for tumorigenic breast cancer cells. Breast
Cancer Res. 2008;10(3):R52.
19. Petruzzelli R, Christensen DR, Parry KL, Sanchez-Elsner T, Houghton FD. HIF-2α regulates NANOG expression in human embryonic stem cells following hypoxia and reoxygenation through the interaction with an Oct-Sox cis regulatory element. PLoS One. 2014;9(10):e108309.
20. Mathieu J, et al. HIF induces human embryonic stem cell markers in cancer cells. Cancer Res. 2011;71(13):4640–4652. 21. Aguilera KY, Brekken RA. Hypoxia Studies with Pimonidazole in vivo. Bio Protoc. 2014;4(19):e1254.
22. Wang Y, et al. Endogenous miRNA sponge lincRNA-RoR regulates Oct4, Nanog, and Sox2 in human embryonic stem cell self-renewal. Dev Cell. 2013;25(1):69–80.
23. Chibon F, et al. Validated prediction of clinical outcome in sarcomas and multiple types of cancer on the basis of a gene expres-sion signature related to genome complexity. Nat Med. 2010;16(7):781–787.
24. Lesluyes T, et al. RNA sequencing validation of the Complexity INdex in SARComas prognostic signature. Eur J Cancer. 2016;57:104–111.
25. Bartkova J, et al. Oncogene-induced senescence is part of the tumorigenesis barrier imposed by DNA damage checkpoints. Nature. 2006;444(7119):633–637.
26. Sharpless NE, DePinho RA. Cancer: crime and punishment. Nature. 2005;436(7051):636–637.
27. Kang C, et al. The DNA damage response induces inflammation and senescence by inhibiting autophagy of GATA4. Science. 2015;349(6255):aaa5612.
28. Gibbs CP, et al. Stem-like cells in bone sarcomas: implications for tumorigenesis. Neoplasia. 2005;7(11):967–976.
29. Chen YC, et al. Aldehyde dehydrogenase 1 is a putative marker for cancer stem cells in head and neck squamous cancer. Bio-chem Biophys Res Commun. 2009;385(3):307–313.
30. Fujii H, Honoki K, Tsujiuchi T, Kido A, Yoshitani K, Takakura Y. Sphere-forming stem-like cell populations with drug resis-tance in human sarcoma cell lines. Int J Oncol. 2009;34(5):1381–1386.
32. Suvà ML, et al. Identification of cancer stem cells in Ewing’s sarcoma. Cancer Res. 2009;69(5):1776–1781.
33. Glinsky GV. “Stemness” genomics law governs clinical behavior of human cancer: implications for decision making in disease management. J Clin Oncol. 2008;26(17):2846–2853.
34. Ben-Porath I, et al. An embryonic stem cell-like gene expression signature in poorly differentiated aggressive human tumors. Nat Genet. 2008;40(5):499–507.
35. Rho SB, Byun HJ, Park SY, Chun T. Calpain 6 supports tumorigenesis by inhibiting apoptosis and facilitating angiogenesis. Can-cer Lett. 2008;271(2):306–313.
36. Höckel M, Vaupel P. Tumor hypoxia: definitions and current clinical, biologic, and molecular aspects. J Natl Cancer Inst. 2001;93(4):266–276.
37. Petruzzelli R, Christensen DR, Parry KL, Sanchez-Elsner T, Houghton FD. HIF-2α regulates NANOG expression in human embryonic stem cells following hypoxia and reoxygenation through the interaction with an Oct-Sox cis regulatory element. PLoS One. 2014;9(10):e108309.
38. Yang Y, et al. Autophagy regulates the stemness of cervical cancer stem cells. Biologics. 2017;11:71–79.
39. Ran X, Zhou P, Zhang K. Autophagy plays an important role in stemness mediation and the novel dual function of EIG121 in both autophagy and stemness regulation of endometrial carcinoma JEC cells. Int J Oncol. 2017;51(2):644–656.
40. García-Prat L, et al. Autophagy maintains stemness by preventing senescence. Nature. 2016;529(7584):37–42.
41. Chibon F, et al. Validated prediction of clinical outcome in sarcomas and multiple types of cancer on the basis of a gene expres-sion signature related to genome complexity. Nat Med. 2010;16(7):781–787.