i tif c n e C i o c n S f l e a r n e o n i c t e
a 2
nr 0
et 1
1
n I
ISC 2011
Proceeding of the International Conference on Advanced Science,
Engineering and Information Technology 2011
Hotel Equatorial Bangi-Putrajaya, Malaysia, 14 - 15 January 2011
ISBN 978-983-42366-4-9
ISC 2011
International Conference on Advanced Science, Engineering and Information Technology
ICASEIT 2011
Cutting Edge Sciences for Future Sustainability Hotel Equatorial Bangi-Putrajaya, Malaysia, 14 - 15 January 2011
SR
IE AV IUNIT
NI
ESE
D K
O B
IN N
R AG
JA A L S A A E N P M N A A L U A T Y A S
S A I
R
EP
N I
NOI TAI COSSA STNEDUTS NA ISENOD
Organized by Indonesian Students Association Universiti Kebangsaan Malaysia Proceeding of the
Finite Element Analysis of the Effect of Crack Depth
and Crack Opening On the Girder
Md. Kamrul Hassan1, Muhammad Fauzi Mohd Zain2 and Maslina Jamil3
1, 2, 3 Dept. of Civil & Structural Engineering, Universiti Kebangsaan Malaysia,
Bangi-43600, Selangor, Malaysia
E-mail: 1) [email protected]; 2) [email protected] and 3) [email protected]
Abstract— In order to identify the effect of crack depth and opening on the girder, finite element method (FEM) has been used in this
paper. In FE analysis, six nodded two dimensional plane elements (PLANE-2) are considered. Each node has two degree of freedom such as UX and UY. For the plane elements, a plane stress width/thickness option is chosen. For analytical model of crack of the concrete bridge girder, crack opening was increased from 0.2 mm to 1mm at an interval 0.2 mm and crack depth also increased from 30 mm to 150 mm at an interval 30 mm. The models were discreatized by a triangular mesh and convergence test was executed to obtain satisfactory results from the Plane-2 element. From the numerical result, it is seen that the principal stress become a higher with increased the crack depth and also crack opening with respect to load increasing. But the crack depth at 90 mm and crack opening at 0.6 mm, it has more effect on the girder because the stress concentration is higher than other crack depth and opening.
Keywords—Finite Element Analysis, Crack Opening & Crack Depth.
I. INTRODUCTION
Bridge decks are an important component of a bridge’s superstructure. It is directly subjected to the loads induced by passing traffic. It may be deteriorated or damaged in the form of fatigue, slip, debonding and cracks. However, crack phenomenon is more common in the bridge structure and it plays an important role for the structural behavior as well as the durability of concrete bridge structures [1]. Cracks may be either micro-cracks or macro-cracks. Micro-cracks are normally formed due to the shrinkage [2] and it converted to the macro-crack when earthquake, wind, natural disasters or extreme impact of loads act on the structure.
Crack depth as well as crack width is predicted by numerical models. Traditionally, cracked are modeled based either on the smeared crack approach or the discrete crack approach [3]. Researchers [4] first introduced crack modeling in finite element analysis in a discrete manner. The cracks are modeled by separating the nodal points of the finite element mesh and thus creating a discrete crack model as shown in Fig. 1 (a). The smeared crack model that is shown in Fig. (b) , first used by [5] represents cracked concrete as an elastic orthotropic material with reduced elastic modulus in the direction normal to the crack plane and it also represents many finely spaced cracks perpendicular to the principal stress direction. This approxi-
mation of cracking behavior of concrete is quite realistic, since the fracture behavior of concrete is very different from that of metals. In contrast to the discrete crack concept, the smeared crack concept fits the nature of the finite element displacement method, since the continuity of the displacement field remains intact. This approach is simple to implement and is widely used. However, it has nevertheless a major drawback, which is the dependency of the results on the size of the finite element mesh used in the analysis [6]. To the above problem, this paper deals the crack model based on the discrete approach. The use of discrete crack models in finite element analysis offers certain advantages over other methods. For those problems that involve a few dominant cracks, the discrete crack approach presents a more realistic description and correct characterization of strain discontinuities in the structure. Thus, the main objective of this paper is to find out the effect of the crack depth and crack opening on the concrete bridge girder using finite element method.
2. BACKGROUND OF FRACTURE MECHANICS
Fracture is a commonly seen failure mechanism that has been faced by the society since the creation of the earliest man-made structures. However, the formulations of various fracture theories and the understanding of this phenomenon
rapidly accelerated during the 20th century. The incidence of fracture failure is familiar to both small and large infrastructures such as airplanes, automobiles, building, bridge, etc. Again, catastrophic consequences of structural failure are sometimes hard to avoid because the factors involved in predicting fracture are very complex. Fracture mechanics problems can be classified into three categories such as linear elastic fracture mechanics (LEFM), elastic-plastic fracture mechanics (EPFM) and time dependent fracture Mechanics (TDFM) [7]. These classifications are based on the stress-strain curves of the corresponding material behaviour in a specific category as shown in Fig. 2.
In the case of LEFM, inelastic deformation around the crack tip is small compared to the crack and other characteristic lengths. The stress-strain curve is linear and the relevant crack tip parameters are the stress intensity
factor, K and the strain energy release rate, G. The failure of
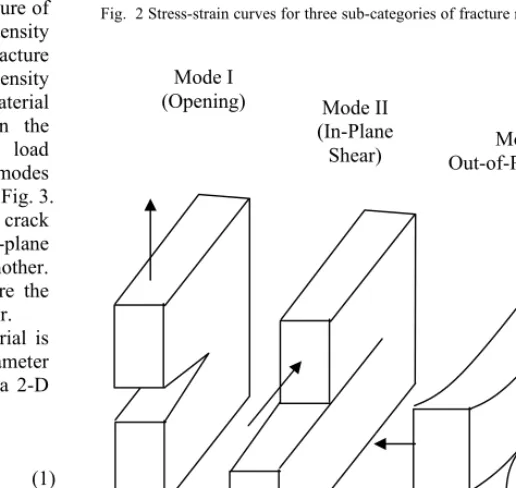
a material is measured by a critical value of stress intensity factor, KIc. This stress intensity factor is called the fracture toughness. For a LEFM problem, when the stress intensity factor becomes critical, a small crack grows and the material fails. The stress intensity factor is dependent on the body geometry, crack size, load level and load configuration. In the literature, there are three basic modes of loading defining stress intensity factors as shown in Fig. 3. Mode I is the opening or tensile mode, where the crack surfaces move directly apart. Mode II is sliding or in-plane shear mode where the crack surfaces slide over one another. Mode III is tearing and anti-plane shear mode where the crack surfaces move out of plane relative to one another.
The stresses near the tip of crack in elastic material is shown in Fig. 4, in which stress intensity factor parameter for Mode I can be related to the stresses in a 2-D material in the following manner:
cos 1 sin sin
2 2 2
2
x k
r
θ θ θ
σ π
⎡ ⎤
⎛ ⎞ ⎛ ⎞ ⎛ ⎞
= ⎜ ⎟⎢ − ⎜ ⎟ ⎜ ⎟⎥
⎝ ⎠⎣ ⎝ ⎠ ⎝ ⎠⎦ (1)
cos 1 sin sin
2 2 2
2
y k
r
θ θ θ
σ π
⎡ ⎤
⎛ ⎞ ⎛ ⎞ ⎛ ⎞
= ⎜ ⎟⎢ + ⎜ ⎟ ⎜ ⎟⎥
⎝ ⎠⎣ ⎝ ⎠ ⎝ ⎠⎦
(2)
cos sin sin
2 2 2
2 xy k r θ θ θ τ π ⎛ ⎞ ⎛ ⎞ ⎛ ⎞ = ⎜ ⎟ ⎜ ⎟ ⎜ ⎟
⎝ ⎠ ⎝ ⎠ ⎝ ⎠
(3)
Fig. 2 Stress-strain curves for three sub-categories of fracture mechanics [8]
Fig. 3 Basic modes of loading in fracture mechanics [9] Fig. 1 Cracking models: a) discrete crack b) smeared crack
Crack
Concrete
Node
(a)
(b)
Linear Elastic Fracture Mechanics (LEFM) Elastic-Plastic Fracture Mechanics (EPFM) Time Dependent Fracture Mechanics (TDFM) Fracture Mechanics
ε
σ
ε
σ
оσ
ε
= fl(
σ
)
ε
= f3(
σ
,
έ
)
ε
σ
έ
Mode I
(Opening) Mode II
(In-Plane
Shear) Out-of-Plane-Shear) Mode III
Fig. 4 Stresses near the tip of crack in elastic material [10 ]
Where,
σ
x is the x-component stress,σ
y is they-component stress,
τ
xy is shear in xy-plane, k is the stressintensity factor and
r
is the radius of curvature of the crack.The principal stresses near the tip of crack in elastic material are to be calculated based on the following equation:
1, 2
2
- - 2
2 2
x y
xy
x y
σ σ σ σ
σ = ± ⎛⎜ ⎞⎟ +τ
⎝ ⎠ (4)
max
2
- 2
2 xy
x y
σ σ
τ = ⎛⎜ ⎞⎟ +τ
⎝ ⎠ (5)
2.0 FINITE ELEMENT ANALYSIS
3.1 Finite Element Modeling
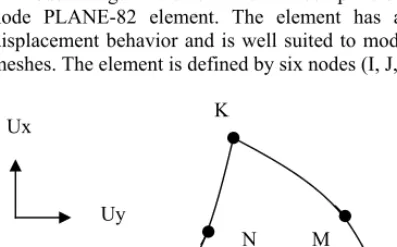
In this paper, finite element analysis is performed based on ANSYS, the finite element software. ANSYS is capable of handling dedicated numerical models for the linear response of concrete under static and dynamic loading. Six nodded two dimensional plane elements (PLANE-2) are used. Fig. 5 shows the PLANE-2 element geometry which is a 6-node triangular element and it is compatible with the 8-node PLANE-82 element. The element has a quadratic displacement behavior and is well suited to model irregular meshes. The element is defined by six nodes (I, J, K, L, M
Fig. 5 PLANE 2 geometry
and N) having two degrees of freedom at each node
translates in the nodal x and y directions such as Ux and Uy
respectively. The element can be used either as a plane element (plane stress or plane strain) or as an axisymmetric element. The element also has plasticity, creep, swelling, stress stiffening, large deflection, and large strain capabilities. The element input data includes four nodes, a thickness for the plane stress option only and the orthotropic material properties.
For the plane elements, a plane stress width/thickness option is considered in which it allows for stress in the perpendicular z-direction, but not strain. This constitutive model is well-suited for applications that model an “infinitely’ deep section like a girder where perpendicular strains are negligible. Small displacement theory is used in conjunction with linear elastic material behavior. The models are discreatized by a triangular mesh to obtain satisfactory results from the Plane-2 element. The mesh size, 57 mm that is setup in finite element modeling of the crack girder and un-crack girder is shown in appendix.
3.2 Model Consideration
The girder bridge of a length (16000 mm), depth (1200 mm) and thickness (500 mm) is considered for the numerical analysis. For analytical model of the concrete bridge`s girder, crack opening is increased from 0.2 mm to 1 mm at a interval 0.2 mm and crack depth increased from 30 mm to 150 mm at a interval 30 mm. Crack is to be formed at the bottom layer of the mid span of the girder because most of flexure cracking normally occurred at mid span regions. The material that considered for the study of bridge girder is assumed as a homogeneous, isotropic and linear elastic behavior. The meditation of the materials properties like concrete is very important for the experimental or numerical analysis. For the numerical analysis using computer programming software like ANSYS requires input data for material properties such as elastic modulus (E), Poisson’s ratio (ν), density, etc. The elastic modulus, E ( MPa ) of concrete is considered based on the measurement of compressive strength using the American Concrete Institute
(ACI) method as follows, 1.5 0.043
c
E=γ × × f′, where γ is
the density (kg/m3) and
c
f′ is the compressive strength
(MPa) of concrete [11]. In this analytical study, the young’s modulus of the material is considered 19350 MPa and the Poisson’s ratio is set as 0.2 according to the bridge design specification. Another important consideration for the simulation model analysis of the crack girder is load. The load is considered as a static load which is applied at the mid span of the girder and its value is increased from 50 kN to 400 kN at an interval of 50 kN.
4. RESULT AND DISCUSSIONS
The results of the element stresses and deflection at crack tip points are taken directly from the values given by Ansys 10. The stresses and deflection results are compared based on the crack and uncrack girder condition. The correctness of the results obtained from the finite element model using six nodded two dimensional triangular plane elements, is verified based on the convergence test. The element number is very important for the accuracy of the x
y
Crack Tip
Crack
xy σy
σx
yx
Ux
Uy
K
I
N M
L
J
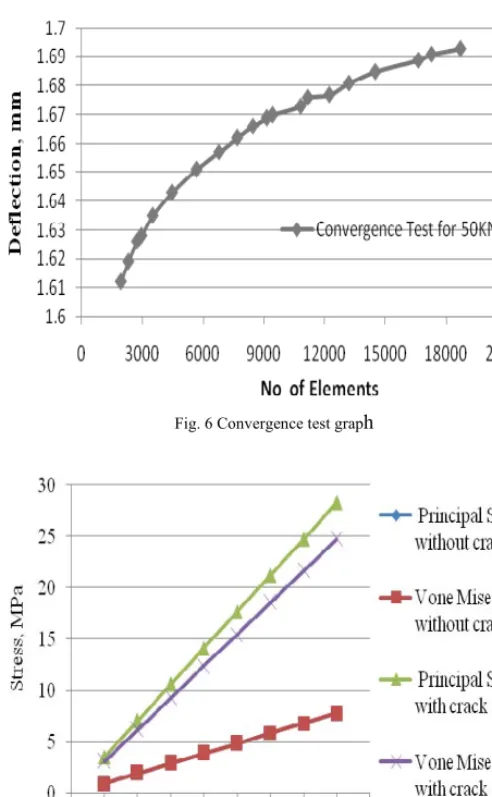
Fig. 6 Convergence test graph
Fig. 7 Comparison of stresses between crack and uncrack girder
results of the finite element analysis. The convergence test result is done based on the 50 kN concentrated static load at the mid span of the girder as shown in Fig. 6. It is observed from the convergence test that the optimum results are obtained in-between the elements 13600 and 16600. The difference of the displacement values within the element range 13600 to16600 is very diminutive. So, in the present study, the total number of element that is considered in each model of crack and un-crack girder for numerical analysis is around 14500 elements. Fig. 7 shows that the value of principal stress and vone-misses stress for the uncrack condition of the girder are same. However, the principal stresses at crack condition of the girder is higher than that of the vone-misses stress. The vone-misses stress is an equivalent stress of the principal stresses (σ1,σ2 and σ3). It is also observed from the Fig. 8 that the principal stress and the vone-misses stress values are increased with increased the crack depth of the girder and applied load. The maximum principal stress as shown in Fig. 8, at load 400 kN for uncrack girder is7.77 MPa and for the 30 mm, 60 mm and 90 mm crack depth girder are 20.84 MPa, 23.56 MPa and
Fig. 8 Comparison between principal stress and vone-misses stress for crack and uncrack girder
Fig.9 Load vs. deflection for 0.2 mm crack opening
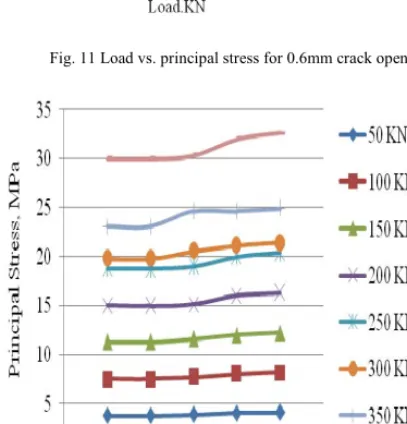
29.97 MPa respectively, where the vone- misses stress for same crack depth girder are18.219 MP, 20.50 MPa and 3026.34 MPa respectively. Fig. 9 shows the deflection value for the different crack depth. It is seen from the Fig. 9 that there is no change of the deflection values with change of the crack depth up to 150 mm for 0.2 mm crack width, but the deflection value increased with increased the load value. It is also observed from the Fig. 10 and Fig. 11 that the increasing rate of principal stress at the crack tip of the girder mid span for 0.2 mm and 0.6 mm crack width or crack opening is higher than that of the un-crack girder with increasing the load values. It means that the principal stress increased with increased the crack depth and crack opening. It is also clear that at the crack condition, the stress at the crack tip of the girder is always several times higher than that of the un-crack condition. Fig. 12 shows the effect of crack opening on the girder. In this analysis, it is observed that there is no significant effect of the crack opening until 0.4 mm, but at 0.6 mm crack opening, the stress is changed then at 0.8 mm crack opening, again the stress is almost same. Fig. 13 illustrates about the results of the crack depth
Fig. 10 Load vs. principal stress for 0.2mm crack opening
Fig. 11 Load vs. principal stress for 0.6mm crack opening
Fig. 12 Crack opening vs. principal stress for 90 mm crack depth
Fig. 13 Crack depth vs. principal stress for 0.2 mm crack opening
effect on the girder. From this figure, it is seen that the stresses are increased for various loading with the crack depth increased. But with the crack depth 90 mm, it has more significant effect on the girder because, at 90 mm crack depth level, the stress changing values are higher than the other crack depth. It is finally said that girder is more unsafe when the crack depth and crack opening propagate to 90 mm and 0.6 mm respectively
3.0
CONCLUSION
Finite element analysis method has been used to identify the effect of crack depth and crack opening on the girder. From the results obtained from the numerical analysis based on the statistic load, it is observed that the principal stress become a higher with increased the crack depth and also crack opening with respect to load increasing. But with the crack depth 90 mm and crack opening 0.6 mm it has more effect on the girder and girder is more unsafe. This is because at this condition the stress concentration is higher than other crack level and the change of the stress is unexpected.
ACKNOWLEDGEMENT
The authors would like to thank to Universiti Kebangsaan Malaysia for the financial support received under the Grant “UKM-GUP-BTT-07-25-150”.
REFERENCES
[1] Theine, Y. and Hofstetter, G. 2009. Numerical prediction of crack
propagation and crack widths in concrete structures. Engineering Structures, Vol.31, No.8, PP: 1832-1840.
[2] ACI 224R-01. Control of cracking in concrete structures.
[3] Galvaz J.C., Cervenka J., Cendon D.A and Saouma V. 2002. Adiscrete crack approach to normal/ shear cracking of concrete. Cement and Concrete Research, vol.32, no.10, pp: 1567-1585. [4] Ngo, D. and Scordelis, A.C. 1967. Finite element analysis of
reinforced concrete beams. Journal of ACI, vol. 64, no. 3, pp. 152-163.
[5] Rashid, Y.R. 1968. Analysis of prestressed concrete pressure vessels.
Nuclear Engineering and Design, vol. 7, no. 4, pp. 334-344. [6] Bazant, Z.P. and Cedolin, L. 1980. Fracture mechanics of reinforced
concrete. Journal of the Engineering Mechanics, ASCE, vol. 106, no. EM6, pp. 1287-1306.
[7] Saribay, M. 2009. Three dimensional elastic-plastic dynamic fracture
analyses for stationary crack using Enriched Elements. (Thesis) UMI Number: 3354774.
[8] Saxena, A. 1998. Nonlinear fracture mechanics for engineers. CRC Press LLC.
[9] Broek D. 1982. Elementary engineering fracture mechanics, 3rd edition, Martinus Nijhoff Publishers.
[10] Anderson, T.L. 1995. Fracture mechanics, fundamentals and
pplications, 2nd edition, CRC Press LLC.
[11] Qinwu Xu , Qinghua Zhou, Cesar Medina, George K. Chang, Dan K. Rozycki.2009. Experimental and numerical analysis of a
waterproofing adhesive layer used on concrete-bridge decks.
International Journal of Adhesion and Adhesive, vol.29, no.5, pp.525-534.
APPENDIX
Fig. 14 Simply supported girder(length, 16000 mm× height, 1200 mm× thickness, 500 mm)
Fig. 15 Crack girder with irregular mesh size