*Corresponding author: Navnath Wayal
ISSN: 0976-3031
Research Article
IDENTIFYING SPATIO-TEMPORAL PATTERN OF LITERACY IN AHMEDNAGAR DISTRICT
Navnath Wayal
1., Nitin Mundhe
2and Suresh Deshmukh
31
Department of Geography, Progressive Education Society's Modern College of Arts, Science and
Commerce, Shivajinagar, Pune, Maharashtra
2
Department of Geography, Sir Parashurambhau College, Pune, Maharashtra
3
Department of Economics, Progressive Education Society's Modern College of Arts, Science and
Commerce, Shivajinagar, Pune, Maharashtra
ARTICLE INFO ABSTRACT
Literacy is a sensitive indicator of cultural advancement of an area. It develops the personality and rationality of individuals, qualifies them to fulfill certain economic, political and cultural functions and, thereby, plays an active part in the socio-economic transformation of a society. According to the 2011, Census of India, Literacy has been defined as “A person aged seven and above, who can both read and write with understanding in any language, is treated as literate”. Lack of literacy breaks the economic, political and all development process of that society or a region. Therefore, present study is focus on identifying spatio-temporal pattern of literacy in Ahmednagar District. This study is to examine the tahsil-wise decadal literacy rate of Ahmednagar District during 1991 to 2011. Ahmednagar District is socio-economically one of the developed districts in Maharashtra. It has attained a relatively good position in literacy as compared to other districts of Maharashtra in 2011 i.e. Beed, Dhule, Jalna, Latur, Nanded, Parbhani, Osmanabad, Solapur and Nandurbar Districts.
INTRODUCTION
Literacy and education plays a vital role in the socio-economic transformation of any region (Sundaram, 1985). The level of education in a community is a good measure of its progress towards modernization. Generally, the higher literacy is a good indicator for the sound economy as well as healthy society. The lower the literacy is hurdle for not only the economy but also the society. Keeping this statement the attempt has been made to identifying spatio-temporal pattern of literacy and to judge the level of socio-economic dimensions of the study area. Today, the literacy is not only sticks its real meaning but also enhanced its level of understanding the society not only its present situations but also capable to assess the future generations through the proper education (Mulimani and Pujar,
2015).
The literacy rate of India in 2011 is 74.04 per cent in the world. India literacy is not good comparison to other developed countries of the world. This is big problem to India and this is challenge for Indian government (Shah, 2013). The male literacy rate is 82.14 per cent and female literacy rate is 65.46 per cent. Kerala have a highest literate state of India. Kerala 93.91 per cent, Mizoram 91.58 per cent, Tripura 87.75 per cent,
Goa 87.40 per cent, Chandigarh 86.43 per cent, Delhi 86.34 per cent, Himachal Pradesh 83.78 per cent and Maharashtra is good literacy rate recorded 82.91 per cent in 2011.
Maharashtra is the third largest state regarding the geographical area and second largest state in respect of population in India
(Mundhe and Jaybhaye, 2014). According to 2011, Census of
India, the literacy rate in Maharashtra has increased from 27.91% per cent in 1951 to 82.91% per cent in 2011. Maharashtra revealed high literacy rates as compared to its neighboring states of Gujarat, Karnataka, Madhya Pradesh and Rajasthan. The levels of literacy vary from district to district in Maharashtra (Bhakare and Hudale, 2011). The highest literacy rate is 90.90 per cent in Mumbai Suburban District. The lowest literacy rate is registered in 63.04 per cent in Nandurbar District during the year of 2011. Present study is focus on identifying spatio-temporal pattern of literacy in Ahmednagar District from 1991 to 2011. Ahmednagar District is socio-economically one of the developed districts in Maharashtra. It has attained a relatively good position in literacy (80.22%) as compared to other districts of Maharashtra in 2011, i.e. Beed, Dhule, Jalna, Latur, Nanded, Parbhani, Osmanabad, Solapur and Nandurbar Districts.
International Journal of
Recent Scientific
Research
International Journal of Recent Scientific Research
Vol. 7, Issue, 12, pp. 14664-14669, December, 2016
Copyright © Navnath Wayal et al., 2016, this is an open-access article distributed under the terms of the Creative Commons Attribution License, which permits unrestricted use, distribution and reproduction in any medium, provided the original work is properly cited.
Article History:
Received 15th September, 2016
Received in revised form 25th
October, 2016
Accepted 23rd November, 2016
Published online 28th December, 2016
Key Words:
STUDY AREA
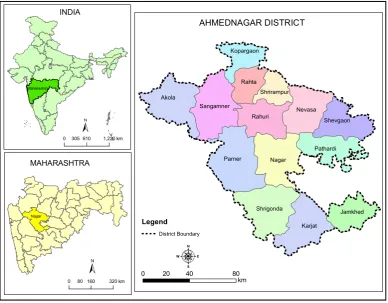
Ahmednagar District popularly known as ‘Nagar’ is one of the important district of Western Maharashtra, which is situated partly in the upper Godavari basin and partly in the Bhima basin. It lies between 18°2' to 19° 9' N latitudes and 73° 9' to 75° 5' E longitudes with the total geographical area of 17410.91 square kilometers (Narke and Kore, 2012). Ahmednagar District is the largest district by area in the state of Maharashtra. Ahmednagar District has 1584 villages, 1 municipal corporation, 9 municipal council, 4041 grampanchayat, 18 urban centers and 1 cantonment board. The district is consisting of 14 revenue tahsil’s namely Nagar, Parner, Pathardi, Newasa, Shrirampur, Shevgoan, Rahuri, Rahata, Sangamner, Kopargaon, Akole, Shrigonda, Jamkhed, Karjat (Figure 1).
According to 2011, Census of India the total population of Ahmednagar District was 4543159 in which male and female were 2342825 and 2200334 respectively. Parner is the largest tahsil by area with 1930.28 square kilometers while Srirampur is the smallest taluka with 569.87 square kilometers in the district. It is bounded on the north by Nasik District, Aurangabad District to the north-east side, Beed District to the east, Osmanabad and Solapur District to the south, Pune District to the west and Thane District to the north-west.
OBJECTIVE
The main objective of the present research work is to identifying spatial pattern and temporal trend of literacy in Ahmednagar District from 1991 to 2011.
DATABASE AND METHODOLOGY
This study is based on secondary data obtained mainly from the publications of Census of India. The main census publications of different periods of time from where data has been collected include the General Population Tables, Socio Cultural Tables, District Census Handbooks of Ahmednagar District, Primary Census Abstract, Final Population Tables etc. In addition to the sources indicated above, information and data have been collected from the Gokhale Institute of Politics and Economics, Pune and Statistical Department, Ahmednagar District. A large number of books, research studies including dissertations, published and unpublished works from different sources have been studied thoroughly for the present study. Relevant web sites were visited from time to time for authentic information and data.
The present research work is an attempt to identify the trends and to explain the regional variations in literacy patterns in Ahmednagar District during 1991-2011. Tehsil has been considered to be the most appropriate unit of study for which data are available. There were 14 tehsils in the district in 2011. At the time of 1971 census, literacy rates were calculated by taking the total population which included children below 7 years; but in 1991 and in the 2001 census, population below 7 years has been excluded from the total population to calculate these rates. The formula for computing crude literacy rate and effective literacy rate are as follows (Trewartha, 1953; Clarke,
1965; Ghosh, 1998; Chandana, 2004).
Number of literate person
Crude Literacy Rate = --- X 100 Total Population
Figure 1 Location Map of Study Area
Maharashtra
Nagar
Parner Nagar Akola
Karjat Rahuri
Shrigonda
Nevasa Sangamner
Pathardi Rahta
Shevgaon
Jamkhed Kopargaon
Shrirampur
AHMEDNAGAR DISTRICT
INDIA
MAHARASHTRA
0 305610 1,220km
0 80 160 320km
0 20 40 80
km
Legend
Number of Literate persons aged 7 and above
Effective Literacy Rate = --- X 100 Total Population aged seven and above
RESULTS AND DISCUSSION
Spatio-Temporal Variation of Literacy in India, Maharashtra and Ahmednagar
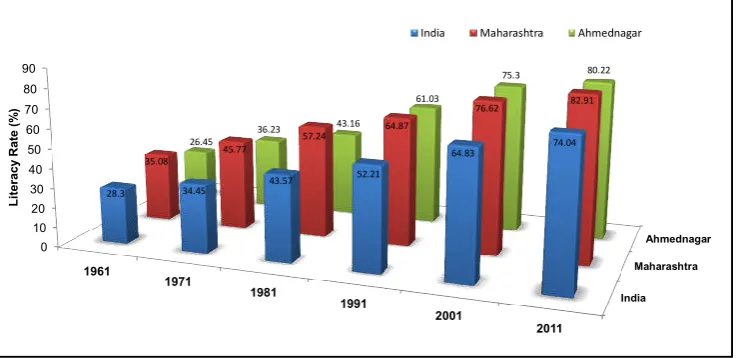
India is the second largest country after China in population and is projected to cross China’s population with 1.6 billion by 2050. The total number of population has increased from 23.84 crores in 1901 to 121 crores in 2011 (Mundhe and Jaybhaye, 2014). Whereas literacy rate of India has increased from 28.3 percent in 1961 to 74.04 percent in 2011 (Table 1). India’s literacy rate at the time of independence was mere 14 percent, after 1991, difference of literacy rate from 1991 to 2001 was near about 13 percent that is highest among all last five decades. Over the years, literacy rate has been increasing but with varied rates in different states namely like Kerala and Mizoram well above national average and Bihar with a depressing rate of 63.8 percent.
Literacy in Maharashtra was never below the national average during the period 1961-2011 due to improvement of educational facilities especially in the growing rural areas. In Maharashtra, literacy rate improved from 35.08 percent in 1961 to 82.91 percent in 2011 but there were large regional variations (Figure 2).
As per 2011, Census of India, the highest literacy rate recorded such as Mumbai Suburban (90.9%), Nagpur (89.52%), Mumbai City (88.48%) and Amaravati (88.23%) Districts. The very low literacy rate observed in the Nandubar (63.04%) and Gadchiroli (70.55%) Districts of Maharashtra due to large concentration of tribal population, inadequate education facilities, rugged topography and difficult terrain as compared with the rest of the state.
Literacy in Ahmednagar District was never cross the state average from the period of 1961 to 2011 (Table 1). In 1961, there were only 26.45 percent literate person, out of them 39.36 percent was male literacy and 13.02 percent was female literacy. However, after 1991, 2001 and 2011 literacy rate was increased rapidly by 61.03 percent, 75.30 percent and 80.22 percent respectively. The male and female literacy also increased in last three decades. According to 2011, Census of India, the highest literacy rate observed in Nagar (86.35%) Tehsil due high degree of industrialization and urbanization and lowest literacy rate was recorded in Jamkhed (72.62%) and Karjat (74.11%) Tehsil due to lack of educational facilities (Table 2).
Table 1Trend of Literacy in India, Maharashtra and Ahmednagar from 1961-2011
Census
Year India Maharashtra Ahmednagar
Total Literates (%)
1961 28.3 35.08 26.45 1971 34.45 45.77 36.23 1981 43.57 57.24 43.16 1991 52.21 64.87 61.03 2001 64.83 76.62 75.30 2011 74.04 82.91 80.22
Source: Census of India, Census Handbook from 1961-2011
Census of India, 1991, 2001 and 2011 Maharashtra: General Population Table part II-A Series
Census of India, 1961, 1971, 1981, 1991 and 2001 Maharashtra: Primary Census Abstract
Socio-Economic Abstract, Ahmednagar District -2013
Figure 2 Trend of Literacy in India, Maharashtra and Ahmednagar
India Maharashtra Ahmednagar 0 10 20 30 40 50 60 70 80 90 1961 1971 1981 1991 2001 2011
28.3 34.45 43.57
52.21 64.83 74.04 35.08 45.77 57.24 64.87 76.62 82.91 26.45 36.23 43.16 61.03 75.3 80.22 Li terac y Rate (% )
India Maharashtra Ahmednagar
Table 2 Tahsil-wise Literacy in Ahmednagar District from 1991- 2011
Sr. No Name of
Tahsil Total Literates (%)*
1991 2001 2011
1 Akole 49.66 69.95 74.86 2 Sangamner 76.18 75.46 79.96 3 Kopargaon 70.70 74.63 79.84 4 Rahta - 78.25 82.08 5 Shrirampur 68.76 77.96 82.12 6 Nevasa 57.09 73.83 78.51 7 Shevgaon 54.75 70.05 73.94 8 Pathardi 68.15 70.43 74.74 9 Nagar 81.96 84.64 86.35 10 Rahuri 69.65 75.59 79.74 11 Parner 56.46 71.51 75.64 12 Shrigonda 67.64 73.44 76.25 13 Karjat 53.35 71.22 74.11 14 Jamkhed 51.52 67.79 72.62
District Total 61.03 75.30 80.22
Source: Census of India, Census Handbook from 1991-2011
Spatial Patterns of Literacy in Ahmednagar District: 1991-2011
The present research work is an attempt to identify the spatial pattern of literacy rate in Ahmednagar District during 1991-2011. Tehsil has been considered the most appropriate unit of for analysis of available data. In Ahmednagar District, there were 13 tehsils in 1991 and 14 tehsils in 2011. There are five types of areas have been identified for literacy rate based on district average as given below.
1. Region of Very Low Literacy Rate (below 65%) 2. Region of Low Literacy Rate (66 - 70 %) 3. Region of Moderate Literacy Rate (71 - 75 %) 4. Region of High Literacy Rate (76 - 80 %) 5. Region of Very High Literacy Rate (above 81%)
Region of Very Low Literacy Rate (below 65%)
In 1991, the literacy rate was less than 65 percent found in Akole (49.66%), Jamkhed (51.52%), Karjat (53.35%), Shevgaon (54.75%), Parner (56.46%) and Nevasa (57.09%) mainly due to high proportion of rural population and lack of irrigation facilities, drought prone area, less productivity of the soil and socio-economic development (Figure 3). In 2001 and 2011, Ahmednagar District there are no single tahsil having less than 65 percent literacy in this category.
Region of Low Literacy Rate (66 - 70%)
In 1991, the literacy rate between 66 - 70 percent observed in Shrigonda, Pathardi, Shrirampur and Rahuri because of poor education facilities like nursery, primary, secondary, higher
Figure 3 Pattern of Literacy in Ahmednagar District, 1991
secondary schools and colleges. In 2001, there were only two tehsil observed in this category namely Jamkhed (67.8%) and Akole (70%) due to hilly region and concentration of tribal population. However, in 2011 there was no single tehsil in this category.
Region of Moderate Literacy Rate (71 - 75 %)
Moderate literacy rate is observed in Kopergaon (70.7%) tehsil in 1991. As per 2001, Census of India there were seven tehsils under this categories like Pathardi, Karjat, Parner, Shrigonda, Nevasa and Kopargaon tehsils (Figure 4). Also during 2011, Akole, Karjat, Jamkhed, Shevgaon and Pathardi observed in this category (Figure 5).
Region of High Literacy Rate (76 - 80 %)
Ahmednagar District is predominantly developed in character, where agricultural and industrial development is at its peak, which is reflected in the level of literacy. Educational status is very strong in Ahmednagar District because educational facilities are available for playgroup to traditional, medical, engineering, agricultural colleges as well as universities and sub center of Savitribai Phule Pune University. Out of 14 tehsils 8 tehsils i.e. almost 60 per cent were in the region of high literacy rate. In 1991, there was only Sangamner (76.2%) tehsil found high literacy rate (Figure 3). In 2001, Rahta, Shrirampur, Rahuri, tehsils were added (Figure 4). During 2011, Sangamner (80%), Kopargaon (79.8%), Rahuri (79.7%), Nevasa (78.5%), Shrigonda (76.3%) and Parner (75.6%) tehsils are observed high literacy rate due to better irrigation facilities as compare to other thesils and agricultural and industrial development.
Region of Very High Literacy Rate (above 81%)
During 1991 and 2001, only one Nagar tehsil is observed in very high literacy rate. The average literacy rate is 80.22 percent in 2011 (Table 2). Out of them 88.81 percent male and 71.15 percent female is literate. The tehsils like Nagar, Rahata and Shrirampur tehsils shows very high literacy rate than the average literacy rate of the district. Figure 5 show that, the highest literacy rate in recorded in Nagar (86.35%), tehsil in 2011 because the maximum population lived in the Nagar urban sector, followed by Rahata (82.12%), Shrirampur (82.12%).
In the above tehsils, the literacy rate is high due to increasing educational facilities, higher urbanization, industrial development, irrigation facilities, commercial agricultures and the development of transportation facilities in the surround area.
CONCLUDING REMARK
India, Maharashtra and Ahmednagar District have witnessed positive and significant increase in literacy in period of 1961 to 2011. After independence period witnessed out character growth rate because of proper planning and implementation efforts of Government and Non-government organizations (NGOs).
Spatio-temporal pattern of literacy discloses a progressive but unequal trend for all the tehsils in the study area. The tehsil in the central prosperous belt denoted very high literacy rate, while eastern and western side tehsils having geographical barrier and concentration of tribal population witnessed poor literacy rate. This kind of disparity in the field of literacy is
serious problem in the study area, which needs an immediate attention and long-term action plan. In the context, the result of the present research work proves of immense importance of planners, researchers, administrator, educationist and decision makers.
References
Bhakare P. and Hudale S., 2011: Spatio-temporal Patteren of Literacy in Pune Division, The Goa Geographer, Vol. VIII: 90-98.
Census of India, 1961 to 1991
Census of India, 2011: Final population totals series 1: India Registrar General and Census
Commissioner India.
Chandana R. C., 2004: Geography of Population Concept Determinants and Pattern, Kalyani Publishers Pvt. Ltd., New Delhi.
Clarke J.I., 1965: Population Geography, Pergamon Press, Oxford, pp. 1- 6.
Ghosh B. N., 1998: Fundamentals of Geography of Population, Sterling Publisher Pvt. Ltd. New Dehli, 28. Mulimani A. A. and Pujar, L. M., 2015: Spatial Disparity of
Rural-Urban Literacy in Haveri District, Research Directions, Vol. 3 (6), pp.1–10
Mundhe N. N. and Jaybhaye, R. G., 2014: Monitoring Level, Trends and Patterns of Urbanisation In Maharashtra (1991-2011), Indian Streams Research Journal, Vol. 4 (6), pp.1–12. URL: http://www.isrj.net/ViewPdf.aspx? ArticleID=5089
Narke S. Y. and Kore N. S., 2012: Trend of literacy pattern in Ahmednagar District (Maharashtra), Ultra Scientist, Vol. 24 (1B), pp. 203-209.
Shah N. R., 2013: Literacy Rate in India, International Journal of Research in all Subjects in Multi Languages, Vol. 1 (7), pp.12-16.
Sundaram K.V., 1985: Population Geography, Contribution to Indian Geographer -VI (Ed).
Trewartha G. T., 1953: A Case for Population Geography', Annals of the Association of American Geographers, Vol. 43, pp.79-97.
Yadav S., 2009: Regional Inequalities in the Levels of Literacy and Its Determinants in Uttar Pradesh, Geographical Review of India, Vol. 71 (1), pp.85-90.
Websites
http://en.wikipedia.org/wiki/Maharashtra. https://mahasdb.maharashtra.gov.in
http://www.censusindia.net OR censusindia.gov.in/2011. https://en.wikipedia.org/wiki/Talukas_of_Ahmednagar_district
*******
How to cite this article: