A Life Cycle Assessment of the Environmental Impact of
Cruise Holidays
Dr Richard Farr
Senior Lecturer (Partnerships)
University of Bolton
r.farr@bolton.ac.uk
Christine Hall
Programmes Validation Manager
University of Bolton
c.hall@bolton.ac.uk
Abstract
Despite difficult economic conditions in recent years, the cruise industry has continued to grow strongly. Questions remain, however, as to the environmental impact of a cruise holiday. The noxious nature of the fuel employed, the sheer quantity required, and the effects of various discharges from vessels at sea are among the issues that impact upon the ‘green’ performance of the industry.
Although the media have been quick to criticise various aspects of the industry in recent years, little research has been done to quantify the actual level of environmental harm caused by the industry. In this paper the authors describe the application of Life Cycle Assessment to produce a model of contributions to climate change that is compared with the impact of a holiday spent ashore.
Keywords
Sustainable tourism, life cycle assessment, carbon footprint, cruise holiday
1. Introduction
The pursuit of sustainability requires that environmental impacts are assessed to determine the modes and levels of harm associated with activities, including tourism. Many different modes of environmental harm exist, but the one most widely recognised is the “carbon footprint”, or contribution to climate change. A variation in weather patterns over the long term, this has a number of causes including volcanic activity and changes in solar activity, but today there is a strong consensus that human activity is a major contributory factor. As the National Resource Council [2010: 2] stated, “Climate change is occurring, is caused largely by human activities, and poses significant risks for a broad range of human and natural systems.”
Leslie [2012] describes transportation as tourism’s ‘Achilles heel’ since it is responsible for such a large part of the contribution to climate change. Transnational organisations such as UNWTO [1999] and UNEP [2009] concur; their efforts to calculate the carbon footprint and thereby encourage sustainability in tourism focus upon air travel, and to a lesser extent rail travel. For a holiday that largely involves staying in one place the assumption that most of the carbon dioxide (CO2) emissions will result from travel to and from the destination is
reasonable, but this fails to encompass cruising, where travel continues throughout the holiday. In fact, while many cruise holidays begin and end with an element of air or rail travel, as with other holiday types, the research presented in this paper demonstrates that it is the cruise itself that makes the holiday’s largest contribution to climate change.
Ward [2010] suggested a figure for greenhouse gases resulting from cruise holidays: 960kg CO2 emitted per passenger, for a one-week cruise. For context, the World Bank [2015] estimated UK carbon emissions per capita for 2010-2014 to be 7,900kg per year, or 152kg CO2 per week – suggesting that a week spent cruising entails approximately 6.3 times as much of a contribution to climate change as a week spent at home.
Unfortunately, the process by which Ward’s [2010] figure was arrived at is not specified. It may be derived solely from the fuel consumption of the ship – an aspect that is responsible for a formidable quantity of CO2 emissions, but which overlooks the operation of what is
effectively a floating five-star hotel and leisure complex. The construction and maintenance of the ship (more difficult than for a land-based equivalent) must also be considered.
Rather than simply seeking to confirm or reject the figure of 960kg CO2 per passenger per week, the authors aimed to produce an itemised carbon footprint through the application of Life Cycle Assessment, a technique more commonly seen in manufacturing and engineering. This was achieved with a parameterised model that could be used to explore the specific problems associated with various components of a cruise holiday.
2. Methodology
In order to allow calculations of environmental impact, a mathematical model has been created in which a cruise holiday aboard a fictional cruise ship, the MS Exemplar, is specified. The vessel exists as a set of values that are referenced by formulae in a Microsoft Excel spreadsheet. The model, built according to the principles set out in the PAS2050 standard [BSI, 2008] demonstrates a full ‘cradle-to-grave’ assessment, taking account of the materials employed in the construction of the ship, and the shipbuilding process itself, with the
resulting harm being amortised over the total number of passengers carried (making use of estimates of the useful life of the vessel, and the level of occupancy). Fuel, food and drink consumed are taken into account, and materials recovered for reuse at the end-of-life are discounted. The result is a measure of CO2e per passenger, per day and for a whole cruise of a specified duration. (The ‘e’ denotes CO2 equivalency, and is a standard approach among sustainability practitioners, recognising that there are a number of different greenhouse gases such as nitrous oxide, methane and sulphur hexafluoride, in addition to CO2, that all play a role in anthropogenic climate change [Samson, 2014]).
The authors note that cruising involves other modes of environmental harm that do not directly affect climate change, such as the emission of carcinogenic particulates, and the dumping of sewage and other wastes while at sea; these are discussed briefly in Section 4, but do not form a part of the present model; only climate change potential is quantified.
2.1 Sources of Information Employed
the assessment of a wide range of operations, processes and materials in terms of their carbon footprint. Equipped with this information, once the mass and/or cost of the various things that make a cruise holiday possible were determined, it became possible to calculate each
element’s contribution to climate change.
To achieve this inevitably involves a degree of simplification. For example, it is assumed that all passengers bear equal responsibility, despite the fact individuals will differ in terms of their diet, the level of occupancy in each cabin, etc. Furthermore, one cruise might differ from another in terms of the itinerary, because longer sailings between ports of call would equate to more energy use, and cruise itineraries that incorporate ‘sea days’ indicate higher emissions still. A transatlantic crossing that includes six sea days would contribute significantly more than a seven-day Western Mediterranean cruise package, with perhaps four ports of call and two sea days. Since the model is parametric in nature, many such variables can be set, allowing their contribution to be explored. This may in the future allow the model to be employed in the gathering of additional information; the assumptions incorporated into the ‘base model’ are detailed in Section 2.2.
2.2 Assumptions in the Model
A number of assumptions have been made in the construction of the model, any of which might later be refined as more accurate data become available. These are reviewed in the subsections that follow.
2.2.1 Embodied Material
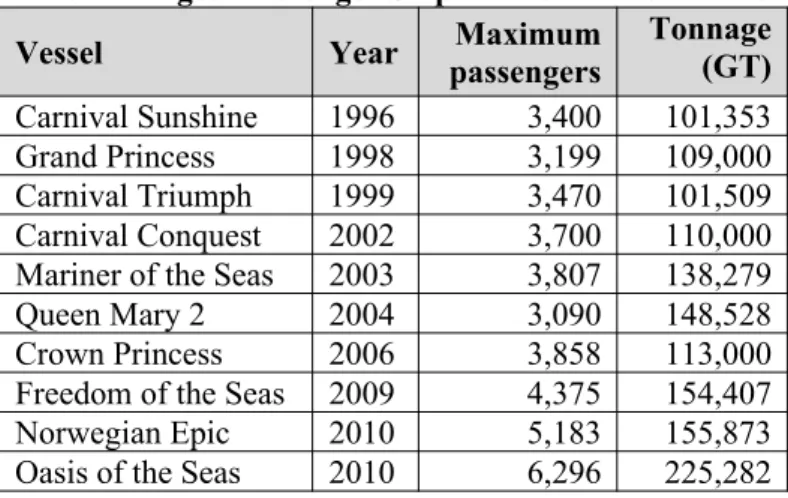
The quantity of material used to construct the ship directly affects the CO2e emissions that result, but this information proved difficult to obtain in the absence of documentation from the shipbuilder. Displacement is the literal weight of the ship, but this is seldom recorded: ships are registered by their Gross Tonnage, a synthetic and highly complex assessment of enclosed volume to which no unit of measure is assigned. The approximate displacement of some vessels is revealed in promotional literature, however: it is reported that the Queen Mary 2 weighed approximately 76,000 tons [Wagner, 2006], while the Oasis-class ships weigh approximately 100,000 tons [Schnepf, 2010] – 68,946 and 90,718 metric tonnes, respectively. Since the Queen Mary 2 is a liner, not a cruise ship, her construction differs and displacement per passenger is higher: thus the figure for an Oasis-class ship was preferred. At 90,718 tonnes and carrying up to 6,296 passengers, this is 14.4 tonnes per passenger berth. If anything, this establishes a lower limit for the embodied material per passenger berth because it is unlikely that all cabins will be at full occupancy. Also, a modern ship such as the Oasis will tend to be more efficient in terms of its construction. Table 1 illustrates the industry trend towards larger vessels, while Figure 1 is included in order to show just how large a cruise ship can be.
Table 1: Largest Passenger Ships at the Time of Launch
Vessel Year passengersMaximum Tonnage(GT)
Figure 1: Size of an Oasis-class Cruise Ship
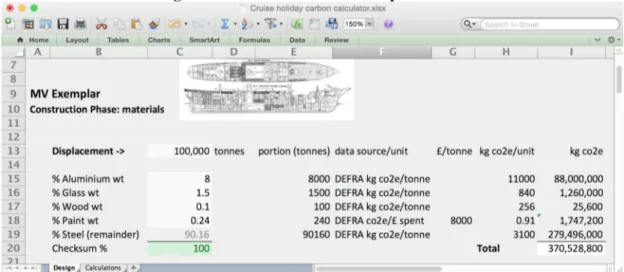
In the model, both displacement and maximum passengers can be entered for the MS Exemplar, a warning being displayed if the resulting embodied material per passenger is implausible. The mass of the vessel is then apportioned between a simplified set of five materials; aluminium, glass, wood, paint and steel. Each has consequences for CO2e, as given in the DEFRA [2012] Conversion Factors: for example, the production of steel involves 3,100kg CO2e per tonne, while aluminium is 11,000kg CO2e per tonne. Based upon this information, and an assumption regarding the breakdown of materials in a cruise ship (Figure 2), it is estimated that the contribution to climate change from the materials embodied by an Oasis-class ship is around 370,500 tonnes CO2e.
Figure 2: Detail from the Excel Spreadsheet
2.2.2 Construction Process
It proved impossible to obtain any information on the sequence of shipbuilding processes employed, so a more simplistic approach had to be employed. The DEFRA [2012]
Conversion Factors give a blanket figure for “other transport equipment” including ships at 0.76 kg/CO2e per pound spent; Nugent [2009] and others have reported the cost of Oasis of the Seas as being $1.4bn. Using an approximate historical exchange rate of £1 = $1.80 for early 2006, when the Oasis was ordered, ship construction equates to a little over 591,000 tonnes of CO2e. This admittedly crude estimate was the best that could be produced in the absence of detailed information on the total energy bill incurred when building, launching and fitting out a large cruise ship. (There is provision within the model for refinements to be incorporated as and when the information becomes available; this is information that the naval architect, shipbuilder or cruise line would already have.)
Obviously, the CO2e for embodied material (see Section 2.2.1) is not added to this figure, as that would mean double-counting the materials. Those calculations remain a part of the process because it is hoped that in the future, better information about the construction process will allow an itemised breakdown to be produced. Also, it facilitates calculations relating to the end-of-life (see Section 2.2.4).
2.2.3 Vessel Operation
In addition to that arising from construction, the day-to-day operation of a cruise ship involves a contribution to climate change, with the most significant input being fuel
consumption. Modern cruise ships make their own fresh water, but food and drink are another input with carbon consequences. (The authors have considered such consumables to be analogous to those in a five-star hotel.)
The fuel is typically heavy fuel oil (HFO), used to generate the power that moves the ship and runs the on-board systems of which air conditioning is the most energy-intensive. Firm figures for consumption are a little difficult to derive because the industry measures fuel usage in tons, while information meant for the public is often expressed in gallons (imperial or US). Furthermore, some ships are equipped to use marine grade diesel or liquefied natural gas (LNG) – or a dual-fuel combination. Some will change the fuel used when in port, and some cruise lines practice “cold ironing” – getting electricity from a land-based supply while docked.
Much of the fuel usage information in the public domain is anecdotal, or incomplete. Alpeche [n.d.] reviewed this, suggesting a typical consumption of 140–150 tons (127 – 136 tonnes) of HFO per day. (Industry commentators often use a passenger capacity of around 3,000 as a typical figure.) Freedom of the Seas, a relatively large but more efficient ship, is reported to consume 2,800 gallons (9.1 tonnes) of fuel per hour when in motion [Alpeche, n.d.], which would seem to support this fuel consumption estimate. DEFRA [2012] uses a figure of 3766.5 kg CO2e per tonne for HFO consumption, so the daily use of 127 tonnes of fuel would equate to 478.3 tonnes of CO2e emitted per day. If we assume this is shared between 3,000
passengers, this means each passenger is responsible for the emission of 1,116 kg CO2e in the course of a week-long cruise. This exceeds Ward’s [2010] figure of 960kg CO2 emitted per passenger, but the difference can be accounted for: if we confine ourselves to CO2 (not all greenhouse gases as under CO2e) and look only at direct emissions (the burning of the HFO, not including associated harm from its extraction, refining and transportation) the DEFRA [2012] standard is 3205.5 kg CO2 emitted per tonne used, which makes a passenger’s fuel-only contribution to climate change 950 kg CO2 per passenger per week – a close match to the Ward [2010] figure.
2.2.4 End-of-Life
longer-lived products are generally more ‘green’, and ships perform well in this regard with a lifespan that can be measured in decades.
Ultimately, a ship will typically be broken up, such that any valuable materials can be reclaimed. This process of reclamation can introduce additional environmental problems of contamination and perhaps health hazards from materials such as asbestos, but these do not impact directly upon climate change, and so are not addressed in this study. (Taylan [2013] describes ship breaking in considerable detail.)
The expected useful life of the MS Exemplar is specified as a variable within the Excel model, as is the proportion of materials recovered. The DEFRA [2012] Conversion Factors detail savings for recycling including 1,300 kg CO2e for ferrous and 9,000 kg CO2e for nonferrous metals, and these have been incorporated into the model, significantly reducing environmental impact from embodied material.
2.3 Calculations Performed in Summary
The model described addresses four phases of a product lifecycle; sourcing raw materials, construction, the use phase, and the end-of-life. The CO2e associated with materials and construction, and the ‘discount’ received by recycling at the end-of-life, are one-off entries, and are apportioned over the entire life of the cruise ship. Thus, if MS Exemplar (a ship of 50,000 tonnes displacement, carrying 3,000 passengers on average) operates a week-long cruise, fifty weeks a year for twenty-five years, the contribution to climate change from the ship itself must be divided by 3,750,000 (3000 x 50 x 25) to find each passenger’s personal share. Naturally, this amortisation across the whole lifespan makes the impact from the ship itself relatively small, at something like 63.5kg CO2e per passenger per week – assuming a 95% recycling rate for the vessel’s major materials.
To this is added the personal share of CO2e resulting from ship operations. The major element is that of fuel usage, suggested in Section 2.2.3 to be 1,116 kg CO2e per week; other
necessary additions to arrive at a final figure include the contribution to climate change from hotel operations and services performed on board, the CO2e footprint resulting from transport to and from the cruise ship, and that of any excursions undertaken. These are reviewed in Section 3.
3. Model Elements Derived from Land-Based Holidays
The land-based equivalent contribution to climate change for a hotel guest is not merely useful for the purposes of comparison; it provides information that can be used to complete the cruise model, since the harm resulting from the provision of food and drink, etc. are broadly similar for both types of holiday.
A working group was established in 2011 to enhance understanding of the impacts of the hotel industry. Underpinned by the Green House Gas Protocol Standards [World Resources Institute, 2011], the Hotel Carbon Measurement Initiative (HCMI) [WTTC, 2012] was piloted in a variety of different styles and sizes of hotel in several destinations. It was designed to be applicable to any accommodation in any location, and in many ways it matches the
parameters of a stay in a cruise ship cabin.
providing space for up to 800 delegates. This type of land-based hotel and its level of facilities equate, in terms of the star rating, to a cruise ship of the kind typified by the MS Exemplar, matching Mintel’s [2014] classification of a cruise ship as hotel-at-sea.
Vij and Vij [2012] report that many independent hotels only adopt a limited approach to sustainable practices, but large hotel chains do research sustainability-themed information in order to support their Corporate Social Responsibility marketing initiatives. When
considering the cruise ship as a holiday product, it is useful to apply the same standard as for a land-based hotel delivering a hospitality product that matches the experience found on a cruise vessel.
The Accor Group describes itself as being committed to responsible expansion utilising its Planet 21 program strategy, based upon the HCMI approach [Accor Group, 2011]. Measured under this initiative, energy use per available room, per day is reported to be 71.1 kWh. This figure includes a share for public spaces, utilities and so on, and is therefore suited to comparison with the ‘per passenger’ measures produced in Section 2. In assessing energy usage Accor Group [2011] monitors the full range of greenhouse gases (reporting CO2e, not just CO2) and accounts separately for site energy (66%), air conditioning (12%), food and beverage (14%) and employee travel (8%). This is useful because it ensures that air
conditioning is not double-counted within the cruise model, since this is already covered by overall fuel usage.
We can derive a figure for CO2e from the stated Accor Group [2011] energy use per available room, per day. Here the authors use information taken from Annex 10 of the DEFRA [2012] tool, since the electricity used does not come from the UK national grid: Spain derives a greater proportion of its energy from renewables, resulting in emissions of 0.48847kg CO2e per kWh. This suggests that 71.1 kWh in Spain involves the emission of 34.7 kg CO2e.
From this and the other information provided by Accor Group [2011] it is simple to
extrapolate the CO2e associated with other elements of the hotel product: assuming average room occupancy of 1.2, the total CO2e per guest is found to be 43.9 kg CO2e. Of particular value is the contribution to climate change arising from food and beverages, since this can be used to inform the cruise model. At 14% of total emissions from an Accor Group [2011] hotel, the food and drink-related CO2e emissions are around 7.37 kg CO2e per room, per day. Assuming average room occupancy of 1.2, this yields daily emissions of 6.14 kg CO2e per person, for food and beverages.
The equivalent figure for a cruise ship ought to be higher, given the much greater likelihood that three meals a day are consumed on-board, the relative difficulty of making deliveries of fresh produce to a ship, and the fuel source from which on-board electricity is derived. For these reasons, the authors chose to use a figure of 12 kg CO2e per passenger, per day.
3.1 Transportation to and from the Point of Embarkation
3.2 Excursions
Shore excursions make up an additional part of the cruise holiday, with all cruise operators offering a variety of excursion options at ports of call. Many week-long cruise itineraries will include at least four ports of call, where excursions offer a mini-package of tourist activities, varying from port to port. They will encompass a range of attractions within a driveable distance of the port, all being provided at additional cost to the cruise passenger. The types of tourist activities selected and packaged will depend upon the type of cruise tourist market being catered for; in the case of Barcelona as a port of call, P&O Cruises offers fourteen excursions with durations from two hours for a flamenco music experience, to an eight-hour visit to Girona [P&O Cruises, 2015], a ninety-minute drive from Barcelona. In virtually every case cruise passengers will be provided with transportation as part of the shore excursion, even for short distances generally viewed as walkable by able-bodied tourists. (The cruise passenger’s contribution to climate change, when visiting an attraction as part of a shore excursion, may well be higher than for the typical day tourist visiting the same
attraction, who will most likely be on foot, or on public transport.)
Within the model, details of a number of excursions can be specified, but calculations are only performed upon the transport element. (Each involves a coach journey, and DEFRA [2012] assign a figure of 0.03641 kgCO2e per passenger kilometer.) To model the CO2e associated with specific activities, ranging from art galleries to theme parks, would be prohibitive – and in any case the origin of the tourist, whether from a cruise ship or a hotel, does not make a difference to the resulting environmental harm.
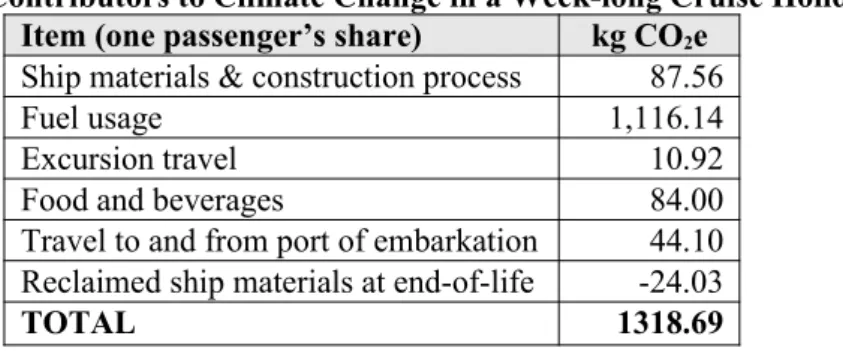
With excursions detailed in the model, the figure for CO2e per passenger week is complete: adding together the contributions from a passenger’s share of ship construction (less CO2e saved through recycling at the end-of-life), ship operation, travel, and food and beverages provided, the final figure for CO2e per passenger is determined. Table 2 shows the results, based upon MV Exemplar carrying 3,000 passengers:
Table 2: Contributors to Climate Change in a Week-long Cruise Holiday Item (one passenger’s share) kg CO2e
Ship materials & construction process 87.56
Fuel usage 1,116.14
Excursion travel 10.92
Food and beverages 84.00
Travel to and from port of embarkation 44.10 Reclaimed ship materials at end-of-life -24.03
TOTAL 1318.69
The Accor Group [2011] information yielded a total figure, per guest, of around 43.9 kg CO2e per day, which is to say 307.3 kg CO2e per week. This does not include international travel, excursions, nor hotel construction (although building in masonry is far less carbon-intensive than shipbuilding). The inescapable fact, however, is that it is the fuel used by a cruise ship’s engines that contributes the most towards climate change.
4. Discussion of Results Obtained
are considered: in its current form the model does not address vessel maintenance and occasional refits, and services such as those provided by a travel agent might also cause a small addition to the total.
The contribution to climate change as calculated is not meant to imply that this is the best the industry is capable of; technical developments and changes to practices continue to offer improvements, both in the form of reduced consumption and cleaner emissions. Without making changes to the vessels in use, operators could still achieve immediate improvements against CO2e per passenger through such simple practices as changing itineraries to reduce sea days and distances between ports of call, increasing occupancy and perhaps sailing a little more slowly in order to save energy.
The fuel use issue is a complex one because carbon dioxide equivalence does not address the issue of air quality: sulphur dioxide emissions resulting from the burning of HFO are linked with respiratory problems and acid rain [Farr et al, 2013]. Responses include restrictions on the use of conventional HFO in sulphur emission control areas [Kalli et al, 2009], bans on the use of HFO while in some ports, and so on. The use of LNG improves performance in terms of both air quality and CO2e [Afon and Ervin, 2008], and Peckham [2013] reports that engines that can burn multiple fuel types may be attractive to ship owners in a changing regulatory environment.
Although the results obtained from the model suggest that cruising is particularly harmful in terms of its contribution to climate change, there is no immediate danger that regulation will significantly impact upon cruise operators. In fact, the open registry system means that vessels operate under a very lax set of laws as Wing [2003: 176] explains: “... nations whose open registries have become the most popular also tend to be those who possess the most lax labour, safety, and environmental codes.” Realistically, in such a weak legislative
environment, the possibility that cruise lines’ operations might be curtailed on the grounds of contribution to climate change is remote. Vessels may, however, be banned from entering certain areas, or limited in terms of the fuels that can be used, due to air quality issues related to sulphur and particulates. There also remains the question of damage to the industry’s image in an increasingly carbon-conscious society. Whether present-day cruise passengers don’t know about the contribution to climate change from cruising or don’t care is unclear.
Discussions relating to vessels’ fuel consumption appear from time to time on Internet cruise forums, but these are generally sparked by a fuel price surcharge. In such a community fuel consumption is seldom, if ever, associated with emissions.
In addition to their fuel consumption and emissions that affect air quality, emissions of concern include those discharged while at sea such as sewage, grey water and (treated) oily wastewater. Furthermore, the discharge of ballast water can introduce invasive species into fragile ecosystems. Table 3 shows the approximate quantities of waste generated by a cruise ship of 2,200 passengers in the course of a week, based upon an assessment by Klein [2009].
Table 3: Summary of Typical Weekly Cruise Ship Emissions, based on Klein [2009]
Category Total quantity perweek Per passengerper day
Sewage 210,000 gal (US) 51.6 liters Grey water 1,000,000 gal (US) 245.8 liters Oily bilge water 25,000 gal (US) 6.1 liters Solid waste 8 tons 0.471 kg Hazardous waste 130 gal (US) 0.032 liters
dry cleaning waste, paint and solvents, and expired chemicals and pharmaceuticals. Again, these are not the subject of this paper, which has focused solely upon the climate change potential of cruising, but are included to illustrate the larger problem.
5. Conclusions
LCA was shown to be valid in determining the contribution to climate change arising from a cruise holiday, and the basic premise of UNWTO [1999] and UNEP [2009] research – that transport accounts for the lion’s share of a holiday’s contribution to global warming – is borne out, although it must be noted that this reflects only a single mode of environmental harm.
Additional refinements to the model are anticipated in the future, if access to additional information can be secured. The information that would be most useful in refining the calculations described will already be known to those who build and operate cruise ships.
With a contribution to climate change that is over four times the figure for a stay in land-based accommodation of a similar standard, cruising is shown to be anything but sustainable. Cruise lines may in the future need to do more to address their ‘green’ credentials, although the likelihood of legislation forcing a move to significantly lower CO2e emissions in cruising is remote, given the scale of the problem, and the limited power that governments have over ships in international waters.
References
Accor Group (2011) The Accor Group’s Environmental Footprint, online available:
http://www.accor.com/fileadmin/user_upload/Contenus_Accor/Developpement_Durable/pdf/ earth_guest_research/2011_12_08_accor_empreinte_environnementale_dp_bd_en.pdf [date accessed: 28/4/15]
Afon, Y. and Ervin, D. (2008) An Assessment of Air Emissions from Liquefied Natural Gas Ships Using Different Power Systems and Different Fuels, Journal of the Air & Waste Management Association, Vol. 58, No. 3, pp. 404–11
Alpeche, J. (n.d.) How Much Fuel Does a Cruise Ship Use?, lovetoknow.com, online available: http://cruises.lovetoknow.com/wiki/How_Much_Fuel_Does_a_Cruise_Ship_Use
[date accessed: 23/4/15]
BSI (2008) PAS 2050 – Assessing the life cycle greenhouse gas emissions of goods and services, London: The British Standards Institute
DEFRA (2012) 2012 Greenhouse Gas Conversion Factors for Company Reporting, online available: https://www.gov.uk/government/publications/2012-greenhouse-gas-conversion-factors-for-company-reporting [date accessed: 7/4/13]
Environmental Protection Agency (2007) Energy Trends in Selected Manufacturing Sectors: Opportunities and Challenges for Environmentally Preferable Energy Outcomes, online available: http://www.epa.gov/sectors/pdf/energy/ch3-12.pdf [date accessed: 15/4/15]
Environmental Protection Agency (2014) Shipbuilding Greenhouse Gas (GHG) Emission Inventory Tool Version 2.1, online available:
Farr R., Mavragani, E. and Hall, C. (2013) Understanding the Impacts of Cruise Tourism and Their Remediation Costs for Small Island Communities in the Aegean, Tourism Issues, Vol. 16, pp. 113–125
Jones, P., Hillier, D. and Comfort, D. (2014) Sustainability in the Global Hotel Industry, International Journal of Contemporary Hospitality Management, Vol. 26, No. 1, pp. 5–17
Kalli, J., Karvonen, T. and Makkonen, T. (2009) Sulphur content in ships bunker fuel in 2015–A study on the impacts of the new IMO regulations and transportations costs, Centre for Maritime Studies, University of Turku. Helsinki: Ministry of Transport and
Communications
Klein, R.A. (2009) Getting a Grip on Cruise Ship Pollution, Friends of the Earth, online available: http://www.foe.org/sites/default/files/CruiseShipReport_Klein.pdf [date accessed: 14/10/2014]
Leslie, D. (2012) Responsible Tourism: Concepts, Theory and Practice, Wallingford: CABI
Mintel (2014) Cruises – UK – October 2014, London: Mintel Group Ltd.
National Research Council (2010) Advancing the Science of Climate Change, Washington DC: The National Academies Press
Nugent, R. (2009) Hope Floats, The Atlantic, June 2009, online available:
http://www.theatlantic.com/magazine/archive/2009/06/hope-floats/307441/ [date accessed: 14/3/15]
P&O Cruises (2015) Destinations: Barcelona Shore Excursions, P&O Cruises, online available: http://www.pocruises.com/cruise-destinations/barcelona-cruises/ [date accessed: 30/4/15]
Peckham, J. (2013) Lloyd’s Updates: LNG Bunkering Study; Fuel Price vs. HFO/MGO Crucial Factor, Global Refining & Fuels Report, Vol. 17, No. 6, pp. 13–14
Samson, S.M. (2014) Review of Carbon Credit Mechanism as a Policy for Controlling Global Warming, International Journal of Trade & Global Business Perspectives, Vol. 3, No. 1, pp. 812–816
Schnepf, E. (2010) World’s Largest Ship Begins First Cruise Season, Sea Classics, Vol. 43, No. 5, pp. 6–8
Taylan, M. (2013) An Insight into Ship Recycling: Facts and Figures, in Proceedings of the 4th International Symposium of Maritime Safety, Security & Environmental Protection, Athens, 30th – 31st May 2013
UNEP (2009) Environmental Impacts of Tourism – Global Level Loss of Biological Diversity, United Nations Environmental Programme for Development, online available:
http://www.unep.org/resourceefficiency/Business/SectoralActivities/Tourism/
TheTourismandEnvironmentProgramme/FactsandFiguresaboutTourism/ImpactsofTourism/ EnvironmentalImpacts/EnvironmentalImpactsofTourism-GlobalLevel/tabid/78777/
Default.aspx [accessed 19/4/15]
http://dtxtq4w60xqpw.cloudfront.net/sites/all/files/docpdf/gcetbrochureglobalcodeen.pdf
[date accessed: 19/4/15]
Vij, M. and Vij, A. (2012) Tourism and Carbon Foot Prints in United Arab Emirates – Challenges and Solutions, Journal of Environmental Management and Tourism, Summer, Vol. 3, No. 1(5) pp. 41–54
Wagner, R.H. (2006) An Important Ship, The Log, New York: Navy League of the United States, Winter 2006, online available:
http://www.beyondships.com/files/cqm2logarticle07r.pdf [accessed 13/4/15]
Ward, D. (2010) Berlitz Complete Guide to Cruising & Cruise Ships 2010, Munich: Polyglott Verlag
Wing, M.J. (2003) Rethinking the Easy Way Out: Flags of Convenience in the Post-September 11th Era, Tulane Maritime Law Journal, Vol. 28, pp. 173–190
World Bank (2015) CO2 emissions (metric tons per capita), online available:
http://data.worldbank.org/indicator/EN.ATM.CO2E.PC [date accessed: 04/1/15]
World Resources Institute (2011) Green House Gas Protocol Standards, Service Sector, online available: http://www.ghgprotocol.org/calculation-tools/service-sector, [date accessed: 19/4/15]
WTTC (2012) Hotel Carbon Measurement Initiative 1.0, World Travel and Tourism Council and International Tourism Partnership, online available:
http://www.wttc.org/mission/tourism-for-tomorrow/hotel-carbon-measurement-initiative/
![Table 3: Summary of Typical Weekly Cruise Ship Emissions, based on Klein [2009] Category Total quantity per week Per passengerper day](https://thumb-us.123doks.com/thumbv2/123dok_us/88363.2010652/9.892.246.654.947.1089/summary-typical-weekly-cruise-emissions-category-quantity-passengerper.webp)
