A b s t r a c t. The purpose of the present study is to compare the prediction accuracy of some secondary meta-bolites occurring in caraway, fennel and carrot, recorded with two different NIR spectrometers. Based on the recor-ded spectra and the chemically determined reference values, chemometrical analyses were performed using a partial leastsquares (PLS) or a modified PLS algorithm. Very good calibration statistics (SECV, R2) were obtained for the prediction of the essential oil content in caraway both with the dispersive spectrometer system (0.20, 0.93) and with the FT-IR instrument (0.19, 0.92). The results received for the essential oil content in two harvests of fennel (1996+1997) gave nearly the same accuracy: (0.47, 0.92) and (0.58, 0.91). Satisfactory calibration results were received for the NIRS determination of total carotenoids in two harvests of carrots (1997: 3.54, 0.82 /1998: 3.45, 0.91) by using a FT-IR spe-ctrometer. Applicable calibration results were received for total sugars in carrots (1997: 1.61, 0.67/1998: 1.14, 0.73).
K e y w o r d s: near-infrared spectroscopy, non-destru-ctive measurements, caraway, fennel, carrot
INTRODUCTION
The near-infrared (NIR) region, which co-vers the spectral interval between approxima-tely 14000 and 4000 cm-1(0.7-2.5 µm), con-tains absorption bands corresponding to over-tones and combinations of fundamental C-H, O-H and N-H vibrations. Near-infrared spe-ctroscopy (NIRS) is widely used as a quan-titative technique for predicting the chemical composition of various agricultural products. The fast and non-destructive operation is one of the main advantages of this technique. During
the last ten years, the growing interest in near -infrared spectroscopy has risen by improve-ments in instrumentation and in data analysis as well as by the introduction of optical fibers allowing delivery and transfer of NIR energy and information over long distances [6,10]. Today numerous different near-infrared sy-stems are available on the market, ranging from simple filter systems to scanning systems that are able to scan a complete spectrum in the fraction of a second. After the first applications of the FT-principle to NIR in the late eighties of the 20th century [5] today FT-IR spectrometers are able to measure in the NIR range. Extraction of quantitative information from the rather fea-tureless NIR-spectra has been a notable success of multivariate calibration techniques [4]. But today a significant limitation to the use of multi-variate regression in the NIR spectrometry is the difficulty of transferring calibrations from one NIR instrument to another. Typical NIR spectra include not only the spectral variation caused by the chemical or physical properties to be measu-red, but also time-varying, unintended variation attributed to the particular instrumental system used for acquiring the spectra.
The main aim of this study was to compare the NIR predictions for the contents of minor components in the selected plant material measured with two different NIR instruments. ESTIMATION OF MINOR COMPONENTS IN CARAWAY, FENNEL AND CARROTS
BY NIRS - COMPARISON OF RESULTS FROM DISPERSIVE AND FOURIER-TRANSFORM INSTRUMENTS
H. Schulz, R. Quilitzsch, H.-H. Drews, H. Krüger
Federal Centre for Breeding Research on Cultivated Plants, Institute for Quality Analysis, Neuer Weg 22/23 D-06484 Quedlinburg, Germany
The NIR spectrometers used were different in the scanning principle as well as in the sam-pling schemes. The measured plant material was fruit of fennel and caraway. Moreover, spectral analyses are carried out in carrot roots applying the FT- NIR equipment.
fruit of caraway (Carum carvi L.) and fennel (Foeniculum vulgareMILL.) are videly used in the industry because of their positive properties for human health. In this context, the breeding of medicinal and aromatic plants is a considerable importance [3,7,8].
In carrots (Daucus carotaL.) the content of carotenoids in the roots has been regarded with increasing interest. During the last years bre-eding research activities have focused on se-lecting carrot genotypes with a carotenoid con-tent as high as possible [9].
MATERIALS AND METHODS
Genotypes of caraway and fennel as well as different carrot varieties were grown in the ex-perimental garden of the Federal Centre of Bre-eding Research on Cultivated Plants in Qued-linburg, Germany. Samples selected for calibra-tion and validacalibra-tion covered a wide range of individual secondary metabolites for analysis. The investigations were carried out on 225 cara-way fruit plants (harvest in 1997), 200 fennel fruit (harvest in 1996) and 150 fennel plants (harvest in 1997). In the case of carrot, investi-gations were carried out on 100 different roots of 5 varieties (harvest in 1997) and on 200 diffe-rent roots of 10 varieties (harvest in 1998).
Individual reference analyses were perfor-med as follows:
Fully ripe umbelliferae fruit were extracted with acetone and the resulting essential oils were analysed by gas chromatography (GC) with FID as described earlier [2]. Analyses were performed on a Hewlett Packard GC (HP 5890) applying the following conditions:
25 m x 0.25 mm i.d., 0.25 µm Optima 225 (Machery & Nagel); temperature programme: 120 °C hold for 2 min; rise to 200 °C by 25 °C min-1, hold time of 1 min; carrier gas He; split 1:40.
Reference data for carrot samples were determined from freshly prepared carrot juice. Individual content of saccharose, fructose and glucose was analysed by HPTLC. After solid phase extraction (SFE), the contents ofa- andb - carotene were analysed by RP-HPLC ac-cording to Chenet al.[1] applying the following conditions: 3 ml of the SFE eluate were con-centrated and then a volume of 20 µl was in-jected on the HPLC column. The detection was carried out at 444 nm and 450 nm.
Dispersive NIRS measurements of um-belliferae fruit (caraway, fennel) were carried out on a near-infrared scanning monochromator NIRSystems 5000 (FOSS-Deutschland GmbH, Rodgau, Germany) in the reflectance mode. A few cm3of intact fruit were transferred into rec-tangular cups (51 x 64 mm, 11 mm depth), placed in a transport unit, moving the sample up and down at right-angles to the incident ra-diation. Each sample was measured twice with 32 scans each time. After transforming to log (1/R), the data were processed with a commer-cial spectral analysis programme (NIRS2 4.0, Infrasoft Int. Inc., Port Matilda, PA, U.S.A.).
The wavelength region for all the cali-brations was 1100-2490 nm to produce a total of 700 points per spectrum. At first, spectral data were treated with a weighted multiple scatter correction (WMSC) to eliminate interferences of scatter, and then transformed with the se-cond- or third-derivative processing. A modi-fied partial least square (MPLS) algorithm was used onto spectra and reference values for pre-dicting the content and composition of the in-dividual essential oil. The optimum number of MPLS factors used for the respective prediction was determined by cross validation. The overall error between modeled and reference values, the standard error of cross validation (SECV), and the multiple coefficient of determination (R2) were used to describe the accuracy of the calibration models.
beam splitter, detector and Y-shaped fused silica fiber suitable for NIR region. A few cm3 of intact fruit were transferred into a beaker. In all the experiments, a fiber optics probe was placed with a constant distance above the sam-ple material, so that the measuring spot had a diameter of approx. 8 mm. In all the cases the spectrum was averaged from 12 interferometer scans. The wavenumber region used for the ana-lysis was 4000-12000 cm-1. The spectral mea-surements were carried out at 5 different parts on the flat surface of several fruit poured into the beaker. Based on the received average spectra, the chemometrical analyses were per-formed using the commercial software pro-gramme OPUS 2.2/QUANT 2 (Bruker GmbH).
The calibration programme was set up with the full wavenumber range applying the PLS (partial least square) algorithm. The optimum number of PLS ranks used for the respective prediction was determined by cross validation. The accuracy of the calibration statistics was described by the overall error between modeled and reference values, the root mean square error of cross validation (RMSECV), and the
mul-tiple coefficient of determination (R2). The RMSECV is comparable with the above men-tioned SECV.
NIRS measurements of carrot roots were performed only on the FT-IR spectrometer sy-stem. The spectral measurements were carried out on the untreated surface of a carrot at 5 different points of equal distances. Based on the recorded average spectra for each carrot sam-ple, chemometric analyses were performed as described above.
RESULTS AND DISCUSSIONS
The results presented in Tables 1 and 2 as well as Fig. 1(a, b) demonstrate that the NIRS technique is suitable well for the non-destruc-tive and reliable determination of the essential oil content and the composition of essential oil substances in the intact fruit of caraway and fennel. Regarding the most valuable statistical parameters, i.e., R2and SECV (or RMSECV), only small differences between the results of Fourier-transform and dispersive measure-ments were found. More than the optical con-figuration itself, the sampling schemes seem to
Component Caraway (C = 225 / 1997)
FT -NIR spectrometer Dispersive NIR spectrometer
range RMSECV R2 range SECV R2
Oil content Carvone content Limonene content
3.07 - 6.87 1.29 - 3.78 1.34 - 3.31
0.19 0.16 0.16
0.92 0.82 0.82
2.63 - 6.89 1.29 - 4.03 1.34 - 3.31
0.20 0.13 0.11
0.93 0.92 0.92
T a b l e 1.Range and NIRS correlation statistics for the essential oil content (ml 100 g-1) and components (ml 100 g-1) in the
fruit of caraway received by FT-NIRS and dispersive NIRS (C = number of calibration samples)
Harvest/Year
Fennel (C = 200 / 1996; C = 150 / 1997)
FT - NIR spectrometer Dispersive NIR spectrometer
range RMSECV R2 range SECV R2
Harvest 1996 Harvest 1997 Harvests 1996 +1997
2.48 - 8.34 3.49 - 11.22 2.48 - 11.22
0.58 0.63 0.58
0.76 0.84 0.91
3.19 - 8.22 1.26 - 11.99 1.26 - 11.22
0.47 0.50 0.47
0.83 0.92 0.92
T a b l e 2.Range and NIRS correlation statistics for the essential oil content (ml 100 g-1) in the fruit of fennel (harvests in
be of major concern for the reliability of the calibration results. Especially for non-destruc-tive measurements of whole umbelliferae fruit, the moving reflectance cup achieved a better homogeneity of the sample material than using fused silica fiber optics. A comparable homoge-niety would be achievable with a great number of fiber optics measurements on the same sam-ple. Nevertheless the results point out that two NIR spectrometers working with different scan-ning principles and sample handling obtain mu-ltivariate calibrations with comparable accu-racy for the same samples.
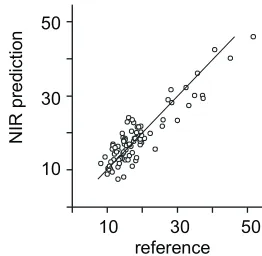
On the other hand, measurements on the surfaces of intact carrots are only possible ap-plying a Y-shaped optical fiber. In connection with the FT-NIR technique acceptable analy-tical results were obtained for the prediction of a- andb- carotene and consequently of the total carotene content in carrot roots (Table 3, Fig. 2). Table 3 also shows the well known fact that a greater number of samples supplies better cali-bration results.
Contrary to the above, less analytical re-liability was reached for the NIRS estimation of individual sugars. Nevertheless, the predi-ction of the total sugar content in single carrots (Table 3) can be successfully introduced as a useful screening method in breeding experi-ments. Finally, it should be mentioned that high water content of fresh carrots does not permit to
Carotene and sugar contents
Carrots (C = 100 / 1997) Carrots (C = 200 / 1998)
range RMSECV R2 range RMSECV R2
Total carotene
a- carotene
b- carotene Total sugar
8.10 - 51.70 2.78 - 20.94 5.32 - 32.01 2.10 - 13.74
3.54 1.77 2.73 1.61
0.82 0.78 0.70 0.67
9.3 - 70.5 2.5 - 26.9 7.9 - 43.6 3.0 - 12.9
3.45 1.49 2.45 1.14
0.91 0.91 0.87 0.73
T a b l e 3.Range and NIRS correlation statistics for thea-,b- and total carotene content (mg 100 g-1) as well as the total
sugar content (%) in intact carrots (harvests in 1997 and 1998) obtained by FT-NIRS (C = number of calibration samples) 2
4 6 8 10
2 4 6 8 10
NI
R
p
re
d
ict
io
n
reference
10
8
6
4
2
2 4 6 8 10
NI
R
p
re
di
ct
io
n
reference
Fig. 1.Reference values (solvent extraction) versus FT-NIRS (a) and dispersive NIRS (b) predictions of the essential oil
content (ml 100 g-1) in fennel fruit (harvests in 1996 + 1997; C = 350).
10 30 50
10 30 50
NI
R
p
re
d
ictio
n
reference
Fig. 2. Reference values (HPLC determination) versus
NIRS prediction (FT-NIRS) of the total carotene content (mg 100 g-1) in carrots (harvest 1997, C = 100).
obtain better NIR based calibration results, related to broad water absorption bands in the near infrared range.
CONCLUSIONS
In breeding caraway and fennel for a high content of essential oil, application of NIRS is the only possibility to obtain information about its constituents, necessary for the selections in a non-destructive and time-saving manner. The compiled calibration equations with determi-nation coefficients of of 0.92 gave sound basis for precondition. When choosing the appro-priate spectrometer, neither the FT-IR type nor the dispersive type showed prediction accuracy. That is why the time for sample handling shall be decisive. So the use of fiber optics can be of benefit, when compared to cuvette which must be filled, emptied and cleaned again and again.
In carrot breeding for high total carotene content, for example for industrial applications, NIRS proved to be a fast and non-destructive method of suppling information about differen-ces in carotene contents of the cultivars. The compiled calibration equations with determi-nation coefficients of 0.91 seem to be sufficient for this purpose.
ACKNOWLEDGMENT
The financial support of the “Deutsche For-schungsgemeinschaft“ (DFG) in Bonn (Grant 566/4-1) is gratefully acknowledged.
REFERENCES
1. Chen B.H., Peng H.Y., Chen H.E.:Changes of
caro-tenoids, color, and vitamin A content during proces-sing of carrot juice. J. Agric. Food Chem., 43, 1912-1918, 1995.
2. DGF German Standard Methods for the Analysis of Fats and Other Lipids (in German). German Society for Fat Science (DGF) Münster, Wissenschaftliche Ver-lagsgesellschaft MbH, Stuttgart, 1991.
3. Franz Ch.:Züchtung und Anbau von Arzneipflanzen.
In: Pharmazeutische Biologie II, Biogene Arzneistoffe (Ed. H. Rimpler), Georg Thieme Verlag, Stuttgart, New York, 16-33, 1990.
4. Martens H., Naes T.:Multivariate Calibration. John
Wiley & Sons, Chichester and New York, 1989.
5. McClure W.F., Davis A.M.C.:Fast Fourier
tran-sforms in the analysis of near-infrared spectra. In: Analytical Applications of Spectroscopy. (Eds C.S. Creaser, A.M.C. Davies). Royal Society of Chemistry, London, 414-436, 1988.
6. Murray I., Cowe I.A.(Eds): Making Light Work:
Ad-vances in Near Infrared Spectroscopy. VCH Verlag, Weinheim, New York, Basel, Cambridge, 1992.
7. Pank F., Krüger H.:Development, growth type, and
quality of crossbreeding progenies of sweet and bitter fennel (in German). Annual Report 1998, Federal Centre for Breeding Research on Cultivated Plants, Quedlinburg, Germany, 197-199, 1998.
8. Pank F., Krüger H.: Ability of biennial caraway
cultivars as female parent in crossing experiments for the development of populations of annual caraway with improved variability of quality traits (in German). Annual Report 1998, Federal Centre for Breeding Research on Cultivated Plants, Quedlinburg, Germa-ny, 199-200, 1998.
9. Simon P.W., Wolff X.Y., Peterson C.E.,
Kam-merlohr D.S., Rubatzky V.E., Strandberg J.O.,
Bassett M.J., White J.M.:High carotene mass
popu-lation. HortScience, 24(1),174-175, 1989.