A b s t r a c t. This study presents the results of the measurements of horizontal and vertical pressures in a silo, performed for dry barley grain with a moisture content of 13% d.b. and compares those results with the average values of horizontal and vertical pressures for barley grain with moisture contents of 17.7, 19.0, 22.7 and 24% d.b. and storage times from 1 to 10 days. The increased moisture content resulted in higher average values of horizontal pressure and lower average values of vertical pressure. The higher moisture content and longer storage time caused an increased in pressure values.
K e y w o r d s: barley, moisture content, silo, pressure EFFECT OF GRAIN MOISTURE CONTENT
ON PRESSURE VALUES
The value of grain pressure on the walls of a silo is related to the grain moisture content which varies with the duration of storage. This can be due to water diffusion resulting from differences in its concentration in the material stored, to water adsorption from the air - resulting from differences between air humidity and the grain moisture content, and to the absorption of water produced as a result of grain respiration.
Wratten et al. [14], Muthukumarappan et al. [10], Deshapandeet al.[4], and Mohsenin [9] found that grain swells during wetting, and the increase in grain volume is directly proportional to the amount of water absorbed. According to those authors, the grain volume increase is:
Dv Dmw DMCm
w
d
w
= =
r r (1)
where:Dv- volume increase of grain kernel, m3;Dmw- mass
of water added to grain kernel, kg,; DMC - increase in
moisture content decimal fraction (dry basis (d.b.));Dmd -dry mass of grain kernel, kg;rw- density of water, kg m-3.
Equation (1) assumes a grain volume increase of 1.0× 10⁻⁵ m3 kg-1 of dry mass per every percentage point of moisture content increase. This level of volume increase is comparable with experimental results; e.g. Mohsenin [9] obtained a volume increase of 1.03×10⁻⁵m3kg-1of maize dry mass; Muthukumarappanet al.[10] obtained 9.49×10⁻⁶, 0.04×10⁻⁶and 8.9×10⁻⁶m3kg-1of dry mass for unpolished, brown and crushed rice, respectively. The true increase in grain volume may be lower, especially at low levels of grain moisture content, due to the effect of surface sorption [9].
Increases in grain volume cause a considerable increase in hygroscopic pressure. An example of this can be found in the studies by Dale and Robinson [3] who studied pressures in a silo 1.5 m high and 0.46 m in diameter. They filled the silo with maize grain and supplied humid air. When the grain moisture content increased from 13 to 17%, they observed that the hydrostatic pressure at the bottom of the silo increased from 2.1 to 13.5 kPa.
Brittonet al.[2] monitored the vertical forces acting on silo walls in the process of wetting grain with humid air. Their model silo, 1.5 m high and 1 m in diameter, was filled with wheat grain with an initial moisture content of 10%. They found that forcing humid air of a temperature of 23°C through the grain mass for about 900 min caused the total disappearance of friction against the walls. Gravity acting on the grain mass was completely counterbalanced by the force of the lateral pressure of the swollen grain. This occurred at a 6% grain moisture content increase. Grain swelling resulted in the appearance of strong pressures against the walls and a reduction of pressure against the bottom of the silo.
Model study of the effect of barley grain moisture content on the distribution
of horizontal and vertical pressures in a silo
E. Kusiñska
Department of Engineering and Machinery, University of Agriculture, Doœwiadczalna 44, 20-236 Lublin, Poland Received October 9, 2000; accepted May 25, 2001
© 2002 Institute of Agrophysics, Polish Academy of Sciences
Author’s e-mail: [email protected]
w w
Grain strain is accompanied by a volumetric defor-mation of the grain mass, which can be presented as Eq. (2):
ev v v =D 0 (2)
where:ev- hygroscopic volumetric strain of free expansion, v0 initial volume of grain kernel, m3.
Eqs (1) and (2) can be replaced by the following equation: e r r v k w MC MC = + æ è
çç öø÷÷æèç ç ö ø ÷ ÷ D 1 0 0 (3)
where: MC0 - initial grain moisture content (decimal
fraction, d.b.),rk0 - initial kernel density, kg m-3. If grain mass is enclosed in an ideally rigid silo, hygroscopic pressure causes an increase in wall loads. Additional strain appears in the walls, due to which grain expansion takes two directions:
– the grain mass expands slowly, without any risk of structural changes;
– reaction forces compress the grain to its original size. However, silo’s walls and bottom are not ideally rigid, and in the upper part of the silo the grain has some freedom of movement. The differences between free increase in grain size and the true size are controlled by the level of hygroscopic pressure. The process has been mathematically described by Timoshenko and Goodier [13].
The process of water absorption causes a change in grain density. Grain density decreases with increasing moisture content, due to increased grain volume. Functional relationships between grain mass density and changing moisture content have been presented, in the form of compound equations, by Zhang and Britton [16]. Mühlbauer and Scherer [11] suggested the linear relation for the description of the relationship between density and water content for maize grain.
Zhang and Britton [16] developed a theoretical model for the calculation of silo structure loads caused by the hygroscopic phenomena. The model assumes that the increase in individual kernel volume is proportional to the amount of water absorbed. Pressure values, calculated by means of the model, corresponded within 3% with the empirical data. For a hypothetical silo, 6.15 m high and 4.2 m in diameter, the calculated index of pressure increase was from 5.0 to 8.6 with a 10% increase in maize grain moisture content (for maize grain with bulk density of 618 and 771 kg m-3 respectively). Granik and Ferrari [5] used the micro-structural mechanics for the description of the phenomenon of hygroscopic pressure. Smith and Lohnes [12] experi-mentally determined and mathematically described the modulus of elasticity for the grain of maize, wheat, barley and oats.
Xuet al.[15] found that a model based on Granik’s and Ferrari’s theory accurately predicts loads resulting from
grain hygroscopicity in silos. Hygroscopic pressures calcu-lated by means of a mathematical model developed by those authors differed by 5% from Dale and Robinson’s experi-mental data for maize grain, and by 6% from Blight’s results for barley.
Grochowicz et al. [6] conducted a laboratory study using a silo 1200 mm high and 600 mm in diameter. The study involved measurements of changes in the moisture content, temperature and lateral pressure caused by water diffusion in barley grain. The factor causing water transfer was the difference in its concentration in two grain layers (moisture content of one layer was 10%, and the other – 16%). Greater changes in lateral pressure were observed when the initial moisture content of the lower layer was higher than that of the upper layer. With the reverse arran-gement of the grain layers the changes were less pronoun-ced, though still statistically significant. The increased lateral pressure of the grain was accompanied by higher levels of moisture content and barley grain temperature.
Comparative studies on hygroscopic pressures caused also by water diffusion, performed for wheat, barley, oats and triticale grain, were conducted by Kusiñska [7,8]. She found a relationship between the pressure values and the kind of grain, its physical properties, and the duration of storage. The greatest increase in horizontal pressure values was observed for triticale grain, and the lowest - for oats. She also observed excessive accumulation of water at the lower parts of the silo and on the cover. This sparked her interest in the problem of the effect of high moisture content levels on the values of grain pressure in silos.
OBJECTIVE AND METHOD
The objective of the study was to measure, on a stand, the horizontal and vertical pressures exerted by dry barley grain (moisture content of 13% d.b.), and to compare the results with corresponding data for wet grain (moisture contents of 17.7, 19.0, 22.7 and 24% d.b.). The required moisture content in the grain was achieved by watering. An adequate quantity of water was added which was calculated by the equation:
M M u u
u
w= g
-+
2 1 2
100 (4)
where:Mw-volume of added water into the grain, kg;Mg
-mass of watering grain, kg; u1 - initial grain moisture
content, % d.b.;u2- required grain moisture content, % d.b.
The grain was mixed and stored in a densely closed barrel at 72 h. It was rotated every few hours in order to balance the moisture content. Before filling the silo, the moisture content was controlled.
means of a holder mechanism (4), spacers (7) and a block (3). The silo bottom (6) was located on supports. The silo bottom was provided with a centrally located hole for the measurement of vertical pressure by means of a strain gauge (8). Vertical pressure grain was measured into the axis of the ground, because its biggest value is just there. The measu-rement was made with strain gauge, type AR 201 force of measuring range 5 N. The force was procee ded on the piston diameter of 25 mm and was read off on the amplifier display, type AR 923 at the measuring accuracy of 0.01 N. Vertical pressure was calculated by the equation:
P F
S
v= v (5)
where:Pv-vertical pressure, Pa;Fv- vertical force, N;S
-piston’s surface, m2.
The cylindrical surface of the silo was also provided with holes (eight) for the measurement of horizontal pressure by means of strain gauges (9). The first pressure gauge was located 40 mm above the bottom, and the eight strain gauges in the cylindrical surface of the silo were spaced at 195 mm from one another. Horizontal force values were transmitted by the strain gauges (of measuring range 1 and 2 N) and the pistons (diameter of 25 mm) to the amplifier. Horizontal pressure Pn was estimated by the equation:
P F S
n n (6)
where:Pn- horizontal pressure, Pa;Fn- horizontal force, N;
S- piston’s surface, m2.
The measuring system was calibrated by the static method before every bath of the silo. The strain gauges were attached to the frame (2). The pistons were separated from the grain by a thin-rubber membrane.
The silo was filled with barley grain having a specific moisture content. Then the silo was tightly closed with the cover (10), and the grain pressure against the bottom and the walls of the silo was measured once a day, at a constant time. After 10 days the bottom strain gauge was gently removed, and the grain was poured out. All measurements were taken in three replications.
RESULTS
The results of measurements of the horizontal and vertical pressures for barley grain with moisture content of 13% d.b. are presented in Figs 2 and 3. The strongest horizontal pressures were observed at the lower part of the silo (40 mm above the bottom). On the first day, the value
Fig. 1.Scheme of a measuring stand: 1 - cylindrical silo; 2 - frame; 3 block; 4 regulation mechanism; 5 stand; 6 bottom; 7 -spacing elements; 8, 9 - extensometrical sensors; 10 - cover.
1 3
5 7
9
1405 1210 1015
820 625 430 235
40
0 0,2 0,4 0,6 0,8 1 1,2 1,4 1,6 1,8
P
re
ss
u
re
(k
P
a
)
Time (day)
Height (mm)
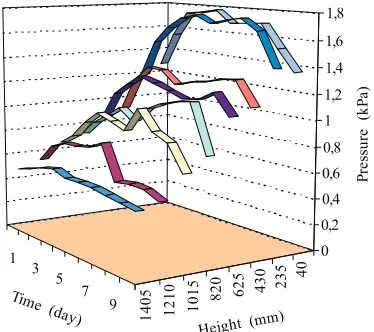
Fig. 2.Pressure exerted on the silo walls by barley grain with 13% d.b. moisture content.
0 1 2 3 4 5 6
1 2 3 4 5 6 7 8 9 10
Time (day)
Fig. 3.Pressure exerted on the silo bottom by barley grain with 13% d.b. moisture content (measured in the silo axis).
Pressure
measured was 1.27 kPa, gradually decreasing towards the top of the silo. At all measurement levels, horizontal pres-sures were observed to increase until day five of the tests, when the value measured at the lower part of the silo was 1.77 kPa. Then, until day eight, there was a gradual decrease in the values measured, down to 1.70 kPa, followed by a rapid drop during the final two days of the tests, down to 1.35 kPa. The changes in the values of horizontal pressure at the upper measurement levels took a similar course. The decrease in the values of the horizontal pressure was due to the concurrent increase in the vertical pressure. Between days seven and eight the vertical pressure increased from 4.13 to 4.76 kPa, while from day one to day seven, it gradually increased from 3.62 to 4.13 kPa. The average value of the horizontal pressure was 0.65 kPa, and that of the vertical pressure - 4.2 kPa. Figures 4-7 illustrates the
average values of measurements of wet barley grain pressures (moisture contents of 17.7, 19.0, 22.7 and 24% d.b.). The average values of wet grain pressure against silo walls (Fig. 4a) for the grain with moisture content from 17.7 to 22.7% d.b. increased from 0.620 to 1.19 kPa, while those for the 24% d.b. moisture content grain were lower at 1.13 kPa. The effect of the duration of storage on the average values of the horizontal pressure is presented in Fig. 4b. Duration time until day six resulted in a considerable increase in average pressures, while further extension onto successive days brought little variation in the pressure values. The combined effect of the duration of storage and grain moisture content on horizontal pressures is presented in Fig. 5. Both the factors caused an increase in the horizontal pressure of wet grain (the average value of the horizontal pressure for the 24% moisture content grain after
Moisture content [% d.b.] 0,5
0,6 0,7 0,8 0,9 1,0 1,1 1,2 1,3
17 18 19 20 21 22 23 24 25
a
Fig. 4.Average values of pressure against silo walls versus: grain moisture content (a) and storage duration (b). Time [day] 0,65
0,70 0,75 0,80 0,85 0,90 0,95 1,00 1,05 1,10 1,15
1 2 3 4 5 6 7 8 9 10
b
Pressure
(kPa)
Time (day)
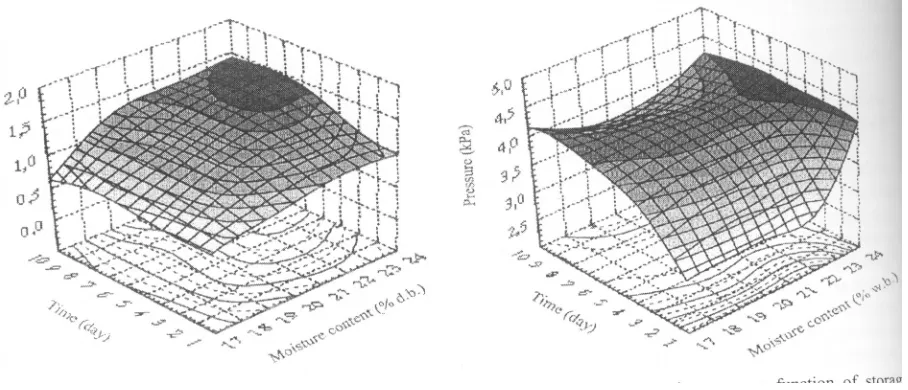
Fig. 5.Average pressure on the silo walls as a function of storage duration and grain moisture content.
Pressure
(kPa)
Moisture content (% d.b.)
10 days was 1.6 kPa). The average values of wet grain pressure on the silo wall were much higher than those of the dry grain. The values were described by means of a regression equation:
P=2.702525 +t0.418589 +u0.031896 (kPa) (R2= 0.78), (7) where:u- initial grain moisture content, % d.b.;t- time of storage, days.
The average horizontal pressure values show a linear increase with the time of storage and moisture content increase.
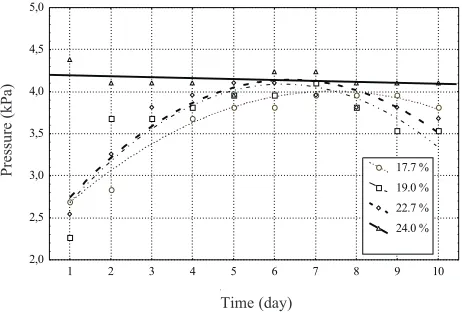
The average values of pressure exerted on the silo bottom (Fig. 7) of barley grain with a moisture content of 17.7 to 22.7% increased between day 1 and days 6-7 from the level of about 2.7 to 4.2 kPa, and then decreased, which was related to the occurrence of a considerable increase in horizontal pressure during the period of days 6 to 10 which partially counterbalanced the weight of the grain. In the course of storage of the barley grain with a moisture content of 24%, the pressure against the silo bottom decreased slightly in a linear manner. The combined effect of storage duration and moisture content on vertical pressure is presented in Fig. 7. The lowest values of vertical pressure were observed during the initial four days of storage in the case of grain with 19% moisture content. The vertical pressure of wet grain had lower values than was the case for the dry grain. Vertical pressure can be described by means of the following equation:
Pv= 0.546784 +t0.130388 +u20.08011 (kPa) (R2= 0.89).
(8) Vertical pressure increase is proportional to the time of storage and proportional with the second power to the
moisture content. The issue of increase was grain swelling. Grain swelling was by water absorption connected with grain breathing.
Grain of a higher moisture content had less bulk density. It influenced the vertical and horizontal pressure on the first day only after filling. On other storage days its influence was imperceptible.
CONCLUSIONS
1. In the course of storage of both wet and dry barley grain, the horizontal and vertical pressures are subject to change.
2. The average values of pressure against silo walls are considerably higher in the case of wet barley grain than in dry barley grain.
3. The average values of vertical pressure are lower for wet grain than for dry grain.
4. The increased moisture content and longer storage time cause pressure values to increase.
REFERENCES
1. Blight G.E., 1986.Swelling pressure of wetted grain. Bulk Solids Handling, 6(6), 1135-1140.
2. Britton M.G., Zhang Q., and McCullagh K., 1993. Moisture induced vertical loads in model grain bin. ASAE Paper No. 93-4503, St. Joseph, Mich.
3. Dale A.C. and Robinson R.N., 1954.Presure in deep grain storage structures. Agric. Eng., 35(8), 570-573.
4. Deshpande S.D., Bal S., and Ojha T.P., 1993. Physical properties of soybean. J. agric. Engng Res., 56, 89-98. 5. Granik V.T. and Ferrari M., 1993. Microstructural
mechanics of granular media. Mechanics of Materials, 15, 301-322.
6. Grochowicz J., Kusiñska E., and Bilañski W.K., 1998.Mass exchange in adjac ent layers of grain material stored in silo. Int. Agrophysics, 12, 103-108.
7. Kusiñska E., 1998.Effect of moisture content of cereal grains layer on pressure distribution on silo wall. Int. Agrophysics, 12, 199-204.
8. Kusiñska E., 1999.Effects of moisture content of grain layers and their configuration in a silo on temperature and pressure distribution. Int. Agrophysics, 13, 469-476.
9. Mohsenin N.N., 1986. Physical Properties of Plant and Animal Materials. 2nd Ed., New York, Gordon and Breach Science.
10. Muthukumarappan K., Jindal V.K., and Gunasekaran S., 1992.Volumetric changes in rice kernels during desorption and adsorption. Transactions of the ASAE, 35(1), 235-241. 11. Mühlbauer W. and Scherer R., 1977. Die Spezifische
Wärme von Körnerfrüchten. Grundl. Landtechnik, 27, 33-40. 12. Smith D.L.O. and Lohnes R.A., 1983.Bulk strength and stress-strain behaviour of four agricultural grains. J. Powder & Bulk Solids Technol., 7(4), 1-7.
13. Timoshenko S. and Goodier J.N., 1970.Theory of Elasticy. 3rd Ed., New York, Hill.
Time [day] 2,0
2,5 3,0 3,5 4,0 4,5 5,0
1 2 3 4 5 6 7 8 9 10
17.7 % 19.0 % 22.7 % 24.0 %
Fig. 7. Pressure against silo bottom as a function of storage duration.
Pressure
(kPa)
14.Wratten F.T., Poole W.D., Chesness J.L., Bal S., and Romarao V., 1969.Physical and thermal properties of rough rice. Transactions of the ASAE, 12(6), 801-803.
15.Xu S., Zhang Q., and Britton M.B., 1996.A microscopic
theory for predicting loads in storage bins for granular materials. J. agric. Engng Res., 65, 253-259.