Predicting risk of COPD in primary
care: development and validation
of a clinical risk score
Shamil Haroon, Peymane Adab, Richard D Riley, Tom Marshall, Robert Lancashire, Rachel E Jordan
To cite:Haroon S, Adab P, Riley RD,et al. Predicting risk of COPD in primary care: development and validation of a clinical risk score.BMJ Open Resp Res2014;1: e000060. doi:10.1136/ bmjresp-2014-000060
▸Additional material is available. To view please visit the journal (http://dx.doi.org/ 10.1136/bmjresp-2014-000060)
Received 18 August 2014 Revised 17 October 2014 Accepted 12 November 2014
Department of Public Health, Epidemiology & Biostatistics, School of Health and Population Sciences, College of Medical and Dental Sciences, University of Birmingham, Birmingham, UK
Correspondence to Professor Peymane Adab; [email protected]
ABSTRACT
Objectives:To develop and validate a clinical risk score to identify patients at risk of chronic obstructive pulmonary disease (COPD) using clinical factors routinely recorded in primary care.
Design:Case–control study of patients containing one incident COPD case to two controls matched on age, sex and general practice. Candidate risk factors were included in a conditional logistic regression model to produce a clinical score. Accuracy of the score was estimated on a separate external validation sample derived from 20 purposively selected practices. Setting:UK general practices enrolled in the Clinical Practice Research Datalink (1 January 2000 to 31 March 2006).
Participants:Development sample included 340 practices containing 15 159 newly diagnosed COPD cases and 28 296 controls (mean age 70 years, 52% male). Validation sample included 2259 cases and 4196 controls (mean age 70 years, 50% male). Main outcome measures:Area under the receiver operator characteristic curve (c statistic), sensitivity and specificity in the validation practices.
Results:The model included four variables including smoking status, history of asthma, and lower respiratory tract infections and prescription of salbutamol in the previous 3 years. It had a high average c statistic of 0.85 (95% CI 0.83 to 0.86) and yielded a sensitivity of 63.2% (95% CI 63.1 to 63.3) and specificity 87.4% (95% CI 87.3 to 87.5). Conclusions:Risk factors associated with COPD and routinely recorded in primary care have been used to develop and externally validate a new COPD risk score. This could be used to target patients for case finding.
INTRODUCTION
Chronic obstructive pulmonary disease (COPD) is the third leading cause of mortal-ity.1 However, population studies suggest that 50–80% of the disease burden remains undiag-nosed.2 3 A recent analysis of UK primary healthcare records showed that opportunities to diagnose COPD are frequently missed with
up to 85% of patients presenting within 5 years of their diagnosis with indicative symp-toms and clinical events.4There is now a drive to identify such patients in order to instigate early management and reduce disease pro-gression.5 6 A variety of screening tools have been proposed and evaluated including symptom-based questionnaires,7 and use of handheld8 and diagnostic spirometry.9 However, mass screening is likely to be costly and a more targeted approach is required to improve their efficiency.
Several clinical prediction models have been developed to identify individuals at risk of undiagnosed COPD. These include two developed in the USA using administrative claims data,10 11 one in Denmark using primary and secondary care data,12 and most recently in Scotland using routine primary healthcare data.13 The first three models are unlikely to be implementable in a UK or similar primary care setting because of differ-ences in healthcare structures as well as the included predictor variables, many of which are not routinely recorded. The Scottish model while likely to be implementable only considered a very limited number of poten-tial risk factors and was not externally validated.13
KEY MESSAGES
▸ Opportunities to diagnose chronic obstructive
pulmonary disease (COPD) in primary care are frequently missed.
▸ Data routinely recorded in primary care can be
used to identify patients with undiagnosed COPD.
▸ We report the development and external
valid-ation of a clinical risk score for COPD in primary care, providing important information for the future development of risk prediction models for COPD that may be used to stratify patients for case finding.
copyright.
on September 18, 2020 by guest. Protected by
We report the development and external validation of a clinical prediction model that provides a score for identifying patients at high risk of undiagnosed COPD in primary care.
METHOD Study design
Electronic primary care records were available from a matched case–control data set obtained from the General Practice Research Database (GPRD; now the Clinical Practice Research Datalink). Cases with incident COPD were matched by age, sex and general practice with controls without COPD (1:2).
Risk score derivation and external validation Description of dataset
The GPRD is a computerised database of longitudinal anonymised patient records from a representative sample of 480 general practices across the UK, covering approximately 6% of the population.14
Selection of cases and controls
Cases consisted of all patients aged ≥35 years on 1st April 2006 with a new diagnosis of COPD recorded between 1 January 2000 and 1 April 2006 (see online supplementary table S1 for clinical codes). Cases had at least 3 years of up-to-standard data (ie, data entry meeting set quality standards) prior to the date of COPD diagnosis (index date). Controls had no diagnosis of COPD, were registered on the index date and also had at least 3 years of up-to-standard data.
Identification of candidate risk factors
Risk factors associated with newly diagnosed COPD were identified from published epidemiological studies. Studies were identified from Medline, Embase and Google Scholar using ‘COPD’ (and relevant synonyms) and ‘risk factor’ as Medical Subject Headings and free text. From 544 articles we identified 46 candidate risk factors that were likely to be routinely recorded in primary care (see online supplementary table S2). The final list included smoking history, comorbidities (including asthma, ischaemic heart disease and depres-sion), lower respiratory tract infections (LRTIs) and upper respiratory tract infections, respiratory symptoms (including cough, dyspnoea, wheeze and sputum pro-duction), systemic symptoms (including unintentional weight loss, chronic fatigue, and poor sleep), body mass index and health service use including medication pre-scriptions (salbutamol, oral prednisolone and antibiotics for a LRTI) and number of previous primary care consultations.
Data extraction
Clinical codes for each variable were identified using the CPRD medical and product dictionaries and the NHS Clinical Terminology Browser V.1.04.15 Data on
demographic characteristics, smoking, comorbidities, respiratory symptoms and health service use were extracted over the specified period (see online supplementary table S2). Data recorded within 60 days prior to the index date were excluded since a clinical suspicion of COPD could have influenced clinical activ-ity during this period.10 Smoking status closest to the COPD diagnosis date (or matched time point) was used to reflect likely clinical practice.
Sample size and creation of derivation and validation data sets
The data set was split into a development and external validation sample (while preserving matching of cases and controls) by purposively selecting 20 general prac-tices that reflected the full range of practice and popula-tion characteristics where the risk score would be applicable. These practices each had at least 200 indivi-duals to ensure validation statistics were estimated with high precision.
Model development
Both the unadjusted and adjusted association between each factor and COPD were estimated using conditional logistic regression (to account for matching of cases and controls). Risk factors were included in the model based on statistical significance (adjusted OR≥1.5 and p value <0.05) and clinical understanding, with the aim to achieve a parsimonious and clinically acceptable model. The final model was simplified by including only four risk factors that had the highest adjusted ORs and were most likely to be recorded in a range of primary care settings.
Missing smoking status was accounted for by including a missing value category in the regression model. Patients in primary care often have unknown smoking status and the model in practice may be applied to such patients. Missing data for other factors was assumed indi-cative of their true absence. Risk scores were computed for each individual by combining the estimated regres-sion log ORs (β coefficients) from the final model with the individual’s risk factor values.
External validation and model performance
The accuracy of the risk score was evaluated in each of the 20 validation practices by producing the correspond-ing receiver operator characteristic (ROC) curve and estimating the area under it (c statistic). To summarise the average performance across the 20 practices, the c statistic estimates were synthesised in a random effects meta-analysis. We also summarised the heterogeneity in performance by estimating a 95% interval for the range of potential c statistics.16
A score threshold to define ‘high risk’was selected by optimising the balance between the sensitivity and posi-tive predicposi-tive value (PPV), assuming a prevalence of undiagnosed COPD of 5.5% in the general popula-tion.17 We divided the total number screened by the
copyright.
on September 18, 2020 by guest. Protected by
number of true positives to derive the number-needed-to-screen (NNS) to detect a single case of COPD. The number of diagnostic assessments needed to detect a single case of COPD was estimated as the reciprocal of the PPV.
RESULTS
Development sample: population characteristics
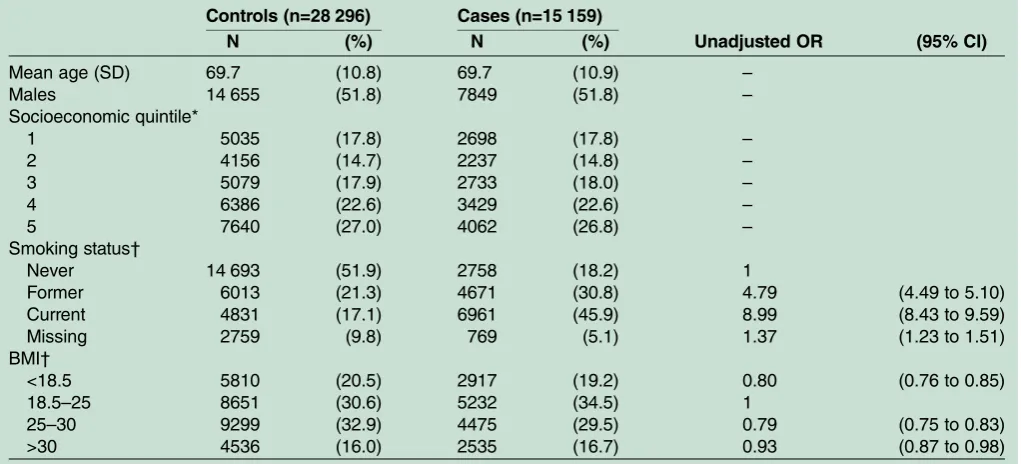
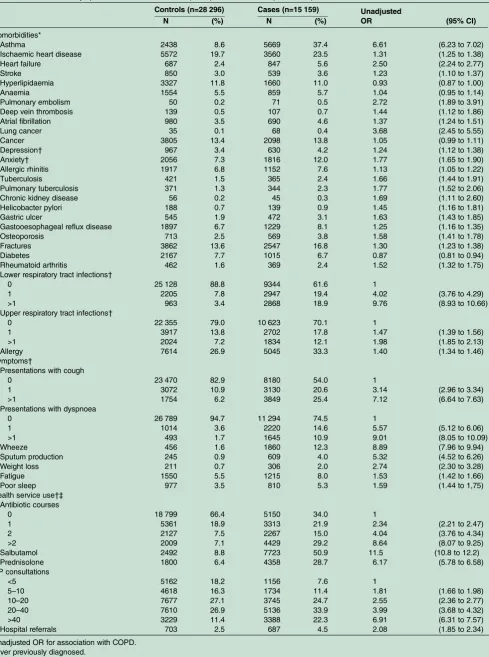
15 159 newly diagnosed COPD cases and 28 296 controls from 340 general practices were included in the develop-ment sample (tables 1 and 2). Mean age was 70 years and 52% were male. Cases and controls were matched and therefore identical in age, sex, and socioeconomic status of registered practice. 27% were current smokers, 25% ex-smokers and 40% had never smoked. A signifi -cantly higher proportion of cases than controls had a positive smoking history (77% vs 38%, respectively). All co-morbidities except hyperlipidaemia and diabetes mel-litus were more common in cases than in controls. This was also true for respiratory and systemic symptoms, including fatigue and poor sleep, as well as health service use.
Model results
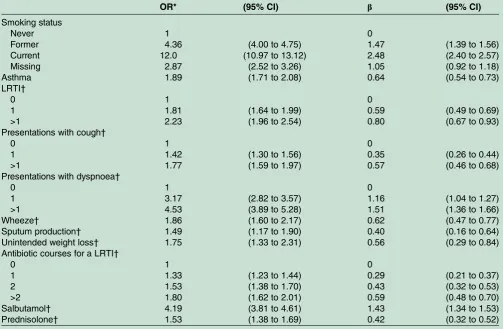
The final model included history of smoking, asthma and salbutamol prescriptions and number of LRTIs in
the previous 3 years (table 3). There was a significant drop in the model fit when removing asthma, salbuta-mol and LRTIs. The model was used to derive a clinical score ranging from 0 to 6.5 as shown belowtable 3. This had a c statistic in the development sample of 0.85 (95% CI 0.845 to 0.853). A more comprehensive model that incorporates additional variables, including symptoms, is provided intable 4.
External validation sample: population characteristics
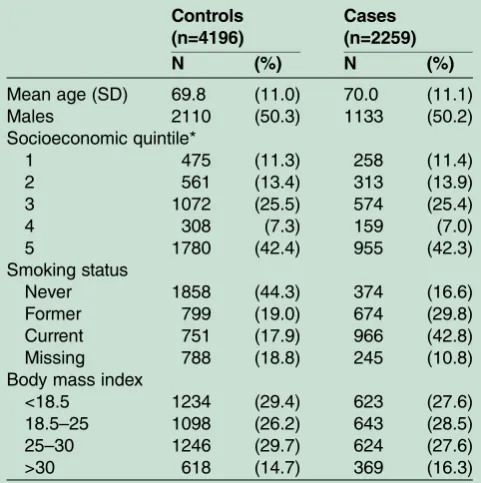
A total of 2259 newly diagnosed cases and 4196 controls from 20 general practices were included in the valid-ation sample (table 5). The mean age was 70 years, 50% were men, and 26.6% were current smokers. A greater proportion of participants in the validation sample than the development sample were from the lowest socio-economic quintile (42.4% vs 26.8%, respectively).
External validation: discriminative ability
Thefinal risk score had a c statistic of 0.84 (95% CI 0.83 to 0.85) in the validation sample when analysing the data from all 20 practices combined (ignoring clustering of patients within practices; figure 1). The c statistic in each of the validation practices separately was consist-ently high (figure 2) and a random effects meta-analysis (which takes into account clustering) produced a similar
Table 1 General characteristics of participants in the development sample
Controls (n=28 296) Cases (n=15 159)
Unadjusted OR (95% CI)
N (%) N (%)
Mean age (SD) 69.7 (10.8) 69.7 (10.9) –
Males 14 655 (51.8) 7849 (51.8) –
Socioeconomic quintile*
1 5035 (17.8) 2698 (17.8) –
2 4156 (14.7) 2237 (14.8) –
3 5079 (17.9) 2733 (18.0) –
4 6386 (22.6) 3429 (22.6) –
5 7640 (27.0) 4062 (26.8) –
Smoking status†
Never 14 693 (51.9) 2758 (18.2) 1
Former 6013 (21.3) 4671 (30.8) 4.79 (4.49 to 5.10)
Current 4831 (17.1) 6961 (45.9) 8.99 (8.43 to 9.59)
Missing 2759 (9.8) 769 (5.1) 1.37 (1.23 to 1.51)
BMI†
<18.5 5810 (20.5) 2917 (19.2) 0.80 (0.76 to 0.85)
18.5–25 8651 (30.6) 5232 (34.5) 1
25–30 9299 (32.9) 4475 (29.5) 0.79 (0.75 to 0.83)
>30 4536 (16.0) 2535 (16.7) 0.93 (0.87 to 0.98)
Unadjusted OR for association with COPD.
Unadjusted ORs for age, sex and socioeconomic status of general practice were not estimated as cases and controls were matched on these variables.
*1=least deprived. 2
3 4
5=most deprived.
Based on Index of Multiple Deprivation score of general practice electoral ward. †Closest to diagnosis.
BMI, body mass index; COPD, chronic obstructive pulmonary disease.
copyright.
on September 18, 2020 by guest. Protected by
Table 2 Comorbidities, symptoms, and healthcare use of participants in the development sample
Controls (n=28 296) Cases (n=15 159) Unadjusted
OR (95% CI)
N (%) N (%)
Comorbidities*
Asthma 2438 8.6 5669 37.4 6.61 (6.23 to 7.02)
Ischaemic heart disease 5572 19.7 3560 23.5 1.31 (1.25 to 1.38)
Heart failure 687 2.4 847 5.6 2.50 (2.24 to 2.77)
Stroke 850 3.0 539 3.6 1.23 (1.10 to 1.37)
Hyperlipidaemia 3327 11.8 1660 11.0 0.93 (0.87 to 1.00)
Anaemia 1554 5.5 859 5.7 1.04 (0.95 to 1.14)
Pulmonary embolism 50 0.2 71 0.5 2.72 (1.89 to 3.91)
Deep vein thrombosis 139 0.5 107 0.7 1.44 (1.12 to 1.86)
Atrial fibrillation 980 3.5 690 4.6 1.37 (1.24 to 1.51)
Lung cancer 35 0.1 68 0.4 3.68 (2.45 to 5.55)
Cancer 3805 13.4 2098 13.8 1.05 (0.99 to 1.11)
Depression† 967 3.4 630 4.2 1.24 (1.12 to 1.38)
Anxiety† 2056 7.3 1816 12.0 1.77 (1.65 to 1.90)
Allergic rhinitis 1917 6.8 1152 7.6 1.13 (1.05 to 1.22)
Tuberculosis 421 1.5 365 2.4 1.66 (1.44 to 1.91)
Pulmonary tuberculosis 371 1.3 344 2.3 1.77 (1.52 to 2.06)
Chronic kidney disease 56 0.2 45 0.3 1.69 (1.11 to 2.60)
Helicobacter pylori 188 0.7 139 0.9 1.45 (1.16 to 1.81)
Gastric ulcer 545 1.9 472 3.1 1.63 (1.43 to 1.85)
Gastooesophageal reflux disease 1897 6.7 1229 8.1 1.25 (1.16 to 1.35)
Osteoporosis 713 2.5 569 3.8 1.58 (1.41 to 1.78)
Fractures 3862 13.6 2547 16.8 1.30 (1.23 to 1.38)
Diabetes 2167 7.7 1015 6.7 0.87 (0.81 to 0.94)
Rheumatoid arthritis 462 1.6 369 2.4 1.52 (1.32 to 1.75)
Lower respiratory tract infections†
0 25 128 88.8 9344 61.6 1
1 2205 7.8 2947 19.4 4.02 (3.76 to 4.29)
>1 963 3.4 2868 18.9 9.76 (8.93 to 10.66)
Upper respiratory tract infections†
0 22 355 79.0 10 623 70.1 1
1 3917 13.8 2702 17.8 1.47 (1.39 to 1.56)
>1 2024 7.2 1834 12.1 1.98 (1.85 to 2.13)
Allergy 7614 26.9 5045 33.3 1.40 (1.34 to 1.46)
Symptoms†
Presentations with cough
0 23 470 82.9 8180 54.0 1
1 3072 10.9 3130 20.6 3.14 (2.96 to 3.34)
>1 1754 6.2 3849 25.4 7.12 (6.64 to 7.63)
Presentations with dyspnoea
0 26 789 94.7 11 294 74.5 1
1 1014 3.6 2220 14.6 5.57 (5.12 to 6.06)
>1 493 1.7 1645 10.9 9.01 (8.05 to 10.09)
Wheeze 456 1.6 1860 12.3 8.89 (7.96 to 9.94)
Sputum production 245 0.9 609 4.0 5.32 (4.52 to 6.26)
Weight loss 211 0.7 306 2.0 2.74 (2.30 to 3.28)
Fatigue 1550 5.5 1215 8.0 1.53 (1.42 to 1.66)
Poor sleep 977 3.5 810 5.3 1.59 (1.44 to 1,75)
Health service use†‡ Antibiotic courses
0 18 799 66.4 5150 34.0 1
1 5361 18.9 3313 21.9 2.34 (2.21 to 2.47)
2 2127 7.5 2267 15.0 4.04 (3.76 to 4.34)
>2 2009 7.1 4429 29.2 8.64 (8.07 to 9.25)
Salbutamol 2492 8.8 7723 50.9 11.5 (10.8 to 12.2)
Prednisolone 1800 6.4 4358 28.7 6.17 (5.78 to 6.58)
GP consultations
<5 5162 18.2 1156 7.6 1
5–10 4618 16.3 1734 11.4 1.81 (1.66 to 1.98)
10–20 7677 27.1 3745 24.7 2.55 (2.36 to 2.77)
20–40 7610 26.9 5136 33.9 3.99 (3.68 to 4.32)
>40 3229 11.4 3388 22.3 6.91 (6.31 to 7.57)
Hospital referrals 703 2.5 687 4.5 2.08 (1.85 to 2.34)
Unadjusted OR for association with COPD. *Ever previously diagnosed.
†Within 3 years of COPD diagnosis or equivalent matched time point for controls. COPD, chronic obstructive pulmonary disease; GP, general practitioner.
copyright.
on September 18, 2020 by guest. Protected by
summary c statistic of 0.85 (95% CI 0.83 to 0.86), with a 95% prediction interval of 0.80 to 0.90. The more com-prehensive score had a marginally higher c statistic (0.87, 95% CI 0.86 to 0.87).
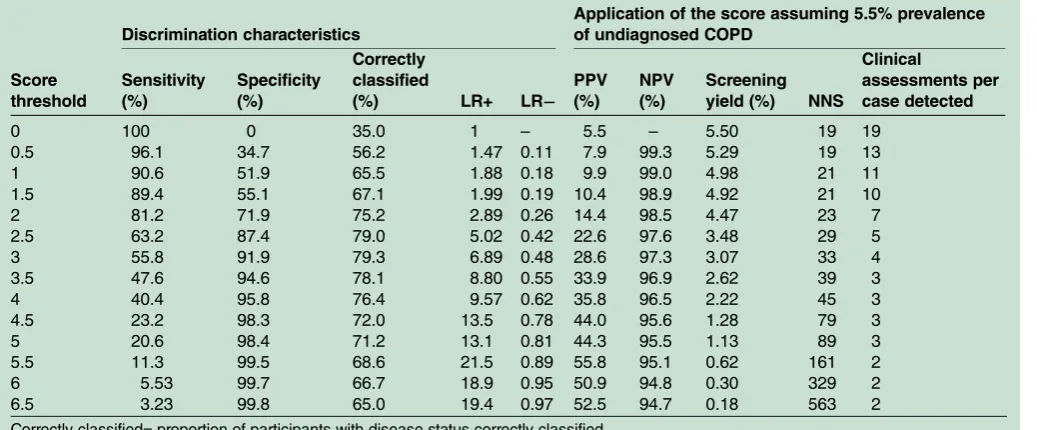
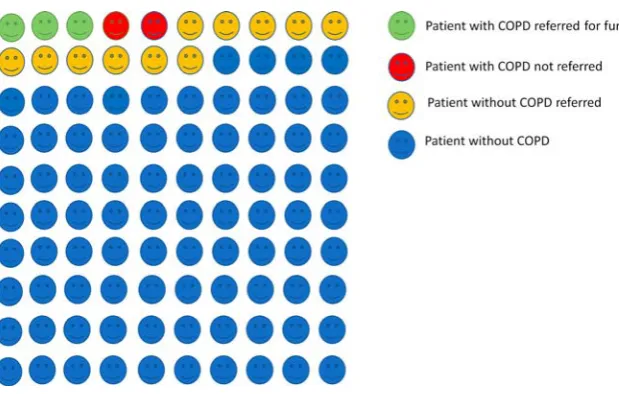
Table 6summarises the performance of thefinal score across a range of thresholds in the validation sample. A score threshold ≥2.5 yielded a sensitivity of 63.2% (95% CI 63.1% to 63.3%) and specificity 87.4% (95% CI 87.3% to 87.5%). Assuming a 5.5% prevalence of undiagnosed COPD,17the score at our suggested thresh-old would have a PPV of 22.6%, NPV of 97.6%, and an overall screening yield of 3.5% when applied to patients over the age of 35 years. At this threshold the score would need to be applied to 29 patients, 5 of whom would require a clinical assessment, to identify one with COPD (figure 3).
DISCUSSION Principal findings
We have developed and validated a clinical prediction model for identifying patients at high risk of COPD in primary care. Our clinical score incorporates smoking status, previous diagnosis of asthma and LRTIs, and pre-scriptions for salbutamol. The score showed good dis-crimination characteristics in the external validation population and our choice of optimal cut point yielded a relatively high sensitivity and specificity. It can
potentially detect about three out of every five patients with undiagnosed COPD while also being able to effect-ively rule out patients at low risk of disease. The score threshold, however, can be altered to either maximise sensitivity or specificity.
This builds on our previous published model (based on data from the Health Survey for England) which would require 19 patients to actively undertake a screen-ing process (19 questionnaire responses and 7 clinical assessments) to identify one individual with COPD.17 Our new clinical score, where we use routine data from primary care records, would significantly improve the efficiency of this process.
Comparison with existing literature
The first published risk model to identify patients with undiagnosed COPD was based on managed ( predomin-antly secondary) care administrative claims data in the USA.18 Using a case–control design, 19 health service utilisation characteristics were included, many of which are unlikely to be routinely recorded in primary care. In contrast we developed a more parsimonious model that uses routinely data recorded in primary care. Furthermore our study population had more complete data on smoking history. A further US model was devel-oped using outpatient pharmacy data.11 This incorpo-rated respiratory and cardiovascular medications and antibiotics, and had a sensitivity of 60.6% and specificity of 70.5% when externally validated. Our risk score simi-larly included prior prescription of salbutamol as an important predictor. However, the ROC curve and c stat-istic for both US models were not reported, which makes it impossible to evaluate their discriminatory accuracy.
In Denmark Smidthet al12used administrative data on hospital admissions for lung disorders, respiratory pre-scriptions and lung function tests to develop a model to identify COPD. This had a much lower sensitivity (29.7– 44.8%) but higher specificity (98.9%) than the score we developed. While it had a high PPV in the Dutch popu-lation (65.0–72.9%; based on an overall COPD preva-lence of 9%), it would be difficult to administer in a UK or similar primary care setting where primary and sec-ondary care data are currently poorly linked. This model also relies on prior diagnoses of emphysema and chronic bronchitis at hospital admissions and would miss a significant number of patients due to the low sen-sitivity and high proportion of false negative results.
Kotzet al13recently developed and internally validated a COPD risk model using routine longitudinal data from primary care in Scotland, including a very large (n=480 903 in the development cohort) and relatively young population (mean age 55.6 years). Their model demonstrated similar discrimination characteristics to our own (c statistic 0.85 (95% CI 0.84 to 0.85) in women and 0.83 (95% CI 0.83 to 0.84) in men), with good calibration. However, this has only been internally validated since the study population was randomly split into derivation and
Table 3 Adjusted ORs and regression coefficients (β) for risk factors included in the final risk model
OR* (95% CI) β (95% CI)
Smoking status
Never 1 0
Former 4.72 (4.35 to 5.12) 1.55 (1.47 to 1.63) Current 11.7 (10.7 to 12.7) 2.46 (2.37 to 2.54) Missing 2.44 (2.16 to 2.76) 0.89 (0.77 to 1.02) Asthma 2.11 (1.93 to 2.31) 0.75 (0.66 to 0.84) LRTI†
0 1 0
1 2.57 (2.36 to 2.81) 0.94 (0.86 to 1.03) >1 4.29 (3.83 to 4.80) 1.46 (1.34 to 1.57) Salbutamol† 6.91 (6.33 to 7.55) 1.93 (1.85 to 2.02) As this model was developed using case-control data, the intercept term is not applicable and has therefore not been presented. *Estimated using a multivariable conditional logistic regression model.
†Within 3 years of COPD diagnosis or equivalent matched time point for controls.
Risk score=(former smoker×1.55)+(current smoker×2.46) +(unknown smoking status×0.89)+(asthma×0.75)+(1 episode of LRTI×0.94)+(>1 episode of LRTI×1.46)+(salbutamol×1.93). NB. Each variable can either take the value 0 (not present) or 1 (present).
For example, A former smoker with a history of asthma who presented with more than one lower respiratory tract infection in the past 3 years, and received salbutamol in the past 3 years would have the following risk score:
(1×1.55)+(0×2.46)+(0×0.89)+((1×0.75)+(0×0.94)+(1×1.46) +(1×1.93)=5.69.
COPD, chronic obstructive pulmonary disease; LRTI, lower respiratory tract infection.
copyright.
on September 18, 2020 by guest. Protected by
validation samples. Furthermore only a very limited range of risk factors were considered (age, sex, smoking status, socioeconomic status and history of asthma) and import-ant predictors such as respiratory infections were not. They constructed separate models for men and women since they found an interaction between smoking status and sex. We also stratified our model by sex and repeated our analysis but found the ORs to be broadly similar to those in the non-stratified model.
A variety of screening questionnaires have also been evaluated. For example Priceet al7assessed the accuracy of a casefinding questionnaire which included items on respiratory symptoms, smoking, and allergies and showed good discrimination characteristics. 8 This and other questionnaire-based tools can only be used in either face-to-face consultations or distributed by mail or online.
If used in a population with a 5.5% prevalence of undiag-nosed COPD, 26 patients would need to be screened to identify one case of COPD. Our model has the advantage of being applicable in both face-to-face consultations as well as integrated with clinical information systems and used at a practice level to identify whole groups of high-risk patients who could be invited to screening sessions. With the latter approach, onlyfive patients would need to be invited for assessment to identify one case of COPD, thus improving its efficiency fivefold over the use of current screening questionnaires.
Strengths
We used data from a large primary care population and explored a wide range of risk factors, focusing on those routinely recorded in primary care. Both aspects help
Table 4 Adjusted ORs and regression coefficients (β) for variables included in a more comprehensive risk score
OR* (95% CI) β (95% CI)
Smoking status
Never 1 0
Former 4.36 (4.00 to 4.75) 1.47 (1.39 to 1.56)
Current 12.0 (10.97 to 13.12) 2.48 (2.40 to 2.57)
Missing 2.87 (2.52 to 3.26) 1.05 (0.92 to 1.18)
Asthma 1.89 (1.71 to 2.08) 0.64 (0.54 to 0.73)
LRTI†
0 1 0
1 1.81 (1.64 to 1.99) 0.59 (0.49 to 0.69)
>1 2.23 (1.96 to 2.54) 0.80 (0.67 to 0.93)
Presentations with cough†
0 1 0
1 1.42 (1.30 to 1.56) 0.35 (0.26 to 0.44)
>1 1.77 (1.59 to 1.97) 0.57 (0.46 to 0.68)
Presentations with dyspnoea†
0 1 0
1 3.17 (2.82 to 3.57) 1.16 (1.04 to 1.27)
>1 4.53 (3.89 to 5.28) 1.51 (1.36 to 1.66)
Wheeze† 1.86 (1.60 to 2.17) 0.62 (0.47 to 0.77)
Sputum production† 1.49 (1.17 to 1.90) 0.40 (0.16 to 0.64)
Unintended weight loss† 1.75 (1.33 to 2.31) 0.56 (0.29 to 0.84)
Antibiotic courses for a LRTI†
0 1 0
1 1.33 (1.23 to 1.44) 0.29 (0.21 to 0.37)
2 1.53 (1.38 to 1.70) 0.43 (0.32 to 0.53)
>2 1.80 (1.62 to 2.01) 0.59 (0.48 to 0.70)
Salbutamol† 4.19 (3.81 to 4.61) 1.43 (1.34 to 1.53)
Prednisolone† 1.53 (1.38 to 1.69) 0.42 (0.32 to 0.52)
As this model was developed using case-control data, the intercept term is not applicable and has therefore not been presented. The c statistic for this model in the external validation sample was 0.87 (95% CI 0.86 to 0.87).
*Estimated using a multivariable conditional logistic regression model.
†Within 3 years of COPD diagnosis or equivalent matched time point for controls.
Risk score=(former smoker×1.47)+(current smoker×2.48)+(unknown smoking status×1.05)+(asthma×0.64)+(1 episode of LRTI×0.59)+ (>1 episode of LRTI×0.80)+(1 episode of cough×0.35)+(>1 episode of cough×0.57)+(1 episode of dyspnoea×1.16)+(>1 episode of dyspnoea×1.15)+(wheeze×0.62)+(sputum×0.40)+(unintended weight loss×0.56)+(1 antibiotic course×0.29)+(2 antibiotic course×0.43)+ (>2 antibiotic courses×0.59)+(salbutamol×1.43)+(prednisolone×0.42).
NB. Each variable can either take the value 0 (not present) or 1 (present).For example, A former smoker with a history of asthma who presented with more than one lower respiratory tract infection and episode of cough in the past 3 years, reported of unintended weight loss and received salbutamol and 2 course of antibiotics for a LRTI in the past 3 years would have the following risk score:
(1×1.47)+(0×2.48)+(0×1.05)+(1×0.64)+(0×0.59)+(1×0.80)+(0×0.35)+(1×0.57)+(0×1.16)+(0×1.15)+(0×0.62)+(0×0.40)+(1×0.56)+(0×0.29) +(1×0.43)+(0×0.59)+(1×1.43)+(0×0.42)=5.9.
COPD, chronic obstructive pulmonary disease; LRTI, lower respiratory tract infection.
copyright.
on September 18, 2020 by guest. Protected by
ensure this clinical score will be widely applicable in primary care in the UK and other similar health systems. The score was also validated in a number of non-randomly selected practices allowing for assessment of the heterogeneity of its performance.
Weaknesses
Ideally we would like to have used previously undiag-nosed COPD cases identified by case-finding/screening to derive our risk score since their characteristics may
differ from incident cases identified clinically. We used a coded diagnosis of COPD for our case definition. However, there is good evidence that COPD is misdiag-nosed and underdiagmisdiag-nosed in primary care,19 a propor-tion of patients are likely to have undergone spirometry of variable quality,20 and this may have led to some mis-classification of our cases and controls. Unfortunately there was insufficient spirometry data in our data set to validate the diagnosis. Quint et al21 recently demon-strated that clinical codes specific for COPD and emphy-sema have a high PPV for validated COPD. We used clinical codes for COPD that were recommended by the GPRD (now CPRD) at the time of our analysis. Although these largely overlapped with those recom-mended by Quint et althey also included codes specific for chronic bronchitis, which would not necessarily con-stitute a diagnosis of COPD (although may increase the likelihood of the development of airflow obstruction and risk of mortality).22
The mean age of our study population (70 years) was older than patients who would typically be targeted for casefinding. Age and sex, which are likely to be predic-tors of COPD, could not be incorporated in the model because of the matched case-control data. This also pre-vented us from examining calibration performance in the validation practices. Another limitation of the matched case–control design is that c statistics are gener-ally downwardly biased when estimated in such data.23 24 Therefore, it is possible the true c statistic may be closer to 1 on application.
Some of the variables we explored, such as hospitalisa-tions were poorly recorded, and may actually be signifi -cant predictors of COPD. In addition the absence of a risk factor could be secondary to under-recording. However, we aimed to produce a model that would be implementable in a common primary care setting drawing on routinely recorded data. If clinical coding improves over time some of these variables may need to be revisited as potential predictors and considered for inclusion in future revised models. Finally, our clinical score may not be applicable in health settings where exposure to risk factors other than cigarette smoking (eg, biomass fuels) is a significant cause of COPD.
Implications for clinicians, policymakers and research
Our clinical score once further validated, could be used by clinicians in primary care to stratify patients by risk of COPD. This could be achieved primarily with the aid of developed software applications that would automate the calculations. Since the model was based entirely on rou-tinely collected data it could also be integrated into primary care clinical information systems to use data on risk factors to stratify all eligible patients. Patients pre-dicted to be at high risk of COPD could then be referred for a clinical assessment including confirmatory spirometry testing.
However, further work is needed to validate or adapt this preliminary model in other populations, notably in
Table 5 Characteristics of subjects in the external validation sample (derived from 20 general practices)
Controls (n=4196)
Cases (n=2259)
N (%) N (%)
Mean age (SD) 69.8 (11.0) 70.0 (11.1)
Males 2110 (50.3) 1133 (50.2)
Socioeconomic quintile*
1 475 (11.3) 258 (11.4)
2 561 (13.4) 313 (13.9)
3 1072 (25.5) 574 (25.4)
4 308 (7.3) 159 (7.0)
5 1780 (42.4) 955 (42.3)
Smoking status
Never 1858 (44.3) 374 (16.6)
Former 799 (19.0) 674 (29.8)
Current 751 (17.9) 966 (42.8)
Missing 788 (18.8) 245 (10.8)
Body mass index
<18.5 1234 (29.4) 623 (27.6)
18.5–25 1098 (26.2) 643 (28.5)
25–30 1246 (29.7) 624 (27.6)
>30 618 (14.7) 369 (16.3)
*1=least deprived, 5=most deprived. Based on the Index of Multiple Deprivation score of electoral ward,
Figure 1 Receiver under the operator characteristic (ROC) curve for the test accuracy of the final risk score in the entire external validation sample (c statistic=0.84, 95% CI 0.83 to 0.85), ignoring clustering of patients within practices. Each point on the graph represents the performance (sensitivity and specificity) of the risk score at specific thresholds.
copyright.
on September 18, 2020 by guest. Protected by
Figure 2 Random effects meta-analysis of the c statistics obtained for the final risk score when applied in each of the 20 validation practices separately. The summary result is the estimate of the average c statistic across the validation practices.
Table 6 Test accuracy of the final risk score in the external validation sample
Discrimination characteristics
Application of the score assuming 5.5% prevalence of undiagnosed COPD
Score threshold
Sensitivity (%)
Specificity (%)
Correctly classified
(%) LR+ LR−
PPV (%)
NPV (%)
Screening yield (%) NNS
Clinical
assessments per case detected
0 100 0 35.0 1 – 5.5 – 5.50 19 19
0.5 96.1 34.7 56.2 1.47 0.11 7.9 99.3 5.29 19 13
1 90.6 51.9 65.5 1.88 0.18 9.9 99.0 4.98 21 11
1.5 89.4 55.1 67.1 1.99 0.19 10.4 98.9 4.92 21 10
2 81.2 71.9 75.2 2.89 0.26 14.4 98.5 4.47 23 7
2.5 63.2 87.4 79.0 5.02 0.42 22.6 97.6 3.48 29 5
3 55.8 91.9 79.3 6.89 0.48 28.6 97.3 3.07 33 4
3.5 47.6 94.6 78.1 8.80 0.55 33.9 96.9 2.62 39 3
4 40.4 95.8 76.4 9.57 0.62 35.8 96.5 2.22 45 3
4.5 23.2 98.3 72.0 13.5 0.78 44.0 95.6 1.28 79 3
5 20.6 98.4 71.2 13.1 0.81 44.3 95.5 1.13 89 3
5.5 11.3 99.5 68.6 21.5 0.89 55.8 95.1 0.62 161 2 6 5.53 99.7 66.7 18.9 0.95 50.9 94.8 0.30 329 2 6.5 3.23 99.8 65.0 19.4 0.97 52.5 94.7 0.18 563 2 Correctly classified= proportion of participants with disease status correctly classified.
LR, likelihood ratio (ie, the ratio by which the pretest probability is altered by a positive or negative test result); NPV, negative predictive value (proportion of all participants with a negative test who are disease free);
NNS, number-needed-to-screen (the number of patients or patient records the risk score would need to be applied to) to identify one patient with COPD; NPV, negative predictive value (proportion of all subjects with a negative test who are disease free); PPV, positive predictive value (proportion of all participants with a positive test who have disease); Screening yield, proportion of all patients subjected to the risk score who would be correctly identified as having COPD.
COPD, chronic obstructive pulmonary disease.
copyright.
on September 18, 2020 by guest. Protected by
casefinding trials that have enrolled patients with previ-ously undiagnosed COPD. This includes examining our matching factors (age, sex and socioeconomic depriv-ation) as potential predictors. The cost-effectiveness of targeting patients at different thresholds should also be evaluated. Future studies should also address the impact of this tool on use and outcomes in general practice.
Conclusion
Our risk score shows promising accuracy and increased efficiency over current methods for identifying patients with COPD in primary care. Use of an externally vali-dated score could be used for risk stratification so that high-risk patients can be efficiently identified and referred for confirmatory spirometry. However, evidence that early identification of COPD results in improved patient outcomes must be robustly assessed before screening for COPD can be recommended as part of routine practice.
AcknowledgementsThis study is based in part on data from the Full Feature General Practice Research Database obtained under licence from the UK Medicines and Healthcare Products Regulatory Agency. However, the interpretation and conclusions contained in this study are those of the authors alone. Access to the CPRD database was funded through the Medical Research Council’s licence agreement with MHRA. This CPRD data set was obtained under MRC licence. Approval was given by the Independent Scientific Advisory Committee for the Medicines and Healthcare products Regulatory Agency for this project ( protocol 07_089R). However, the interpretation and conclusions contained in this study are those of the authors alone. The authors are grateful to the General Practice Research Database for access to their data. We obtained the data with a maximum of 100 000 records in order to compare the characteristics and health service use of prevalent patients with COPD with matched controls without COPD.
Contributors The idea for this study was initially conceived by REJ. REJ and PA applied for approval, designed the protocol for data extraction from the CPRD and obtained the CPRD data set. SH, RDJ, PA and REL identified appropriate clinical codes for data extraction. RL extracted and manipulated the data from the CPRD data set to create a STATA file. SH led the design of the study with advice from PA, RDJ, TM and RDR. SH undertook the statistical analysis with specific advice from RDR and additional input from PA, REJ and TM. SH wrote the manuscript with advice and input from all authors. All authors agreed to the final version.
Funding This paper presents independent research funded by the National Institute for Health Research (NIHR). The views expressed are those of the authors and not necessarily those of the NHS, the NIHR or the Department of Health. Shamil Haroon is funded by a National Institute for Health Research (NIHR) doctoral fellowship (DRF-2011-04-064). Rachel Jordan was funded by an NIHR post-doctoral fellowship ( pdf/01/2008/023). Tom Marshall is partly funded by the National Institute for Health Research (NIHR) through the Collaborations for Leadership in Applied Health Research and Care for Birmingham and Black Country (CLAHRC-BBC) programme.
Competing interests All authors have completed the Unified Competing Interest form at http://www.icmje.org/coi_disclosure.pdf (available on request from the corresponding author) and declare: no support from any
organisation for the submitted work (except described above); no financial relationships with any organisations that might have an interest in the submitted work in the previous 3 years, no other relationships or activities that could appear to have influenced the submitted work.
Provenance and peer review Not commissioned; externally peer reviewed.
Data sharing statement No additional data are available.
Open Access This is an Open Access article distributed in accordance with the Creative Commons Attribution Non Commercial (CC BY-NC 4.0) license, which permits others to distribute, remix, adapt, build upon this work non-commercially, and license their derivative works on different terms, provided the original work is properly cited and the use is non-commercial. See: http:// creativecommons.org/licenses/by-nc/4.0/
REFERENCES
1. Lozano R, Naghavi M, Foreman K,et al. Global and regional mortality from 235 causes of death for 20 age groups in 1990 and 2010: a systematic analysis for the Global Burden of Disease Study 2010.Lancet2012;380:2095–128.
2. Buist AS, McBurnie MA, Vollmer WM,et al. International variation in the prevalence of COPD (the BOLD study): a population-based prevalence study.Lancet2007;370:741–50.
3. Menezes AM, Perez-Padilla R, Jardim JR,et al. Chronic obstructive pulmonary disease in five Latin American cities (the PLATINO study): a prevalence study.Lancet2005;366:1875–81.
4. Jones RC, Price D, Ryan D,et al. Opportunities to diagnose chronic obstructive pulmonary disease in routine care in the UK: a retrospective study of a clinical cohort.Lancet Respir Med2014;2:267–6.
5. An outcomes strategy for people with chronic obstructive pulmonary disease (COPD) and asthma in England. London: Department of Health, 2011.
6. Global Initiative for Chronic Obstructive Lung Disease: Global strategy for the diagnosis, managment, and prevention of chronic obstructive pulmonary disease global initiative for chronic obstructive lung disease, 2013.
Figure 3 Screening test accuracy of the final risk score at a threshold of≥2.5 when applied to 100 patients aged≥35 years in primary care with an assumed prevalence of undiagnosed chronic obstructive pulmonary disease (COPD) of 5%.
copyright.
on September 18, 2020 by guest. Protected by
7. Price DB, Tinkelman DG, Halbert RJ,et al. Symptom-based questionnaire for identifying COPD in smokers.Respiration
2006;73:285–95.
8. Frith P, Crockett A, Beilby J,et al. Simplified COPD screening: validation of the PiKo-6(R) in primary care.Prim Care Respir J
2011;20:190–8, 2 p following 98.
9. Bednarek M, Maciejewski J, Wozniak M,et al. Prevalence, severity and underdiagnosis of COPD in the primary care setting.Thorax
2008;63:402–7.
10. Mapel DW, Frost J, Hurley JS,et al. An algorithm for the identification of undiagnosed COPD cases using administrative claims data.J Manag Care Pharm2006;12:458–65.
11. Mapel DW, Petersen H, Roberts MH,et al. Can outpatient pharmacy data identify persons with undiagnosed COPD?Am J Manag Care
2010;16:505–12.
12. Smidth M, Sokolowski I, Kaersvang L,et al. Developing an algorithm to identify people with Chronic Obstructive Pulmonary Disease (COPD) using administrative data.Bmc Med Inform Decis
2012;12:38.
13. Kotz D, Simpson CR, Viechtbauer W,et al. Development and validation of a model to predict the 10-year risk of general practitioner-recorded COPD.NPJ Prim Care Respir Med
2014;24:14011.
14. Clinical Practice Research Database. London: The Medicines and Healthcare products Regulatory Agency, 2013.
15. Read Codes. London: NHS Connecting for Health, 2013.
16. Riley RD, Higgins JP, Deeks JJ. Interpretation of random effects meta-analyses.BMJ2011;342:d549.
17. Jordan RE, Lam KB, Cheng KK,et al. Case finding for chronic obstructive pulmonary disease: a model for optimising a targeted approach.Thorax2010;65:492–8.
18. Mapel DW, Frost FJ, Hurley JS,et al. An algorithm for the identification of undiagnosed COPD cases using administrative claims data. 2006;12:458–65.
19. Soriano JB, Zielinski J, Price D. Screening for and early detection of chronic obstructive pulmonary disease.Lancet2009;374:721–32. 20. Eaton T, Withy S, Garrett JE,et al. Spirometry in primary care
practice: the importance of quality assurance and the impact of spirometry workshops.Chest1999;116:416–23.
21. Quint JK, Mullerova H, DiSantostefano RL,et al. Validation of chronic obstructive pulmonary disease recording in the Clinical Practice Research Datalink (CPRD-GOLD).BMJ Open2014;4:e005540. 22. Pelkonen M, Notkola IL, Nissinen A,et al. Thirty-year cumulative
incidence of chronic bronchitis and COPD in relation to 30-year pulmonary function and 40-year mortality: a follow-up in middle-aged rural men.Chest2006;130:1129–37.
23. Ganna A, Reilly M, de Faire U,et al. Risk prediction measures for case-cohort and nested case-control designs: an application to cardiovascular disease.Am J Epidemiol2012;175:715–24. 24. Janes H, Pepe MS. Matching in studies of classification accuracy:
implications for analysis, efficiency, and assessment of incremental value.Biometrics2008;64:1–9.
copyright.
on September 18, 2020 by guest. Protected by