Effect of moisture content on textural attributes of dried figs
Sara Ansari1*, Neda Maftoon-Azad2, Asgar Farahnaky3, Ebrahim Hosseini4, and Fojan Badii5 1Department of Food Science and Technology, Kazerun Branch, Islamic Azad University, Kazerun, Iran
2Fars Research Center for Agriculture and Natural Resources, Zarghan, Iran
3Department of Food Science and Technology, School of Agriculture, Shiraz University, Shiraz, Iran 4Department of Food Science and Technology, Science and Research Branch, Islamic Azad University, Tehran, Iran 5Departmentof Food Engineering and Postharvest Technology, Agricultural Engineering Research Institute, Karaj, Iran
Received January 7, 2014; accepted September 29, 2014
*Corresponding author e-mail: [email protected]
A b s t r a c t. Due to their soft texture consumers prefer moist figs, which has motivated fig processors to increase the production of this product. However, as water enhances the browning reaction rate, moisture content optimisation of moist figs is very im- portant. Processed figs must have suitable texture softness with browning kept to a minimum. The purpose of this study was to exa- mine the effect of moisture content on the textural attributes of dried figs. Hardness, compression energy, gradient, gumminess and chewiness of fig samples decreased with moisture content expo-nentially, whereas the trend of springiness and cohesiveness with change of moisture content was nearly constant. Moreover, in the texture profile analysis plot of rehydrated figs, the presence of nega-tive area is an indication of adhesiveness which was zero in control dried figs. The results of the texture profile analysis tests proved the existence of a critical moisture content of about 18.4%, above which no significant effect of moisture content on textural parame- ters was found. The glass-rubber transition results from differen-tial scanning calorimeter may explain the different texture profile analysis attributes of dried figs compared with rehydrated figs.
K e y w o r d s: moisture content, texture profile analysis, dried fig, glass transition
INTRODUCTION
For a long time, food scientists and food producers have recognised texture as an important quality factor
influencing the consumers’ acceptance of foods. Texture can be defined as a group of physical parameters deriving from structural food elements which are perceived mostly
by touch. Texture is related to deformation, comminution
and flow of food under force, and objectively expressed as
functions of mass, time and distance(Szczesniak, 1998).
Texture is a sensory feature and is composed of several
textural properties including mechanical (hardness, chewi
-ness and viscosity), geometrical (particle size and shape) and chemical (moisture and fat content) characteristics (Bourne, 1980). It could be measured by fundamental, imi
-tative and empirical ways. Objective measurement of food
texture predominantly involves an analysis of the mechani-cal behaviour of food materials including measurements of load distance characteristics using mechanical devices, and the assessment of subjective characteristics using a
suit-able texture profiling method. Instrumental texture profile analysis (TPA), applicable to both sensory and instrumental
measurements, is a method used to determine the texture of solids and semi-solids by simulating or imitating the
repeated biting or chewing of foods (Szczesniak, 1998; Szczesniak-Surmacka, 2002). Several characteristics such as cellular components, biochemical constituents, water content and cell wall composition influence texture in fruits and
vegetables. Therefore, any external factors affecting these
characteristics can change texture and, by extension, final product quality (Guine and Barroca, 2011). Textural changes
occur during the processing of plant materials or certain physiological events related to tissue and cell
micro-struc-tural changes (Guine and Barroca, 2011; Unal et al., 2013).
As a sensory property, hardness is determined as the for-
ce required to compress a substance between molar teeth or between tongue and palate; cohesiveness – the degree to which a substance is compressed between the teeth before it breaks; springiness – the degree to which a product returns
to its original shape after compression with the teeth; adhe
-siveness – the force required to remove the material that adheres to the mouth during normal eating process; chewi
-ness – the length of time required to masticate the sample
applying constant rate of force to reduce it to a
consisten-cy suitable for swallowing; and gumminess – the energy required to disintegrate a food to a state ready for swallow
-ing (Szczesniak-Surmacka, 2002).
Drying is the most widely employed method for food preservation, and is based on water removal. Although the
physicochemical and microbiological stability of foods im- proves upon drying, some undesirable texture and colour
changes take place. Most dried food materials must be
re-hydrated before direct consumption or use in the manufac-ture of other products. In the rehydration process the dried
products come into contact with water or other liquids
such as fruit juices, sucrose, glucose or glycerol solutions
(Krokida and Marinos-Kouris, 2003; Maldonado et al.,
2010). It is more desirable for the rehydration process to
be as fast as possible in order to retain suitable structural and chemical characteristics and to acquire better
quality-reconstituted products (flavour, texture and nutritional quality) (Sanjuan et al., 2001). Textural properties of rehy -drated products depend on temperature, pre-drying time and rehydration processes. The rehydration bath tempera-ture is the most important factor affecting the rehydration
process, so that at higher water temperatures more rapid
rehydration occurs (Cox et al., 2012).
One of the major leading producers and exporters of
dried fruits in the world is Iran, with dried figs being the
most important. Figs are of great nutritional importance as they are an outstanding source of carbohydrates, minerals, essential amino acids and vitamins (Veberic et al., 2008).
They contain one of the highest concentrations of polyphe-nols among the commonly consumed foods and beverages
(Vinson, 1999). According to FAO statistics, the world fig production is about 1 184 884 t and Iran, with 76 414 t, ranks third in the world after Turkey (254 838 t) and Egypt (884 972 t) (FAO, 2012). About 85% of Iran total fig pro
-duction is for dry consumption. Dried figs have become an
increasingly important product as they are advantageous to both industrial users and individual consumers, offering longer shelf life, higher economic value and ease of use in consumption compared to their use in fresh form.
Most of the fig fruits in Iran are produced in the Fars region. The ‘Sabz’ type, as the most widely produced va-riety in Iran, is also the main cultivar for dried figs. The main problems with dried figs are a decrease in food quality and safety due to hazardous microorganisms, aflotoxin B1 and some storage pests such as Ephestia or Plodia (Oztekin
et al., 2006). Moreover, the process of drying figs may
lead to important textural changes such as hardness and
shrinkage, which may have a negative impact on their mar
-ketability. One way to increase the consumer acceptability
of this valuable agricultural commodity is rehydration and
the production of intermediate-moisture figs. In addition, browning is a major defect during storage of this type of
product. Therefore, optimising the moisture level of this
product taking into account both texture and browning reaction is of great interest to fig processors.
Water, the most ubiquitous plasticizer, affects the
glass-to-rubber transition temperatures (Tg) of many
syn-thetic and natural amorphous polymers (particularly at
low moisture contents), and depresses Tg that can be
ad-vantageous or disadad-vantageous to material properties,
processing and stability (Levine and Slade, 1988). Glass transition is a power-ful tool for understanding the quan
-tification of water mobility in foods and for controlling the shelf-life of products. Besides Tg, water activity (aw)
is another important tool to predict available water in foods and the physical state of solid foods (Roos, 1995). However, it has been shown that Tg is superior to aw due to the unsuitability of the latter to evaluate the shelf life of
some food products. At temperatures below Tg, all food pro-ducts are considered to be stable, and there will be no
considerable change in their physicochemical or biological qua-
lities (Delgado and Sun, 2002). However, at temperatures
above Tg the molecular mobility and free volume of the pro- duct increase, and the physical and physicochemical dete- riorative reactions may speed up in the rubbery state
(Slade and Levine, 1991; Roos, 2003). The purpose of this study was to determine the effect of moisture content on the textural properties of sun-dried figs using texture profile analysis (TPA). Moreover, determination of critical moisture content below which texture characteristics of figs show great changes is to be addressed.
MATERIALS AND METHODS
Dried figs (Sabz variety) were purchased from Estahban Fig Research Centre (Fars province, southern Iran). They were packed in polyethylene bags and stored at 4°C until analysis. Initial moisture content of dried figs was 6.2%.
Dried fig samples, with a fig to water ratio of 1:3 (w/w), were rehydrated in distilled water at constant temperatures (25, 60, 70, 80 and 90°C) for different time intervals using a thermostable water bath (± 0.1°C). After rehydration, the samples were removed from the bath and weighed after blot-ting with tissue paper in order to remove superficial water. They were then packed and stored until moisture condi -tioning (Ansari et al., 2014). The moisture content of the samples was measured according to the Association of Official Analytical Chemists methods (AOAC, 1990).
Texture profile analysis tests were carried out using
a texture analyzer (Texture Analyser, TA Plus, Stable
Microsystems, Surrey, England) with a load cell of 30 kg.
Each sample corresponding to a rehydration time after
con-ditioning was subjected to a double compression force test
using a cylindrical probe having dimensions greater than
to 20% of their original height by two consecutive
com-pressions using a cylindrical probe of 100 mm diameter at a speed of 1 mm s-1. The time interval between the two com -pression cycles was 10 s. Using the Texture Exponent Lite supplied by the manufacturer, textural parameters were
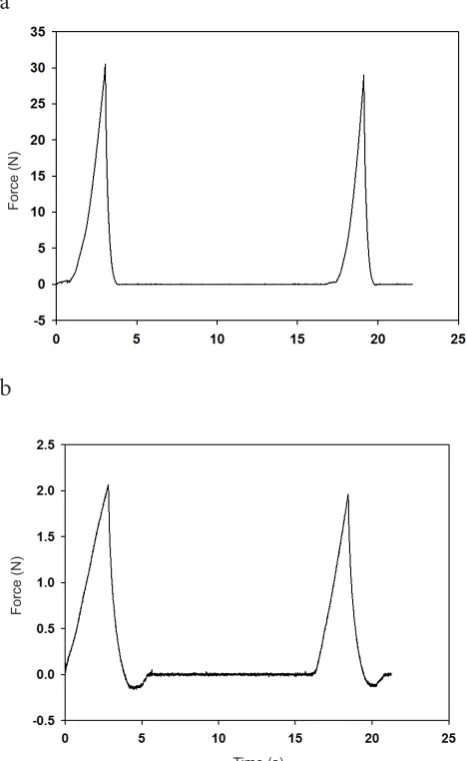
cal-culated from the TPA curves as shown in Fig. 1. The textural
parameters considered in the present study are defined as follows (Bourne, 1978):
Hardness (N) is the maximum load applied to the sam
-ples during the first compression. Compression energy (N s)
is the area under force versus time until maximum force
obtained. Cohesiveness (dimensionless) is the ratio of the area under the second peak to that under the first peak. Springiness (dimensionless) is understood as the reversed
sample deformation in the second compression obtained as the ratio of the distance of detected height of sample on the second compression to that of the original compression.
Gumminess (N) is determined by multiplying hardness and cohesiveness; chewiness (N mm) is the product of gummi
-ness and springi-ness. The function gradient (dimensionless)
calculates the gradient of the slope of the curve between the two selected points. All textural measurements were per
-formed at room temperature (22 ± 2°C) with four replicates
of each sample.
The glass transition (Tg) and melting temperature (Tm) of moist figs were determined using a Perkin Elmer Pyris Diamond differential scanning calorimeter (DSC) (Cambridge, UK), equipped with a refrigerated cooling system which efficiently maintained the experimental tem
-perature. The instrument was calibrated for temperature and enthalpy with indium (Tm, onset = 156.6°C, Delta H
= 28.45 J g-1) and cyclohexane (T
m, onset= 6.5°C) accord
-ing to manufacturer recommendation. In this experiment,
weighed samples (30 mg) were sealed in a pre-weighed
high-pressure stainless steel pan, cooled to -50°C, and then heated at a heating rate of 10°C min-1 to 150°C. After the first heating, the samples were cooled at a rate identical to
the rate of heating (10°C min-1), and then the second heat -ing cycle was performed. An empty stainless steel pan was used as the reference. Tg was determined from the onset, midpoint and endpoint of the step change in the specific heat of the sample in the second heating run, while Tm was reported as onset, peak and endpoint temperatures obtained from the first heating scan.
Analysis of variance (ANOVA) of TPA parameters of samples with different moisture content was applied in order to determine if there was a significant difference between the means (a=0.5). Duncan multiple range test was used to compare the means using IBM SPSS statistic software, version 19.
RESULTS AND DISCUSSION
Rehydration kinetics of sun-dried figs, which is defined
as changes in moisture content as a function of
rehydra-tion time at different temperatures, is shown in Fig. 2. As
seen, the moisture content of the samples for all
rehydra-tion curves increased as rehydrarehydra-tion time progressed, with an initial steep increase followed by a decrease in rehydra -tion rate. This behaviour may be related to decreases in the
driving force of water movement as rehydration progres-sed until the system reached equilibrium. Moreover, by increa-sing the rehydration temperature from 25 to 90°C, both the re-
hydration rate and the amount of water absorbed increased. Figure 1 shows the TPA obtained for the sun-dried and rehydrated figs, respectively. It is obvious that the TPA plot of dried figs consists of two force peaks during the two consecutive compressions. However, in the
rehydra-ted sample a negative area is seen in the TPA plot upon
upstroking the probe after the first compression. The
exis-tence of this negative area in some rehydrated samples indicates that the adhesiveness of samples depends on the
adhesion degree (or stickiness) of the fig sample to the probe. Indeed, in rehydrated samples with moisture content of 13.5-30% the adhesiveness value was nearly constant (0.1-0.2), after which a small increase in moisture content led to a large decrease in adhesiveness (approaching zero).
a
b
Fig. 1. Texture profile analysis curve obtained for: a – dried fig (6.2%) and b – rehydrated fig at 60°C 15 min-1 (24.1%).
Time (s)
Force (N)
This may be related to the sticky nature of sugars which retains this property in water until a certain water level has been reached (about 30%), after which the viscosity of the water-sugar mixture, and hence the stickiness, drops sud
-denly. Washing sugars out and away from the figs surface at
longer rehydration times may also contribute to reductions in adhesiveness beyond 30%.
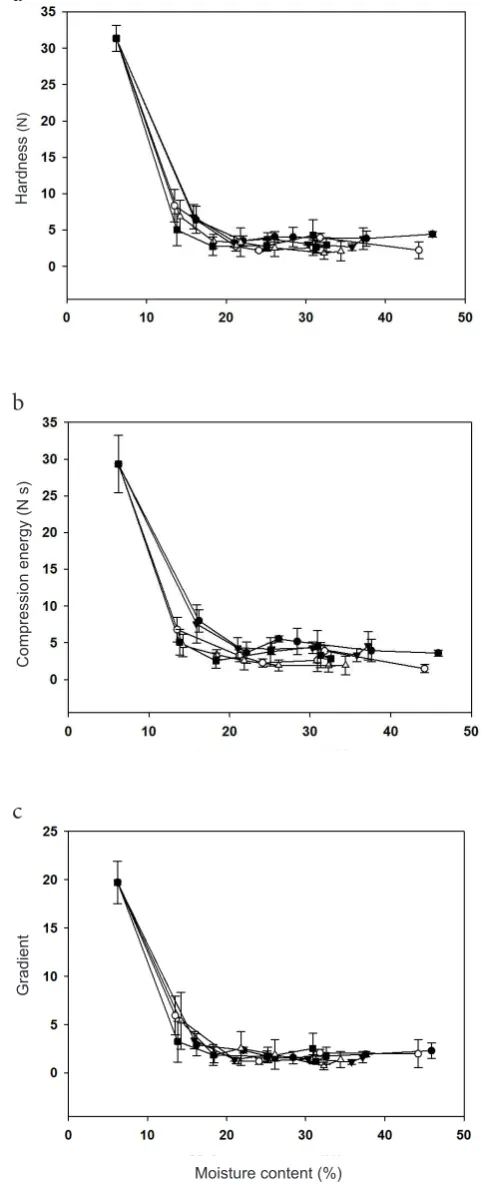
The changes in hardness, gradient and compression
energy of sun-dried figs rehydrated at different times and
temperatures as a function of moisture content are presen-
ted in Fig. 3 and Table 1. The table shows that as the
moisture content increased, the hardness of the samples decreased at a rapid softening rate at the beginning. After
dried fig rehydration, the hardness decreased from 31 N to
the constant value of 2-4 N. This behaviour may be related
to the transition of the glassy dried fig (tough to deform) into rubbery rehydrated fig (easy to deform), which will be explained in more detail in the following section. Rahman and Al-farsi (2005) and Seow and Thevamalar (1988) examined the hardness of date flesh and rice-based
products as a function of moisture content and also attri- buted this behaviour to the rubbery-leathery transition. The
rubbery-leathery transition was expressed when the force required to compress the sample suddenly increased with a decrease in moisture content. Leather state is defined as a relatively tough material which is hard to deform; this state occurs often as temperatures approach Tg. Moreover, the hardness values as obtained revealed no significant differences between rehydration temperatures. However, when this data was analysed according to the rehydration time (and so the moisture content), a significant difference was observed between samples containing 6.2 and 16.2% with other samples at 25°C as well as at temperatures of 60, 70, 80 and 90°C.
Moisture content
(%)
Fig. 2. Rehydration rate curve for dried figs at different tempera-tures (25-90° C).
Fig. 3. Variation of hardness (a), compression energy (b) and gra-dient (c) as a function of moisture content. Legend as in Fig. 2.
a
b
c
Compression energy (N s)
Time (min)
Hardness
(N)
Moisture content (%)
T a b l e 1. Texture profile analysis (TPA) of dried figs rehydrated at different times and temperatures
Temperature (°C)
Moisture
content (%) Hardness(N) Gradient Compression energy (N s) Gumminess(N) Chewiness(N mm)
25
6.2 31.35a ± 1.8 19.71a ± 2.2 29.30a ± 3.9 22.55a ± 2.7 18.47a ± 3.4
16.2 6.38b ± 1.8 2.92b ± 1.1 8.00b ± 1.5 4.18b ± 1.2 3.78b ± 1.2
22.1 3.52c ± 0.7 2.36b ± 0.3 3.64c ± 1.4 3.07b ± 0.4 2.39b ± 0.5
26.1 4.08c ± 0.7 1.54b ± 0.3 5.52bc ± 0.4 2.66b ± 0.3 2.04b ± 0.1
28.4 4.02c ± 1.3 1.60b ± 0.6 5.16bc ± 1.8 2.68b ± 0.8 2.42b ± 0.9
37.6 3.83c ± 1.0 1.94b ± 0.3 3.93c ± 1.5 2.80b ± 0.6 2.53b ± 0.5
45.9 4.42bc ± 0.4 2.30b ± 0.8 3.59c ± 0.4 3.32b ± 0.1 2.51b ± 0.2
60
6.2 31.35a ± 1.8 19.72a ± 2.2 29.30a ± 3.9 22.53a ± 2.7 18.47a ± 3.3
13.5 8.35b ± 2.2 5.94b ± 2.0 6.79b ± 1.6 6.28b ± 1.6 5.00b ± 1.1
21.2 2.76c ± 0.7 1.27c ± 0.3 3.23c ± 0.8 1.84c ± 0.4 1.60c ± 0.4
24.1 2.18c ± 0.2 1.21c ± 0.3 2.27c ± 0.6 1.63c ± 0.3 1.48c ± 0.4
30.9 2.56c ± 1.1 1.46c ± 0.4 2.61c ± 1.5 1.86c ± 0.8 1.56c ± 0.7
31.8 3.95c ± 0.6 2.10c ± 0.3 3.88bc ± 0.7 2.85c ± 0.5 2.49c ± 0.5
44.2 2.22c ± 1.1 1.98c ± 1.4 1.47c ± 0.5 1.73c ± 0.9 1.22c ± 0.7
70
6.2 31.35a ± 1.8 19.71a ± 2.2 29.30a ± 3.9 22.54a ± 2.7 18.47a ± 3.3
15.9 6.82b ± 1.7 3.40b ± 0.9 7.56b ± 2.6 4.73b ± 1.1 3.71b ± 1.0
21.0 3.40c ± 0.8 1.39c ± 0.2 4.30bc ± 1.4 2.33c ± 0.5 1.75b ± 0.5
25.2 3.79c ± 0.9 1.86bc ± 0.8 4.14bc ± 0.8 2.76bc ± 0.7 2.08b ± 0.6
30.3 3.08c ± 0.2 1.45c ± 0.3 4.32bc ± 0.8 2.12c ± 0.1 1.77b ± 0.1
35.8 2.66c ± 0.5 1.14c ± 0.2 3.30c ± 0.9 1.88c ± 0.4 1.56b ± 0.3
37.2 3.79c ± 1.5 1.62bc ± 0.6 4.60bc ± 1.9 2.67bc ± 0.9 2.21b ± 0.7
80
6.2 31.35a ± 1.8 19.71a ± 2.2 29.30a ± 3.9 22.54a ± 2.7 18.47a ± 3.3
14.2 6.86b ± 2.2 5.39b ± 2.9 4.62b ± 1.5 5.11b ± 1.4 4.40b ± 1.2
18.4 3.46c ± 1.0 1.87c ± 0.8 3.39b ± 0.7 2.45bc ± 0.8 2.37bc ± 0.8 21.8 3.30c ± 2.0 2.54bc ± 1.7 2.55b ± 1.2 2.48bc ± 1.4 2.23bc ± 1.3
26.1 2.54c ± 1.2 1.91c ± 1.5 1.91b ± 0.8 1.99c ± 1.0 1.58bc ± 0.8
32.3 1.83c ± 0.8 0.73c ± 0.4 1.89b ± 0.9 1.37c ± 0.7 1.20c ± 0.6
34.4 2.08c ± 1.3 1.39c ± 0.8 1.91b ± 1.3 1.67c ± 1.1 1.54bc ± 1.2
90
6.2 31.35b ± 1.8 19.71a ± 2.2 29.30a ± 3.9 22.54a ± 2.7 18.47a ± 3.3
13.8 5.01b ± 2.2 3.25b ± 2.1 5.07b ± 1.7 3.42b ± 1.8 2.30b ± 1.5
18.3 2.74b ± 1.3 1.86b ± 1.1 2.54b ± 1.0 1.84b ± 0.8 1.36b ± 0.8
25.1 2.84b ± 0.7 1.69b ± 0.6 3.79b ± 1.9 1.98b ± 0.3 1.74b ± 0.6
30.9 4.27b ± 2.1 2.54b ± 1.6 4.45b ± 2.2 3.03b ± 1.5 2.59b ± 1.4
31.3 2.65b ± 0.9 1.19b ± 0.2 3.30b ± 1.7 1.82b ± 0.6 1.43b ± 0.7
T a b l e 1. Continuation
Temperature
(°C) Moisture content (%) (dimensionless)Cohesiveness Springiness(mm) Adhesive work(N s)
25
6.2 0.72b ± 0.0 0.82ab ± 0.0 0.00a ± 0.0
16.2 0.65b ± 0.0 0.90a ± 0.0 -0.15b ± 0.0
22.1 0.90a ± 0.2 0.77ab ± 0.1 -0.07a ± 0.0
26.1 0.66b ± 0.0 0.77ab ± 0.1 -0.25b ± 0.0
28.4 0.67b ± 0.0 0.90a ± 0.1 -0.18b ± 0.1
37.6 0.74ab ± 0.0 0.91a ± 0.0 -0.02a ± 0.0
45.9 0.75ab ± 0.0 0.76b ± 0.1 -0.02a ± 0.0
60
6.2 0.72ab ± 0.0 0.82ab ± 0.0 0.00a ± 0.0
13.5 0.76ab ± 0.0 0.80ab ± 0.0 -0.25c ± 0.0
21.2 0.67b ± 0.1 0.87a ± 0.0 -0.21bc ± 0.2
24.1 0.74ab ± 0.1 0.90a ± 0.1 -0.13abc ± 0.0
30.9 0.72ab ± 0.0 0.84ab ± 0.1 -0.10ab ± 0.0
31.8 0.72ab ± 0.0 0.87a ± 0.0 -0.07ab ± 0.0
44.2 0.77a ± 0.0 0.68b ± 0.2 -0.02a ± 0.0
70
6.2 0.72a ± 0.0 0.82a ± 0.1 -0.01a ± 0.0
15.9 0.69a ± 0.0 0.78a ± 0.0 -0.13bc ± 0.0
21.0 0.68a ± 0.0 0.75a ± 0.1 -0.07ab ± 0.0
25.2 0.72a ± 0.0 0.76a ± 0.1 -0.20c ± 0.1
30.3 0.69a ± 0.0 0.83a ± 0.0 -0.10ab ± 0.1
35.8 0.71a ± 0.0 0.83a ± 0.0 -0.05ab ± 0.0
37.2 0.71a ± 0.0 0.84a ± 0.0 -0.06ab ± 0.0
80
6.2 0.72b ± 0.0 0.82b ± 0.1 -0.01a ± 0.0
14.2 0.76ab ± 0.0 0.86ab ± 0.0 -0.14ab ± 0.1
18.4 0.70b ± 0.0 0.97a ± 0.0 -0.11ab ± 0.0
21.8 0.75ab ± 0.0 0.90ab ± 0.0 -0.10ab ± 0.0
26.1 0.77ab ± 0.0 0.80b ± 0.1 -0.24b ± 0.3
32.3 0.74ab ± 0.0 0.87ab ± 0.0 -0.02a ± 0.0
34.4 0.79a ± 0.0 0.88ab ± 0.1 -0.03ab ± 0.0
90
6.2 0.72a ± 0.0 0.82a ± 0.1 -0.01a ± 0.0
13.8 0.65a ± 0.1 0.65a ± 0.2 -0.20b ± 0.2
18.3 0.68a ± 0.0 0.71a ± 0.1 -0.18ab ± 0.0
25.1 0.71a ± 0.1 0.87a ± 0.2 -0.18ab ± 0.1
30.9 0.71a ± 0.0 0.82a ± 0.1 -0.16ab ± 0.0
31.3 0.69a ± 0.0 0.75a ± 0.1 -0.11ab ± 0.1
32.6 0.72a ± 0.0 0.75a ± 0.1 -0.05ab ± 0.0
The compression energy and gradient parameters of
dried and rehydrated figs as a function of moisture content at different rehydration temperatures are also shown in Fig. 3b, c. The figure indicates that, similar to hardness, the compression energy and gradient of all samples were
re-duced as a function of moisture content. Compression energy,
which is an indicator of the energy required to compress the samples to 20% of their original height (in this study), was about 29.3 N s in dried figs compared to approximately 2-4 N s in rehydrated ones. This implies that rehydrated figs would require less energy than dried figs, and that dried figs
are softened during the rehydration process.
Table 1 shows the effect of moisture content on cohe
-siveness and springiness of dried and rehydrated figs. Cohesiveness represents how well the sample withstands a second deformation relative to the first one. It is worth noting that cohesiveness of rehydrated dried figs was rather constant (about 0.75), indicating that the figs were textur -ally cohesive. This effect may be explained by the presence
of elasticity in fig cellular structure which contributes to
its deformation recovery after load removal. It may be that
compression energy was stored in the cellulose and hemi -celluloses in the plant cell structure, causing the material to return to its initial state after force removal. Plant cell walls can be considered a fibre-reinforced composite consisting of rigid cellulose microfibrils (as isotropic component) crosslinked by a hemicelluloses and pectin matrix (isotropic component) (Athmaselvi et al., 2012; Hansen et al., 2011;
Peaucelle et al., 2011). Organized into the network with the cellulose microfibrils, cross-linking can increase the tensile strength of the cellulose, whereas the coextensive networks of pectins provide the cell wall with the ability to resist compression. Many researchers have stated that plant cell walls exhibit viscoelastic properties: they retain shape after deformation, but with a time delay (Peaucelle et al., 2011). Springiness (sometimes also referred to as ‘elasticity’) indicates the elastic recovery that occurs when the com
-pression force is removed (or the degree to which a product returns to its original shape after compression with the teeth). High springiness (close to one) appears when the sample is elastic and so it returns back to its original shape after compression, whereas low springiness (near to zero)
results from tissue damage after compression (viscous
nature of samples). The average springiness for dried figs is 0.82% and for rehydrated figs in the range of 0.65-0.9% (average 0.78%), without significant change between dif -ferent rehydration times and temperatures. The values are nearly similar, indicating that rehydration treatment did not change the recovery in height after the product has been
compressed by the teeth during mastication. Moreover,
considering the proximity of springiness to the one value,
the elastic component in rehydrated dried figs dominates
the viscous component. In practical terms, if the sample is compressed to 20% of its initial height, 78% of its deforma-tion is recovered after force removal.
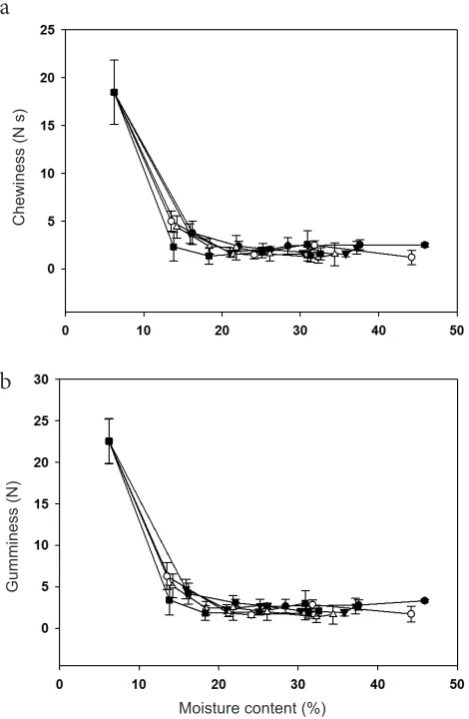
Figure 4 presents the effect of moisture content on chewi-ness and gummichewi-ness of figs rehydrated at different tempe-ratures, indicating that the values of both were derivatives of hardness, cohesiveness and springiness. Chewiness is the
quality of simulating the energy required to masticate a
sol-id sample to a steady state for swallowing, while the energy
required to disintegrate a solid food to a steady state for
swallowing is defined as gumminess. The change in hard-ness, chewiness and gumminess ran parallel to each other.
Considering Fig. 3a and Table 1, the magnitude of hardness
range (1.8-31 N) was far higher than those of cohesiveness (0.65-0.9) and of springiness values (0.65-0.9 mm) (the two other parameters in the definition of chewiness and gummi
-ness). However, it does not mean that those parameters are the same; in fact, they represent different textural sensory attributes. With an increase of moisture content, chewiness and gumminess decreased without any significant differ
-ence between rehydration temperatures of 25-90°C. In dried
state, the figs show an average chewiness and gumminess
Chewiness (N s)
Fig. 4. Variation of chewiness (a) and gumminess (b) as a function of moisture content. Legend as in Fig. 2.
a
b
Moisture content (%)
of 18 N mm and 22.5 N; however, after rehydration these
values decreased to constant values of 1-2 N mm and 1-3 N, respectively.
Fig adhesiveness (the work necessary to overcome the attractive forces between the surface of the fig and the sur-face of the probe with which the food comes into contact) at different moisture contents is also shown in Table 1. The maximum adhesiveness (-1.06 N s) was found in re-hydrated figs with a moisture content of 16.2%, and its value decreased as moisture content increased. However, in dried fig this parameter was nearly equal to zero due to the
absence of a negative area in the TPA plot. Indeed, adhe-siveness is more of a surface characteristic that depends on
a combined effect of adhesive and cohesive forces, as well as vis
-cosity and viscoelastic characteristics (Adhikari et al., 2001). The glass to rubbery transition, as explained in the follow -ing section, may be responsible for this type of behaviour.
Overall, an increase in dried fig moisture content up to
18.4% considerably decreased the values of all the param-eters measured in the TPA tests (except cohesiveness and
springiness). Statistical analysis indicated that further in-crease in fig moisture content within the range of 18.4-46% did not affect the values of hardness, work, gradient,
gummi-ness, springiness and adhesiveness. In a research of Figiel
and Tanjner-Czopek(2006), who examined the effect of
moisture content on texture of candy, the critical moisture
content of about 2% was reported.
Dehydrated, low-moisture and frozen foods, which are
very sensitive to changes in moisture content and tempera-ture, are typically in an amorphous metastable state either
as a very viscous amorphous matrix (known as ‘glass’) or as a more mobile amorphous structure (known as rub
-ber). The changes from the glassy to the rubbery state occur at Tg which is specific for each material and strongly
depends on moisture content and its chemical
composi-tion (Levine and Slade, 1992; Sa et al., 1999). All these different physical states of the material are well described in a phase state diagram showing transition temperatures
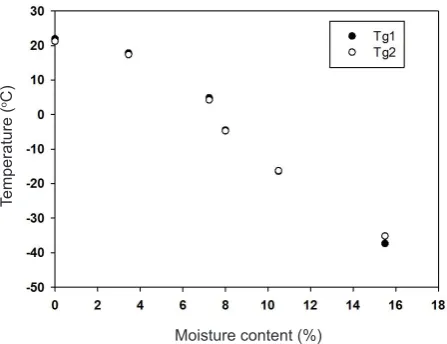
(eg glass transition and melting) as a function of water content (Rahman, 2006). Figure 5 presents the state dia
-gram obtained for sun-dried figs (or the effect of moisture content on the glass transition temperature (Tg)). In the low and intermediate moisture content domain (aw<0.81),
studied in this article, the plasticizing effect of water on the Tg was evident, with a reduction of Tg by increas -ing moisture content. Similar results regard-ing the effect of aw on Tg were obtained by Moraga et al. (2011), Sa et al. (1999), and Telis and Sorbal (2002), for
freeze-dried/air-dried tomato, freeze-dried apple and banana slices and fresh/processed apples, respectively.
Glass transition is an example of second-order
transi-tion which is characterised by a discontinuity in a material’s
physical, mechanical, electrical, thermal and other
proper-ties. The typical DSC curve of sun-dried figs with different moisture content is shown in Fig. 6. As can be seen, at all
moisture contents, glass transition occurs over a
tempera-ture range (not a point), and the onset, midpoint or endset temperature of the change in heat flow may be considered as Tg. Considering the moisture content of figs rehydrated at different temperatures (13.5-45.9%), all rehydrated figs are in rubbery state while the sun-dried figs (control sample)
are in glass-rubber transition region. According to Huang
(1999), the physical state of the structural matrix ranges from the glassy state to and through the following regions: glass-rubber transition, rubbery plateau, rubbery flow, and viscous flow, which greatly influences the rheological prop -erties of food products. Even during the glass transition range alone, the rheological properties can change as much
as 1000 times (Huang, 1999). Indeed, when the material
transforms from the glassy to the rubbery state, the
mol-ecules become mobile, which can alter food structure and
microstructure, crystallisation, rates of diffusion, stabi-lisation of microbial cells and spores, and chemical and
biochemical reactions (Slade and Levine, 1991). This may explain the intensive loss of hardness as well as the
Fig. 5. State diagram of dried figs (Tg of dried-figs with two replicates).
Fig. 6. DSC traces of dried figs at different moisture contents. Moisture content (%)
Temperature (oC)
Temperature (
oC)
Normalized heat flow (W g
-1)
2% 3% 4% 8.5%
occurrence of stickiness in rehydrated figs compared with dried ones; however, in all rubbery state samples, the tex
-ture properties did not change significantly.
CONCLUSIONS
1. A moisture based process control is a must for fig
processing during rehydration, as during the rehydration
process of dried figs extra rehydration above the critical moisture content does not soften the texture significantly. However more moisture may increase browning reactions
substantially.
2. A negative area in the texture profile analysis plot of rehydrated figs is an indication of adhesiveness which was zero in control dried figs.
3. Based on the results of the texture profile analysis tests, a critical moisture content equal to 18.4% was proved. An increase in dried fig moisture content in the range of 6.2-18.4% caused a significant decrease in the texture profile analysis parameters studied (ie hardness, work, gra
-dient, gumminess and chewiness). Whereas, an increase in moisture content above 18.4% did not cause any significant
decreases in the values of the mentioned parameters. 4. The glassy to rubbery transition measured from the
DSC method may explain the texture changes of figs with
different moisture content.
5. Considering the typical thermogram of differential scanning calorimeter all rehydrated figs are in rubbery state while the sun-dried figs are in glass-rubber transition region.
REFERENCES
Adhikari B., Howes T., Bhandari B.R., and Truong V., 2001.
Stickiness in foods: a review of mechanisms and test meth-ods. Int. J. Food Prop., 4 (1), 1-33.
Ansari S., Maftoon-Azad N., Hosseini E., Farahnaky A., and
Asadi Gh., 2014. Modeling the Rehydration Behavior of
Dried Figs. J. Agric. Sci. Technol., (in press).
AOAC, 1990. Official Methods of Analysis, 15th ed. Association of Official Analytical Chemist, Washington, DC, USA.
Athmaselvi K.A., Alagusundaram K., Kavitha C.V., and
Arumu-ganathan T., 2012. Impact of pretreatment on colour and
texture of watermelon rind. Int. Agrophys., 26, 235-242.
Bourne M.C., 1978. Texture profile analysis. Food Technol., 32, 62-66.
Bourne M.C., 1980. Texture evaluation of horticultural crops. Hort. Sci., 15, 51-56.
Cox S., Gupta S., and Abu-ghannam N., 2012. Effect of
differ-ent rehydration temperatures on the moisture, contdiffer-ent of phenolic compounds, antioxidant capacity and textural properties of edible Irish brown seaweed. LWT - Food Sci. Technol., 47, 300-307.
Delgado A.E. and Sun D.W., 2002. Desorption isotherms and
glass transition temperature for chicken meat. J. Food Eng., 55, 1-8.
FAO, 2012. Statistical database. (Available from http:// www.fao. org)
Figiel A. and Tajner-Czopek A., 2006. The effect of candy mois-ture content on texmois-ture. J. Food Serv., 17, 189-195.
Guine R.P.F. and Barroca M.J., 2011. Influence of freeze-drying treatment on the texture of mushrooms and onions. Croat. J. Food Sci. Tech., 3 (2), 26-31.
Hansen S.L., Ray P.M., Karlsson A.O., Jorgensen B., Borkhardt B., Petersen B.L., and Ulvskov P., 2011. Mechanical Properties of Plant Cell Walls Probed by Relaxation Spectra. Plant Physiol., 155, 246-258.
Huang V.T., 1999. Effect of glass transitions on the rheological properties of food polymers. Macromol. Symp., 140, 125-135.
Krokida M.K. and Marinos-Kouris D., 2003. Rehydration
kinetics of dehydrated products. J. Food Eng., 57, 1-7.
Levine H. and Slade L., 1988. Water as plasticizer: physico-chemical aspects of low-moisture polymeric systems. In: Water Science Review 3 (Ed. F. Franks), Cambridge University Press, Cambridge, MA, USA.
Levine H. and Slade L., 1992. Glass Transition in foods. In: Physical Chemistry of Foods (Eds H.G. Schwartzberg, R.W. Hartel), Marcel Dekker, New York, USA.
Maldonado S., Arnau E., and Bertuzzi M.A., 2010. Effect of
temperature and pretreatment on water diffusion during rehydration of dehydrated mangoes. J. Food Eng., 96, 333-341.
Moraga G., Talens P., Moraga M.J., and Martinez-Navarrete N., 2011. Implication of water activity and glass transition on the mechanical and optical properties of freeze-dried apple and banana slices. J. Food Eng., 106 (3), 212-219
Oztekin S., Zorlugence B., and Zorlugence F., 2006. Effects of ozone treatment on microflora of dried figs. J. Food Eng., 75, 396-399.
Peaucelle A., Braybrook S.A., Guillou L.L., Bron E., Kuhlemeier C., and Hofte H., 2011. Pectin-Induced changes in cell wall mechanics underlie organ initiation in arabidopsis. Curr. Biol., 21, 1720-1726.
Rahman M.S.H. and Al-farsi S.A., 2005. Instrumental texture
profile analysis (TPA) of date flesh as a function of moisture content. J. Food Eng., 66, 505-511.
Rahman M.S., 2006. State diagram of foods: Its potential use in food processing and product stability. Trends Food Sci. Tech., 17, 129-141.
Roos Y., 1995. Water activity and glass transition temperature: How do they compliment and how do they differ. In: Food Preservation by Moisture Control Fundamentals and Applica- tions (Eds. G.V. Barbosa-Canovas and J. Welti-Chanes). Technomic Publishing Co., Lancaster, UK.
Roos Y.H., 2003. Thermal analysis, state transitions and food quality. J. Therm. Anal. Calorim., 71, 197-203.
Sa M.M., Figueiredo A.M., and Sereno A.M., 1999. Glass
tran-sitions and state diagrams for fresh and processed apple. Thermochim. Acta, 329, 31-38.
Sanjuan N., Carcel J.A., Clemente G., and Mulet A., 2001.
Modelling of the rehydration process of brocolli florets. Eur. Food Res. Technol., 212, 449-453.
Seow C.C. and Thevamalar K., 1988. Problems associated with
traditional Malaysian starch-based intermediate moisture foods. In: Food Preservation by Moisture Control (Ed. C.C. Seow). Elsevier Applied Science, London, UK.
Szczesniak A.S., 1998. Effect of storage on texture. In: Food Storage stability (Eds I.A. Taub, R.P. Singh). CRC Press, Boca Raton, FL, USA.
Szczesniak-Surmacka A., 2002. Texture is a sensory property.
Food Qual. Prefer., 13, 215-225.
Telis V.R.N. and Sobral P.J.A., 2002. Glass transitions for freeze- dried and air-dried tomato. Food Res. Int., 35, 435-443.
Unal H., Alpsoy H.C., and Ayhan A., 2013. Effect of the
mois-ture content on the physical properties of bitter gourd seed. Int. Agrophys., 27, 455-461.
Veberic R., Colaric M., and Stampar F., 2008. Phenolic acids
and flavonoids of fig fruit (Ficus carica L.) in the northern Mediterranean region. Food Chem., 106, 153-157