R E S E A R C H
Open Access
Invariant heart beat span versus variant heart
beat intervals and its application to fetal ECG
extraction
Huawen Yan
1, Hongxing Liu
1*, Xiaolin Huang
1, Ying Zhao
1, Junfeng Si
1and Tiebing Liu
2** Correspondence:
[email protected];[email protected] 1School of Electronic Science and
Engineering, Nanjing University, Xianlin Campus, Nanjing 210023, China
2Nanjing General Hospital of
Nanjing Military command, Nanjing 210002, China
Abstract
Background:The fundamental assumptions for various kinds of fetal electrocardiogram (fECG) extraction methods are not consistent with each other, which is a very important problem needed to be ascertained.
Methods:Based on two public databases, the regularity on ECG wave durations for normal sinus rhythm is investigated statistically. Taking the ascertained regularity as an assumption, a new fECG extraction algorithm is proposed, called Partial R-R interval Resampling (PRR).
Results:Both synthetic and real abdominal ECG signals are used to test the algorithm. The results indicate that the PRR algorithm has better performance over the whole R-R interval resampling based comb filtering method (RR) and linear template method (LP), which takes advantages of both LP and RR.
Conclusions:The final drawn conclusion is: (1) the proposition should be true that the individual’s heart beat span is invariable for normal sinus rhythm; (2) the proposed PRR fetal ECG extraction algorithm can estimate the maternal ECG (mECG) more accurately and stably even in the condition of large HRV, finally resulting in better fetal ECG extraction.
Keywords:Fetal ECG extraction, HRV, Template, Comb filter
Background
Non-invasive fetal electrocardiogram (fECG) extraction is a classic dilemma in biomedical signal processing. Researchers put forward various kinds of methods to solve this problem. These methods can be classified into: (1) multi-channel methods, like principal component analysis and its variants [1-3], independent component analysis [4,5], periodic component analysis (piCA) [6-9], some wavelet based methods [10,11], adaptive method [12-14] and so on; (2) single-channel methods, such as singular value decomposition (SVD) [15], R-R interval resampling based comb filter (RR) [16], linear template methods (LP) [17-21] and so on; (3) and fusion methods [22-25]. A detailed description about these methods can be found in literature [26].
Among the above three kinds of methods, the single-channel methods are always used to subtract the maternal electrocardiogram (mECG) component from the mixed abdominal ECG (aECG) recording. Since mECG component usually takes up the
highest proportion in aECG, the accurate estimation of mECG component is a key procedure to obtain final high-quality fECG.
When using SVD [15] and RR [16] methods to estimate mECG component, R-R interval resampling is required because of the periodicity and the heart rate variability (HRV) of mECG signal. In essence, an underlying hypothesis is taken that the lengths of various waves in each cardiac cycle are proportional to the length of the R-R interval (heart beat interval).
Linear template (LP) [17-21] methods are simple, effective and widely used mECG estimation methods. In LP methods, the wave complexes in current cardiac cycle are estimated by summing the weighted wave complexes from neighbour cardiac cycles, depending on at least the peak detection of each QRS complex for different heart cycles. In essence, it is assumed that when heart beat interval is time-variant, the heart beat span (i.e. the length from the beginning of P wave to the end of T wave) is stable. So no resampling step is taken in current LP methods.
For the above two assumptions, there is no clear conclusion on which one is cor-rect. In [27,28], it is said that the length from the beginning of P wave to the peak of R wave (Ps-R) is weakly dependent on heart rate, while in literatures [21,29] the authors think it depends on the instantaneous heart rate. As for the length from the peak of R wave to the end of the T wave (R-Te), literatures [27,28] have the opinion that the T wave is strongly dependent on heart rate, becoming narrower and closer to the QRS complex at rapid heart rates, while the opposite view is given in [21]. In [28], it is considered that the length from the end of T wave to the beginning of next P wave (Te-Ps) is strongly dependent on the heartbeat duration. So far, we have not seen literatures to ascertain such disagreement problem for normal sinus rhythm.
Obviously, the above disagreement problem is related to whether SVD, RR and LP methods are used correctly. It is a very crucial thing for designing a high-quality fECG extraction method, especially when the mECG has large HRV.
Based on MIT Normal Sinus Rhythm Database (NSRDB as Set A) [30] and the MIT-BIH Arrhythmia Database (ADB as Set B) [30,31], the problem is investigated in this paper and a regularity comes out that heart beat span is invariant for variable heart beat intervals. Then we propose a new corresponding single channel fECG extraction algorithm based on the regularity. Both HRV and periodicity are con-sidered in the method. And its effectiveness is verified by synthetic and real recordings.
Methods
Investigation on regularity of ECG waves duration
A typical complete cardiac cycle is showed in Figure 1. Ps is the beginning point of P wave, and Te is the end point of T wave. Each cardiac cycle begins with a Ps point, including P wave, QRS complexes, T wave and then ends at the next Ps point. Let’s define the period from Ps to Te as heart beat span, and the period from Te to the next Ps as diastolic period.
containing 48 two-channel recordings with different degree of arrhythmia; the sampling frequency is 360 Hz.
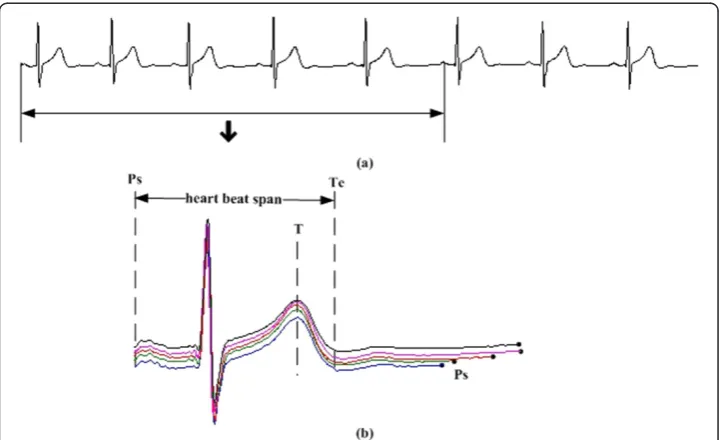
Take the record “19093” from Set A as an example. A period from its first channel is given in Figure 2(a) and the first 5 cardiac cycles are depicted in Figure 2(b). It is quite obvious that the heart beat spans of the five cardiac cycles are almost the same, while the diastolic periods are quite different in length. The length of Ps-Ps (tPs-Ps), the length of
Ps-R (tPs-R), the length of R-Te (tR-Te) and the length of Te-Ps (tTe-Ps) for the first 500
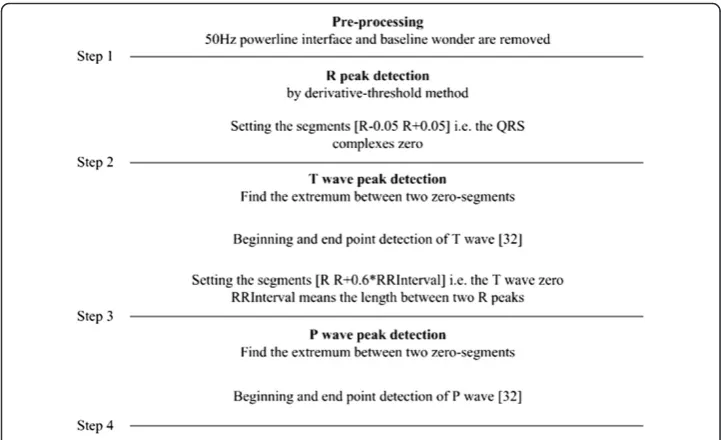
-seconds-length data of record“19093”are illustrated in Figure 3. Details about how these characteristic waves are detected can be seen in Figure 4; an eye inspection is a must to ensure the validation of the detected results. And the final results are exported after manually correcting the inappropriate detections. Gradients (ks) for regression lines of
tPs-Rvs. tPs-Ps, tR-Tevs. tPs-Psand tTe-Psvs. tPs-Psare also calculated and listed in Figure 3.
SincekfortTe-Psvs.tPs-Psis nearly one andks for the other two are almost zero, we can
say that the length differences of Ps-Ps intervals are reflected totally by the change oftTe-Ps.
The above result on record “19093” presents that the tPs-Rand tR-Te are quite stable
compared with tPs-Ps. That is, there exists so called invariant heart beat span with the
variant heart beat intervals. A further validation with the databases is given below.
Figure 2Duration regularity for different cardiac cycles. (a)data from the first channel of“19093”, (b)durations of five cardiac cycles.
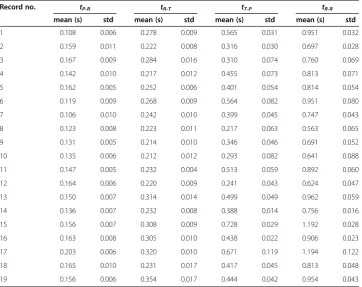
First, because of the difficulty in detecting Ps and Te points accurately, for conveni-ence we replace Ps-R by P-R interval, R-Te by R-T interval, Te-Ps by T-P interval and Ps-Ps by R-R interval for statistics’ validation. If the above conclusion from data “19093”is correct, the both substitute intervals P-R and R-T also should be stable, and T-P interval and R-R interval should always vary accordingly. Then, twelve records from Set A and seven from Set B with obvious P and T waves are selected. The first 500 seconds (s) data for each selected record are cut out for statistical analysis. Note that pieces that P or T wave is not clear are thrown away.
As in Table 1 shown, for the nineteen records the lengths of T-P (tT-P) and R-R
inter-val (tR-R) change all the time, their standard deviation (std) are about 10− 2
; the lengths of P-R (tP-R) and R-T interval (tR-T) are comparatively stable, their std are 10−3. FortP-R
Figure 3tPs-Ps,tPs-R,tR-Te,tTe-Psand the gradients (k) (data: 19093). (a)tPs-Rvs.tPs-Ps,(b)tR-Tevs.tPs-Ps,(c)
tTe-Psvs.tPs-Ps.
vs.tR-RandtR-Tvs.tR-Rtheir gradients are in the order of 10−2; fortT-Pvs.tR-Rthe
gradi-ents are bigger than 0.85. Considering the std and gradigradi-ents, we think the results are con-sistent with that on record“19093”. The conclusion agrees with the underlying hypothesis taken by LP. It also illustrates the irrationality lying in SVD [15] and RR [16] methods.
Partial R-R interval resampling based fECG extraction Algorithm (PRR)
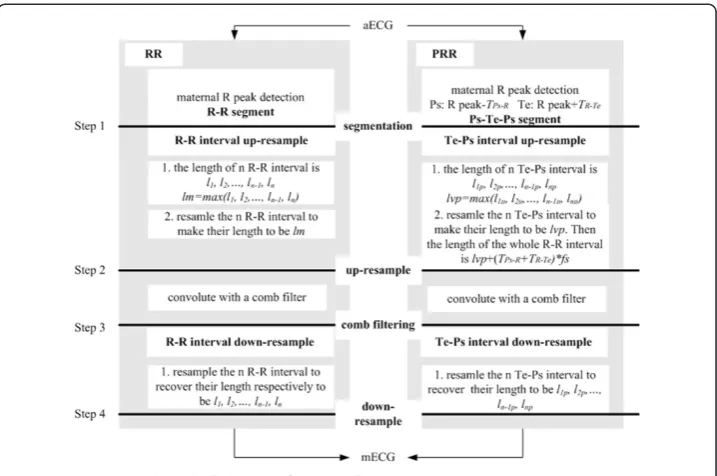
According to the conclusion earlier mentioned, combining the advantages of LP and RR method, a modified fECG extraction algorithm is proposed. The core algorithm is shown in Figure 5. Unlike RR method, the proposed algorithm only resamples part of each R-R interval, so it is called Partially R-R Resampling based comb filter i.e. PRR.
The proposed core steps of PRR are further described as follows:
Step 1 in Figure 5: segmentation. Detect the maternal R peaks in aECG. Take the Ps point as the pointTPs-Rs before each R peak and Te point as the pointTR-Tes after each
R peak. Then a complete cardiac cycle can be divided as Ps-Te-Ps. Ps-Te period is the previously mentioned heart beat span and Te-Ps period is the diastolic period.
Step 2 in Figure 5: Te-Ps interval up-resample. Denote the lengths of diastolic period as
l1p, l2p,…, lnp-1, lnp(points). Each diastolic period is resampled to have the same number of
sampleslvp.lvpcan be the maximum one ofl1p, l2p,…, lnp-1, lnp. Thus every diastolic period
is up resampled. And every heart beat span keeps unchanged. The total length of a cardiac cycle after resampling isL= (TPs-R+TR-Te)*fs+lvp, herefsis the sampling rate .
Step 3 in Figure 5: comb filtering. The up-resampled periodic signal convolutes with a comb filter. The designing detail for a comb filter can be found in literature [16]. The result is an estimation of up-resampled mECG.
Table 1tP-R,tR-T,tT-PandtR-Rfor the nineteen records in Set A and Set B
Record no. tP-R tR-T tT-P tR-R
mean (s) std mean (s) std mean (s) std mean (s) std
1 0.108 0.006 0.278 0.009 0.565 0.031 0.951 0.032
2 0.159 0.011 0.222 0.008 0.316 0.030 0.697 0.028
3 0.167 0.009 0.284 0.016 0.310 0.074 0.760 0.069
4 0.142 0.010 0.217 0.012 0.455 0.073 0.813 0.071
5 0.162 0.005 0.252 0.006 0.401 0.054 0.814 0.054
6 0.119 0.009 0.268 0.009 0.564 0.082 0.951 0.080
7 0.106 0.010 0.242 0.010 0.399 0.045 0.747 0.043
8 0.123 0.008 0.223 0.011 0.217 0.063 0.563 0.065
9 0.131 0.005 0.214 0.010 0.346 0.046 0.691 0.052
10 0.135 0.006 0.212 0.012 0.293 0.082 0.641 0.088
11 0.147 0.005 0.232 0.004 0.513 0.059 0.892 0.060
12 0.164 0.006 0.220 0.009 0.241 0.043 0.624 0.047
13 0.150 0.007 0.314 0.014 0.499 0.049 0.962 0.059
14 0.136 0.007 0.232 0.008 0.388 0.014 0.756 0.016
15 0.156 0.007 0.308 0.009 0.728 0.029 1.192 0.028
16 0.163 0.008 0.305 0.010 0.438 0.022 0.906 0.023
17 0.203 0.006 0.320 0.010 0.671 0.119 1.194 0.122
18 0.165 0.010 0.231 0.017 0.417 0.045 0.813 0.048
Step 4 in Figure 5: Te-Ps interval down-resample. Resample diastolic periods of the estimated up-resampled mECG to recover their original lengths. It turns out to be the estimation to mECG. The residual ECG (rECG) is obtained after subtracting it from the ori-ginal aECG. The rECG can be seen as the estimation to fECG; of course, the noise can be weakened in a further step to get a clearer fECG which is not discussed in the paper.
In above Step 1, theTPs-RandTR-Tevalues have slight difference for different
individ-uals. TPs-Rlies between 0.15 and 0.20 s, whileTR-Telies 0.20 to 0.35 s [29]. In reality, it
is difficult to detect the points Ps and Te steadily online, since P wave and T wave may be invisible in aECG. Therefore, we set TPs-R=0.2 s andTR-Te= 0.4 s fixedly in the
pro-posed PRR. A further illustration about this can be found in the Discussion Section.
Results
The performance of the PRR algorithm is tested on synthetic mECG and aECG data and real antenatal abdominal recordings. The RR and LP are also implemented for compari-son. In LP, the template window is chosen as the window betweenR peak−5/12TandR peak+ 7/12T, hereTis the average length of several R-R intervals [17,18].
Tests on synthetic data
The simulated synthetic data is created as follows: (1) generate the ECG without HRV as in literature [33]; (2) change the length of each Te-Ps interval, to make it has HRV and constant heart beat span. The new length of a changed Te-Ps intervalN= (1 +r×rand) ×
n, here n is the original length of a Te-Ps interval,randis a random number between−1 and 1, andris a set number between 0 and 1, called HRV variation coefficient. The bigger
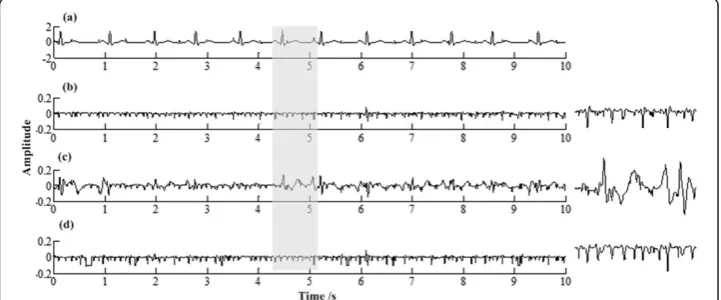
r, the larger signal’s HRV. Figure 6(a) gives an example of the synthetic ECG withr= 0.4. For the simulated synthetic data showed in Figure 6(a), its ECG component is estimated by PRR, RR and LP respectively. The estimation errors are calculated and
showed in Figure 6(b-d) respectively, in whicherror= eECG-ECG, with eECG repre-senting the estimation of ECG. The root mean squares (RMS) of the estimation errors are also calculated, which are 0.0159, 0.0234 and 0.0419 respectively.
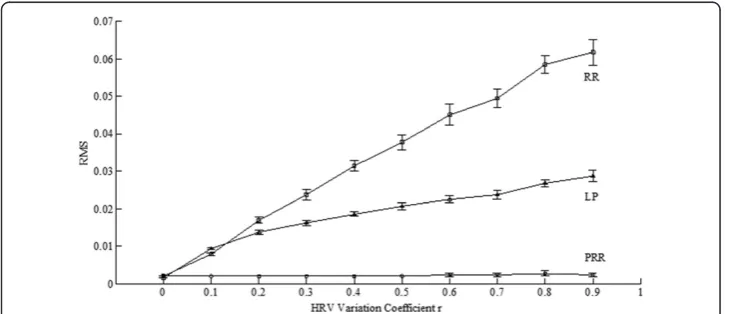
Further take r as 0, 0.1, …, 0.8, 0.9 respectively to generate synthetic data to test. Create 20 synthetic ECG data for eachr. The tested results are depicted with an error-bar plot as Figure 7, in which the Y-axis represents RMS value of the estimation errors.
We also generate 20 synthetic aECGs to test. For each synthetic aECG, we fixedly set
r= 0.4 to create its mECG component andr= 0 to create its fECG component. In the test, the mECG components are estimated and subtracted from aECGs, resulting in rECGs. Then the added fECG components are excluded from rECGs, obtaining the resultant errors, whose wave power ratios (WPR s) are listed in Table 2. The WPR is defined as
W PR¼
Xi¼N i¼1
Xn¼e n¼srECG
2
ið Þn Xi¼N
i¼1
Xn¼e n¼saECG
2
ið Þn
heresand eare respectively the point 0.2 s before and 0.4 s afteri-th R peak.Nis the number of R peaks. The numerator measures the residual mECG component power in
Figure 6Estimation errors for PRR, RR and LP whenr= 0.4. (a)the original synthetic ECG,(b)the error by PRR,(c)the error by RR,(d)the error by LP.
rECG, while the denominator mainly measures the original mECG power in aECG. TheWPRindicates how much mECG component is kept in rECG. Figure 8 has illus-trated estimation errors for a specific aECG when using three methods, and their
WPRcalculated are 0.0034, 0.0166 and 0.0048 respectively.
From Figure 6(b-d) and Figure 8(b-d), it’s quite clear that: (1) RR method always has quite serious erroneous estimations on P and T waves; (2) LP method may have some transient errors at the edges of a diastolic period; (3) for PRR and LP, their estimations to the QRS complexes are almost the same. From Figure 7 it’s showed that: whenr= 0, i.e. ECG has no HRV, the RMSs of errors for synthetic ECGs are the same for the three method; for others, RMSs for RR and LP increase with r but RMSs for PRR stay the same. Generally speaking, the tests on synthetic ECG show that PRR can estimate the ECG signal more accurately especially when it has large HRV.
Experiments on real data
Tests are taken on data from MIT ADFED [30,31] which contains five real-life records. Each record has five channels - one direct fECG and four abdominal ECG. The sampling rate is 1 KHz and their sampling durations are five minutes.
First, take record “r01” to test. 12 pieces of 5 second-length signals from 2.5 s to 62.5 s of the whole record are chosen. According to the steps described in Figure 5, mECGs are estimated and rECGs are obtained for these signals. rECGs and their spectrums by PRR, RR and LP respectively are depicted in Figure 9(b-e, g-j). From Table 2WPRsusing PRR, RR and LP for 20 synthetic aECGs
No. 1 2 3 4 5 6 7 8 9 10
PRR × 10−2 0.403 0.857 0.504 1.376 0.514 2.324 0.581 1.768 1.873 0.442
RR × 10−2 2.507 2.274 2.075 2.272 1.523 3.978 1.939 3.199 3.428 2.521
LP × 10−2 0.447 0.920 0.570 1.616 0.557 2.556 0.667 1.910 2.249 0.494
No. 11 12 13 14 15 16 17 18 19 20
PRR × 10−2 0.687 0.480 0.541 0.784 0.500 0.520 0.531 0.604 0.455 1.072
RR × 10−2 2.029 1.867 2.252 1.770 2.405 1.989 1.801 2.935 2.114 1.445
LP × 10−2 0.762 0.540 0.591 0.909 0.517 0.619 0.650 0.674 0.505 1.135
Figure 9, the three methods have almost same residual maternal QRS complexes; how-ever, RR method has larger residual maternal T wave than the other two methods. The
WPRs for rECGs of the 12 pieces are listed in Table 3. We can see that the WPRs for PRR are always the smallest among the three methods.
The errorbar of WPRs for all the five records are depicted in Figure 10. Generally speaking, theWPRs for PRR are the smallest.
Discussion
On invariant heart beat span
Based on the lengths of ECG waves for recordings in Set A and Set B, we get a conclu-sion that for normal sinus rhythm when the instant heart beat interval changes the heart beat span keeps almost unchanged, while the length of diastolic period fluctuates with heart beat interval.
HRV is always explained by the autonomic nerve’s regulation of heart and circulation system [34]. The activity of parasympathetic or sympathetic nervous system affects the sinus node’s beating rhythm [26,27], and further affect the heart beat to have HRV. However, autonomic nerve may affect HRV just by determining the beat beginning point, i.e., Ps point on ECG, don't control the duration of heart being excited, i.e., heart beat span. The heart beat span for a person should only be determined by his or her
Figure 9The rECG for“r01”by the proposed method PRR, RR and LP. (a)abdominal ECG,(f)spectrum of abdominal ECG,(b)residual ECG obtained by PRR,(g)spectrum of the residual ECG obtained by PRR,(c)residual ECG obtained by RR,(h)spectrum of the residual ECG obtained by RR,(d)residual ECG obtained by LP,(i) spectrum of the residual ECG obtained by LP,(e)the corresponding direct fECG and(j)spectrum of the direct fECG. (The grey segments indicate the residue of mECG complexes).
Table 3WPRs for rECGs of record“r01”(*indicate the signal piece showed in Figure 9)
No. 1 2 *3 4 5 6 7 8 9 10 11 12
PRR 0.0723 0.0718 0.0739 0.0714 0.0702 0.0644 0.074 0.0631 0.0863 0.0750 0.0702 0.1056
RR 0.0782 0.095 0.1098 0.0881 0.0777 0.0724 0.0756 0.0726 0.0884 0.0790 0.0747 0.1084
own heart's physiology and healthy condition itself. Therefore, if there is no conduc-tion block disease, the HRV for normal sinus rhythm just affects the variaconduc-tion of the length of Te-Ps interval. The lengths of P wave, P-R interval, QRS wave and S-T interval are independent of the heart beat rate [26], which constituting the stable heart beat span.
Individual difference’s effect on PRR performance
In Method Section we setTPs-Rand TR-Teto be fixed. But actually different individuals
may have slight difference on them. Now we discuss the effect below.
Generating 11 synthetic ECG signals as Result Section described. Their ris 0.4. The real lengths of Ps-R tPs-Rand R-Te tR-Te intervals for these signals and their offsets to
TPs-RandTR-Teare listed in Table 4. The RMS for estimation errors by using PRR and
RR are given in Figure 11. For PRR whenTPs-RandTR-Teget closer to their real values,
the RMS becomes smaller; when they are equal the RMS-curve gets its minimum. The offset between them indeed affects PRR’s performance. In addition, no matter how large the offset is, the proposed method outperforms RR method. Considering the difficulty in P wave detection and its lower amplitude compared with T wave, in PRR TPs-Rcan
be set as a fixed value while TR-Te can be decided online according to the T peak
detection.
Conclusions
With statistical analysis to the lengths of ECG waves from two databases, the conclu-sion comes out: heart beat span is invariant while the heart beat interval changes all
Figure 10The errorbar ofWPRsfor five real records.
Table 4 The real lengths of Ps-R and R-Te intervals and their offsets to the fixed values for the 11 synthetic signals
tPs-R(s) 0.15 0.16 0.17 0.18 0.19 0.2 0.21 0.22 0.23 0.24 0.25
tR-Te(s) 0.30 0.32 0.34 0.36 0.38 0.4 0.42 0.44 0.46 0.48 0.50
the time. According to this prior information, a new modified fECG extraction algo-rithm is proposed called PRR. It copes with the mECG estimation inaccuracy caused by HRV and enhances the signal to noise ratio of the remaining fECG signal. Experiments show that the larger the HRV, the more obvious the advantage of PRR over other methods. So the proposed PRR method is outstanding on robustness, and it is believed it can be used into the practical fECG extraction. The computation complexity of this method can be studied in further work.
Competing interests
The authors declare that they have no competing interests.
Authors’contributions
YH was responsible for writing the codes and carried out the experiments. LH conducted the whole experiments and the design of the algorithm. All authors contributed in general concept and writing of the paper. All authors read and approved the final manuscript.
Acknowledgements
This paper is supported by the National Natural Science Foundation of China (No. 61271079).
Received: 16 September 2014 Accepted: 5 December 2014 Published: 12 December 2014
References
1. Langley P, Bowers EJ, Murray A:Principal component analysis as a tool for analyzing beat-to-beat changes in ECG features: application to ECG-derived respiration.IEEE Trans Biomed Eng2010,57:821–829.
2. Jukka A, Lipponen, Tarvainen MP:Principal component model for maternal ECG extraction in fetal QRS detection.Physiol Meas2014,35:1637–1648.
3. Liu C, Li P, Di Maria C, Zhao L, Zhang H, Chen Z:A multi-step method with signal quality assessment and fine-tuning procedure to locate maternal and fetal QRS complexes from abdominal ECG recordings.Physiol Meas
2014,35:1665–1683.
4. Wei L, Rajapakse JC:ICA with Reference.Neurocomputing2006,69:2244–2257.
5. Martin-Clemente R, Jose Luis C-O, Susana H-M, Mar E, Isabel R:Fast Technique for noninvasive fetal ECG extraction.
IEEE Trans Biomed Eng2011,58:227–230.
6. Shi Z, Zhang C:Semi-blind source extraction for fetal electrocardiogram extraction by combining non-Gaussianity and time-correlation.Neurocomputing2007,70:1547–1581.
7. Zhang H, Shi Z, Guo C, Feng E:Semi-blind source extraction algorithm for fetal electrocardiogram based on generalized autocorrelations and reference signals.J Comput Appl Math2009,223:409–420.
8. Sameni R, Jutten C, Shamsollahi MB:Multichannel Electrocardiogram Decomposition Using Periodic Component Analysis.IEEE Trans Biomed Eng2008,55:1935–1940.
9. Tsalaile T, Sameni R, Sanei S, Jutten C, Chambers J:Sequential blind source extraction for quasi-periodic signals with time-varying period.IEEE Trans Biomed Eng2009,56:646–655.
10. Shuicai W, Yanni S, Zhuhuang Z, Lan L, Yanjun Z, Xiaofeng G:Research of fetal ECG extraction using wavelet analysis and adaptive filtering.Comput Biol Med2013,43:1622–1627.
11. Almeida R, Goncalves H, Bernardes J, Ana Paula R:Fetal QRS detection and heart rate estimation: a wavelet-based approach.Physiol Meas2014,35:1723–1735.
12. Puthusserypady S:Extraction of fetal electrocardiogram using H(infinity) adaptive algorithms.Med Bio Eng Comput2007,45:927–937.
13. Assaleh K:Extraction of fetal electrocardiogram using adaptive neuro-fuzzy inference systems.IEEE Trans Biomed Eng2007,54:59–68.
14. Assaleh K, Al-Nashash H:A novel technique for the extraction of fetal ECG using polynomial networks.
IEEE Trans Biomed Eng2006,52:1148–1152.
15. Zeng XP, Li SH, GuoJun Li Y, Zhou DHM:Fetal ECG extraction by combining single-channel SVD and cyclostationarity-based blind source separation.Int J Signal Process, Image Process Pattern Recognit2013,6:367–376. 16. Wei Z, Hongxing L, Aijun H, Xinbao N, Jianchun C:Single-lead fetal electrocardiogram estimation by means of
combining R-peak detection, resampling and comb filter.Med Eng Phys2010,32:708–719.
17. Comani S, Mantini D, Lagatta A, Esposito F, Di Luzio S, Romani GL:Time course reconstruction of fetal cardiac signals from fMCG: independent component analysis versus adaptive maternal beat subtraction.Physio Meas
2004,25:1305–1321.
18. Mihaela U, Johannes WM B, Swan Guid O, Rodica S:Fetal ECG extraction during labor using an adaptive maternal beat subtraction technique.Biomed Tech2007,52:56–60.
19. Cerutti S, Baselli G, Civardi S, Ferrazzi E, Anna Maria M, Massimo P, Giorgio P:Variability analysis of fetal heart rate signals as obtained from abdominal electrocardiographic recordings.J Perinat Med1986,14:445–452. 20. Martens SMM, Chiara R, Massimo M, Sluijter RJ:A robust fetal ECG detection method for abdominal recordings.
Physiol Meas2007,28:373–388.
21. Vullings R, Peters CHL, Sluijter RJ, Mischi M, Oei SG, Bergmans JWM:Dynamic segmentation and linear prediction for maternal ECG removal in antenatal abdominal recordings.Physiol Meas2009,30:291–307. 22. Andreotti F, Riedl M, Himmelsbach T, Wedekind D, Wessel N, Stepan H, Schmieder C, Jank A, Malberg H,
Zaunseder S:Robust fetal ECG extraction and detection from abdominal leads.Physiol Meas2014,35:1551–1567. 23. Christov I, Simova I, Abacherli R:Extraction of the fetal ECG in noninvasive recordings by signal
decompositions.Physiol Meas2014,35:1713–1721.
24. Varanini M, Tartarisco G, Billeci L, Macerata A, Pioggia G, Balocchi R:An efficient unsuperivsed fetal QRS complex detection from abdominal maternal ECG.Physiol Meas2014,35:16.7–1619.
25. Haghpanahi M, Borkholder DA:Fetal QRS extraction from abdominal recordings via model-based signal processing and intelligent signal merging.Physiol Meas2014,35:1591–1605.
26. Clifford GD, Ikaro S, Joachim B, Moody GB:Non-invasive fetal ECG analysis.Physiol Meas2014,35:1521–1536. 27. Rajendra Acharya U, Paul Joseph K, Kannathal N, Choo Min L, Suri JS:Hear rate variability: a review.Med Bio Eng
Comput2004,44:1031–1051.
28. Leif S, Pablo L:Bioelectrical Signal Processing in Cardiac and Neurological Applications.: Academic Press; 2005. 29. Guyton AC, Hall JE:Textbook of Medical Physiology.10th edition. Philadelphia: W B Saunders; 2000.
30. Goldberger AL, Amaral LAN, Glass L, Hausdorff JM, Ivanov PC, Mark RG, Mietus JE, Moody GB, Peng C-K, Stanley HE: PhysioBank, PhysioToolkit, and PhysioNet: Components of a New Research Resource for Complex Physiologic Signals.Circulation2000,101:e215–e220. Circulation Electronic Pages [http://circ.ahajournals.org/content/101/23/e215.full] 31. Jezewski J, Matonia A, Kupka T, Roj D, Czabanski R:Determination of the fetal heart rate from abdominal
signals: evaluation of beat-to-beat accuracy in relation to the direct fetal electrocardiogram.Biomed Tech
2012,57:383–394.
32. Mao L, Zhang G, Sun J:P wave detection in ECG signal based on location estimation and recognition post-processing.Signal Process2009,25:948–952.
33. McSharry PE, Clifford GD, Tarassenko L, Smith L:A dynamical model for generating synthetic electrocardiogram signals.IEEE Trans Biomed Eng2003,50:289–294.
34. Philip Saul J:Beat-to-beat variations of heart rate reflect modulation of cardiac autonomic outflow.
News Physiol Sci1990,5:32–37.
doi:10.1186/1475-925X-13-163
Cite this article as:Yanet al.:Invariant heart beat span versus variant heart beat intervals and its application to fetal ECG extraction.BioMedical Engineering OnLine201413:163.
Submit your next manuscript to BioMed Central and take full advantage of:
• Convenient online submission
• Thorough peer review
• No space constraints or color figure charges
• Immediate publication on acceptance
• Inclusion in PubMed, CAS, Scopus and Google Scholar
• Research which is freely available for redistribution