R E S E A R C H A R T I C L E
Open Access
Comparison of glaucoma diagnostic ability
of ganglion cell-inner plexiform layer
according to the range around the fovea
Jae Ho Jung
1, Je Hyun Seo
2, Min Seung Kang
3and Jonghoon Shin
3,4,5*Abstract
Background:To compare the glaucoma diagnostic ability of the ganglion cell-inner plexiform layer (GCIPL) thickness depending on the range around the fovea using wide-angle, swept-source optical coherence tomography (SS-OCT).
Methods:We compared the glaucoma diagnostic utility of GCIPL parameters across multiple regions while
centered on the fovea. In a wide-angle scan, the GCIPL for each 1-mm2grid square of a 12 × 9 mm2scan resulted in 108 data points. With respect to the range of the GCIPL measurements around the macula, the wide-angle scan images were classified into three zones. Zone 1 was defined as a narrow area; zone 2 was defined as a mid-sized area; and zone 3 was defined as a wide area. We recorded the quadrant GCIPL thickness, average, and minimum quadrant GCIPL within each zone. The areas under the receiver operating characteristic (AUROCs) curves were calculated to evaluate the glaucoma diagnostic utility.
Results:Sixty-one eyes with glaucoma and 59 normal eyes were assessed. The minimum and average GCIPL
measurements in zones 1–3 in eyes with glaucoma were significantly lower than those in normal eyes (P< 0.001). The AUROCs for the minimum and inferotemporal GCIPL in zone 1 and the inferotemporal GCIPL thickness in zone 2 were greater than 0.9 (0.945, 0.931, and 0.918, respectively).
Conclusions:Wide-angle scanning using SS-OCT will contribute to improvements in the detection of
glaucomatous damage. The minimum and inferotemporal GCIPL in zone 1 may be more useful for detecting glaucoma than those in the conventional area.
Keywords:Glaucoma, Ganglion cell-inner plexiform layer, Wide-angle swept-source OCT
Background
Glaucoma is characterized by the degeneration of ganglion cells, alterations to the optic nerve head morphology, and associated visual field (VF) loss [1,
2]. Previous studies have indicated that considerable
damage to retinal ganglion cells can precede VF loss in patients with suspected glaucoma and that gan-glion cell-inner plexiform layer (GCIPL) parameters are a useful tool in the diagnosis of glaucoma [3–6].
Recently, GCIPL assessment with commercially-available spectral domain optical cohrerence tomography (SD-OCT) tools has become a standard clinical approach; however, this technique has several limitations with respect to the precise GCIPL parameter measurements that are needed to diagnose glaucoma. This protocol relies on the use of a fixed, 6-mm-diameter circular device that was developed not to measure GCIPL thickness but rather to diagnose and monitor significant macular edema in cases of diabetic retinopathy. Therefore, conventional GCIPL measurement may have limited diagnostic sensitivity and specificity when
© The Author(s). 2019Open AccessThis article is distributed under the terms of the Creative Commons Attribution 4.0 International License (http://creativecommons.org/licenses/by/4.0/), which permits unrestricted use, distribution, and reproduction in any medium, provided you give appropriate credit to the original author(s) and the source, provide a link to the Creative Commons license, and indicate if changes were made. The Creative Commons Public Domain Dedication waiver (http://creativecommons.org/publicdomain/zero/1.0/) applies to the data made available in this article, unless otherwise stated. * Correspondence:jjongggal@naver.com
1Department of Ophthalmology, College of Medicine, Seoul National University Hospital, Seoul, South Korea
2Department of Ophthalmology, Veterans Medical Research Institute, Veterans Health Service Medical Center, Seoul, South Korea 3Department of Ophthalmology, College of Medicine, Pusan National University Yangsan Hospital, Yangsan, South Korea
4Department of Ophthalmology, Research Institute for Convergence of Biomedical Science and Technology, Pusan National University Yangsan Hospital, Yangsan, South Korea
the GCIPL loss is less than or greater than 6 mm in diameter.
Swept-source OCT (SS-OCT), a new generation of OCT, was recently developed. This technique allows cli-nicians to obtain a high-quality, wide-angle image that includes coverage of the optic disc and macula and has a rapid scan speed. The SS-OCT technique enables GCIPL parameter calculations for each 1-mm2 grid square across a 12 × 9 mm2 scan, resulting in 108 data points that can be displayed and exported using a built-in pro-gram. Thus, with this tool, investigators can assess spe-cific GCIPL parameters in a wide area of the macula and evaluate GCIPL changes in a particular region of the macula.
The purpose of the present study was to evaluate the glaucoma diagnostic ability of the GCIPL thickness in various areas centered on the fovea using wide-angle SS-OCT. In addition, we validated the various GCIPL mea-surements by comparing their diagnostic utility with that of a conventional GCIPL measurement method and cor-relating the outcomes to VF defects in patients with glaucoma.
Methods
This was a prospective, cross-sectional, comparative study. The study was conducted in compliance with the Health Insurance Portability and Accountability Act and adhered to the tenets of the Declaration of Helsinki, and ethics approval was obtained from the Institutional Review Board (IRB) of Pusan Nation University Yangsan Hospital (IRB #05–2019-005).
Study participants were patients with glaucoma who underwent medical glaucoma treatment and age-matched normal controls who visited our clinic for regular health examinations for refractive errors. Glaucoma was defined with the following criteria: asymmetric cup-to-disc ratio≥ 0.2, vertical cup-to-disc ratio > 0.7, neural rim thinning, lo-calized notching, disc hemorrhage and retinal nerve fiber layer (RNFL) defects with corresponding glaucomatous VF defects. Patients with open-angle glaucoma detected by gonioscopic examination and normal controls with no history of ocular diseases (intraocular pressure (IOP)≤21 mmHg), an absence of a glaucomatous optic disc, and a normal VF were recruited. Subjects were excluded if they had a best-corrected visual acuity (BCVA) of less than 20/ 40; a refractive error beyond the range from−6.0 to + 3.0 diopters; an astigmatism of more than ±3.0 diopters; and a history of ocular trauma, ocular surgery, laser treatment, or ocular and/or systemic disease that could affect the optic nerve or VF.
All participants underwent a complete ophthalmologic examination, which included BCVA measurement, slit-lamp examination, axial length assessment, gonioscopy, dilated fundus examination, and stereoscopic optic disc
photography. An automated VF examination was also performed on all subjects with a standard 24–2 Swedish interactive thresholding algorithm (SITA) program on a Humphrey 740 Visual Field Analyzer (Carl Zeiss Meditec, Dublin, CA, USA). We defined glaucomatous VFs on the basis of the presence of two of the following criteria: (1) an abnormal glaucoma hemifield test result (a borderline score was not considered abnormal); (2) three continuous non-edge points (allowing for two-step nasal edge points) with P< 0.05 on the total deviation plot, with at least one point with a P-value < 0.01; and (3) P < 0.05 for the pattern standard deviation (PSD) on the SITA standard test.
Wide-angle scanning using an SS-OCT device (DRI-OCT-1 Atlantis; Topcon, Tokyo, Japan) was performed on each subject. Wide-angle scanning uses a wide-angle 12 × 9 mm lens, with the scan centered on the fovea, for 256 B-scans, each comprising 512 A-scans, for a total of 131,072 axial scans per volume. A scan time of 1.3 s per 12 × 9 mm2scan, which was previously shown to be suf-ficient for acquiring all images, [7] was used here. Poor-quality images (image-Poor-quality scores less than 50, poorly focused, or decentered during fovea scanning) or those acquired after segmentation failures or with artifacts due to eye movements or blinking were excluded. The built-in DRI-OCT-1 software (version 9.12) automatically identified the outer boundary of the RNFL, from the in-ternal limiting area to the retinal ganglion cells and the outer boundary of the IPL. The difference between the RNFL and the inner plexiform layer (IPL) outer bound-ary yielded the combined GCIPL thickness.
the average of the total grids in the zone; and 3) the mini-mum GCIPL thickness: the grid with the thinnest GCIPL thickness in the zone. We obtained GCIPL parameters
within a 6 × 6 mm2 annulus area centered on the fovea using conventional, automated Cirrus HD-OCT software GCA algorithms.
Fig. 1aA wide-angle scan with swept-sources optic coherence tomography (SS-OCT; DRI-OCT-1 Atlantis; Topcon, Tokyo, Japan) demonstrating the ganglion cell-inner plexiform layer (GCIPL) thickness for each 1-mm2grid square of a 12 mm × 9 mm (horizontal ×
vertical) scan; and these 108 data were collected (green rectangles). We made zone classifications based on the scanned area (centered on the fovea) and the arcuate configuration of the papillomacular bundle.bZone 1 (narrow area); the widest horizontal × vertical scanned length was 4 × 4 mm, with a total of 12 grid squares and 3 squares per quadrant.c Zone 2 (mid-sized area); the widest horizontal × vertical scanned length was 6 × 6 mm, with a total of 24 squares with 6 per quadrant included.dZone 3 (wide area); the widest horizontal X vertical scanned length was 8 × 8 mm, and a total of 40 squares with 10 squares per quadrant were included.e
We obtained three images on the same visit day; two of the three GCIPL parameters were assessed using wide-angle SS-OCT twice to evaluate intraobserver agreement. The half- width of the 95% limits of agreement and intra-class correlation coefficients (ICCs) were calculated. We investigated correlations and agreement among the 6-mm-diameter GCIPL parameters derived via the SD-OCT technique, which were based on the Early Treatment Dia-betic Retinopathy Study (ETDRS) area and GCIPL param-eters from zone 2. Bland-Altman plots were constructed, and Pearson’s correlation coefficients were calculated to analyze correlations and agreements. We evaluated the diagnostic utility of the GCIPL measurements from zone 1, zone 2, and zone 3 for differentiating glaucoma from normal eyes. We also used GCIPL parameters in each quadrant from zones 1, 2, and 3 and constructed receiver operating characteristic (ROC) curves to analyze the diag-nostic accuracies of the newly developed method. The area under the ROC (AUROC) curve was calculated to as-sess the diagnostic accuracy of each measurement. An AUROC of 1.0 represented perfect discrimination, while an AUROC of 0.5 represented discrimination due to chance. The method described by DeLong et al. was used to compare the AUROCs.
Data normality was assessed with the Kolmogorov-Smirnov test. Student’s t-tests or Mann-Whitney U tests were used to compare continuous data. P-values < .05 were considered to indicate statistical significance. Stat-istical analyses were performed using SPSS for Windows 21.0 (SPSS, Inc., Chicago, IL) and Medcalc version 10.0 (Medcalc Software; Ostend, Mariakerke, Belgium).
Results
This study included 61 glaucomatous eyes from 61 pa-tients and 59 normal eyes from 59 healthy individuals. The participants’ demographic data are summarized in Table 1. There were no significant differences in sex,
age, spherical equivalent, axial length, or central corneal thickness (CCT) between the two groups, although there were significant differences in mean deviation (MD) (P< 0.001).
The sectorial, minimum, and average GCIPL measure-ments in zones 1, 2, and 3 as well as the conventional 6 × 6 mm GCIPL thicknesses significantly differed among the normal and glaucoma cohorts (P< 0.001) (Table 2). The GCIPL thickness parameters in the glau-comatous eyes were smaller than those in the eyes of normal controls.
Since zone 2 is similar to the ETDRS area, which was defined as the 6-mm-diameter area centered on the fovea, we analyzed correlations and agreements between the GCIPL parameters from zone 2 and the ETDRS area. The ICCs of the OCT measurements in the superior and inferior areas and the minimal and average measurements in zone 2 were 0.874, 0.882, 0.858, and 0.862, respectively, in the glaucoma group and 0.899, 0.915, 0.928, and 0.958, respectively, in the normal group. The GCIPL measurements in the su-perior and inferior areas and the minimal and average measurements showed a significantly positive correl-ation between the conventional 6 × 6 mm area and zone 2 based on Pearson’s correlation coefficient in both the normal controls (r = 0.805, 0.746, 0.834, and 0.580, respectively) and the glaucoma patients (r = 0.886, 0.879, 0.953, and 0.791, respectively), as illus-trated in Table 3.
A Bland-Altman analysis that compared each GCIPL measurement between the conventional 6 × 6 mm2area and zone 2 revealed differences in the mean thicknesses of the two areas (Table 4). There were no significant correlations between the parameter differences and the mean GCIPL thicknesses for all subjects. In both the normal and glaucoma groups, there was reasonable agree-ment of the superior, inferior, average and minimum
Table 1Demographic characteristics in the present study
Parameters Normal control Glaucoma group P-value
Age 54.22 ± 11.91 54.82 ± 10.06 0.766a
Sex (Male/Female) 33/26 30/31 0.471b
Central corneal thickness,μm 533.18 ± 41.15 525.12 ± 35.05 0.514a
Spherical equivalent - 0.92 ± 2.37 - 0.49 ± 2.18 0.313a
Axial length 23.93 ± 1.06 23.97 ± 1.15 0.856a
Average RNFL thickness,μm 103.90 ± 1.81 66.58 ± 3.21 < 0.001a
Humphrey 24–2 visual field
MD, dB - 0.42 ± 0.95 - 8.14 ± 5.01 < 0.001c
PSD, dB 1.56 ± 0.45 8.61 ± 4.11 < 0.001c
VFI, % 99.18 ± 1.09 78.98 ± 16.15 < 0.001c
RNFLRetinal nerve fiber layer,MDmean deviation,PSDpattern standard deviation,VFIvisual field index
a
Table 2Comparison of GCIPL thickness between normal an glaucoma using SS-OCT
Parameters (μm) Normal Glaucoma P-valuea In conventional 6 × 6 mm
Superonasal sector 72.76 ± 7.33 64.90 ± 10.09 < 0.001
Superior sector 67.79 ± 6.89 59.00 ± 9.31 < 0.001
Superotemporal sector 72.42 ± 4.91 62.67 ± 8.13 < 0.001
Inferonasal sector 69.88 ± 7.47 60.78 ± 9.53 < 0.001
Inferior sector 64.45 ± 5.84 54.32 ± 7.13 < 0.001
Inferotemporal sector 71.37 ± 5.20 58.98 ± 6.53 < 0.001
Average 69.78 ± 5.14 60.11 ± 7.07 < 0.001
Minimum 63.69 ± 6.10 51.90 ± 7.09 < 0.001
In Zone 1
Superonasal sector 84.18 ± 5.86 73.34 ± 13.49 < 0.001
Superotemporal sector 78.51 ± 5.25 68.03 ± 11.47 < 0.001
Inferonasal sector 79.20 ± 6.36 64.81 ± 11.04 < 0.001
Inferotemporal sector 80.36 ± 5.78 61.90 ± 9.83 < 0.001
Average 80.56 ± 5.23 67.02 ± 9.87 < 0.001
Minimum 76.61 ± 5.07 59.15 ± 9.70 < 0.001
In Zone 2
Superonasal sector 68.83 ± 5.02 60.89 ± 9.29 < 0.001
Superotemporal sector 70.56 ± 4.81 61.90 ± 8.01 < 0.001
Inferonasal sector 60.42 ± 5.26 52.12 ± 6.35 < 0.001
Inferotemporal sector 65.18 ± 5.21 55.31 ± 4.86 < 0.001
Average 66.25 ± 4.35 57.56 ± 5.96 < 0.001
Minimum 60.22 ± 5.11 51.23 ± 6.25 < 0.001
In Zone 3
Superonasal sector 59.58 ± 4.67 52.86 ± 7.04 < 0.001
Superoteomporal sector 62.98 ± 4.23 56.55 ± 6.28 < 0.001
Inferonasal sector 52.11 ± 4.56 46.29 ± 5.22 < 0.001
Inferotemporal sector 56.78 ± 4.51 51.48 ± 4.32 < 0.001
Average 57.86 ± 3.82 51.79 ± 4.66 < 0.001
Minimum 51.95 ± 4.40 45.66 ± 5.17 < 0.001
a
Student t-test
Table 3Univariate correlation of GCIPL thickness in between automated 6 × 6 mm and zone 2
Parameters Normal Glaucoma Total Superior sector 0.805* 0.886* 0.901*
Inferior sector 0.746* 0.879* 0.899*
Average 0.834* 0.953* 0.948*
Minimum 0.580* 0.791* 0.836*
*P< 0.001 by Pearson correlation analysis
Table 4Bland-Altman Analysis of GCIPL measurements with each parameter between automated 6 × 6 mm and zone 2
95% LoA in Normal 95% LoA in Glaucoma Lower Upper Width Lower Upper Width Superior sector - 7.8 5.2 13.0 −8.9 7.4 16.3
Inferior sector - 12.7 1.2 13.9 - 11.0 2.4 13.4
Average - 9.1 2.0 11.1 - 6.9 1.8 8.7
Minimum - 14.0 7.1 21.1 - 8.2 6.9 15.1
Table 5Area under the receiver operating characteristic curves of GCIPL parameters between normal and glaucoma
Parameters Mean (SD)
In conventional 6 × 6 mm
Superonasal sector 0.737 (0.047)
Superior sector 0.788 (0.043)
Superotemporal sector 0.850 (0.035)
Inferonasal sector 0.801 (0.041)
Inferior sector 0.870 (0.027)
Inferotemporal sector 0.920 (0.027)
Average 0.872 (0.033)
Minimum 0.908 (0.029)
In Zone 1
Superonasal sector 0.764 (0.044)
Superotemporal sector 0.778 (0.043)
Inferonasal sector 0.871 (0.032)
Inferotemporal sector 0.931 (0.024)
Average 0.894 (0.028)
Minimum 0.945 (0.019)
In Zone 2
Superonasal sector 0.770 (0.044)
Superotemporal sector 0.822 (0.039)
Inferonasal sector 0.839 (0.036)
Inferotemporal sector 0.918 (0.024)
Average 0.879 (0.031)
Minimum 0.865 (0.032)
In Zone 3
Superonasal sector 0.777 (0.042)
Superotemporal sector 0.817 (0.039)
Inferonasal sector 0.800 (0.041)
Inferotemporal sector 0.809 (0.040)
Average 0.840 (0.036)
Minimum 0.821 (0.039)
GCIPL thickness between zone 2 and the conventional 6 × 6 mm2area.
Table 5 shows the AUROCs for each sectorial, mini-mum, and average GCIPL parameter from the conven-tional area and zones 1, 2, and 3. Among the GCIPL parameters in the conventional area, the GCIPL thick-ness in the inferotemporal sector and the minimum GCIPL thickness showed the best diagnostic ability (AUROCs: 0.920 and 0.908, respectively), but these pa-rameters in the superonasal sector showed a poor diag-nostic ability (AUROC: 0.737). Among the parameters in zone 1, the GCIPL thickness in the inferotemporal sector and the minimum GCIPL thickness also showed the best diagnostic ability (AUROCs: 0.931 and 0.945, respectively), but in the superonasal sector, these pa-rameters showed a poor diagnostic ability (AUROC: 0.764). Among the parameters in zone 2, the GCIPL thickness in inferotemporal sector showed the best
diagnostic ability (AUROC: 0.918), but these parame-ters in the superionasal sector also showed poor diag-nostic ability (AUROC: 0.770). Among the parameters in zone 3, the average GCIPL thickness showed the best diagnostic ability (AUROC: 0.840), but the superonasal sectorial GCIPL thickness showed a poor diagnostic ability (AUROC: 0.777). In addition, the minimum GCIPL in zone 1 most accurately allowed discrimin-ation between patients with and without glaucoma.
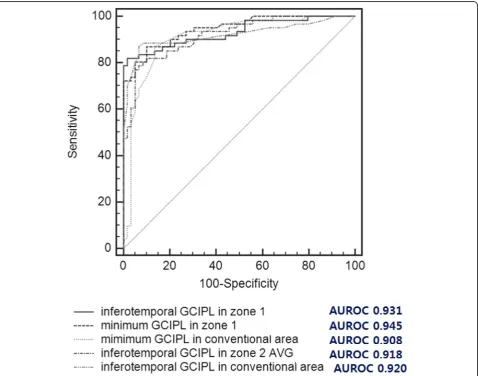
Figure 2 shows the ROC curves of the inferotem-poral and minimum GCIPL thicknesses in the con-ventional area, the inferotemporal and minimum GCIPL thicknesses in zone 1, and the inferotemporal GCIPL thickness in zone 2, whose areas were all greater than 0.9 (AUROCs: 0.920, 0.908, 0.931, 0.945, and 0.918, respectively). The diagnostic values of the inferotemporal GCIPL and the minimum GCIPL pa-rameters in zone 1 were compared to those of the
inferotemporal, average and minimum GCIPL thick-nesses in the conventional area and zone 2 in each eye with glaucoma. Notably, the AUROCs for both the inferotemporal and minimum GCIPL thicknesses in zone 1 were significantly greater than those of the average GCIPL thickness in zone 2 (P= 0.041 and P= 0.005), the average thickness of the conventional area (P= 0.045, P= 0.004), and the minimum thickness of the conventional area (P= 0.018 and P< 0.001) in eyes with glaucoma (Table 6).
Discussion
The GCIPL thickness parameters in the present study were not only significantly correlated with conventional ETDRS parameters, but also significantly differed be-tween patients with and without glaucoma. Importantly, the minimum GCIPL in zone 1 around the fovea showed the best diagnostic value for glaucoma among the vari-ous GCIPL parameters that were investigated in the present study.
Previous studies have demonstrated the topographic pattern of the retinal ganglion cell density [8–12]. In normal eyes, the thickness of the ganglion cell layer ori-ginating in the ganglion cell density sharply increases from the central fovea, with a peak height approximately 1 mm from the fovea; it then steadily decreases as the distance from the fovea increases. Kerrigan-Baumarind et al. obtained retinal ganglion cell density estimates at the same test points used in the Humphrey 30–2 test. This study found that the retinal ganglion cell density in a normal retina was nearly 10 times higher 6 degrees from the central fixation point than at more peripheral points [13]. Another retinal ganglion cell study that used multifocal visual evoked potentials found that reductions in the amplitude width appeared to be greater in the
parafoveal region than at more peripheral locations in eyes with glaucoma [14,15].
Given the results discussed above, we speculate that the diagnostic ability of the GCIPL parameter would increase as its measurements become closer to the fovea. Prior studies have found that the GCIPL thick-ness 7.2 degrees outside of the retina was not suffi-cient to diagnose glaucoma, as the retinal ganglion cell layer thickness decreases as one moves away from the macula [16–18]. The GCIPL located around the fovea might be more susceptible to damage from glaucoma, as shown by the GCIPL thickness findings reported here. Similarly, Raza et al. reported that the relationship between the VF defect region and GCIPL thickness is stronger within 7.2 degrees of the retina, which corresponds to approximately 6 degrees of the central VF [18]. In addition, quantitative analysis per-formed in a previous study showed that the correl-ation between the GCIPL thickness within 7.2 degrees of the retina and the corresponding regions of VF de-fects was higher than the correlation outside this re-gion. Furthermore, since the GCIPL parameters in zone 1 (based on a 4 × 4 mm2 area around fovea) might have a stronger relationship with VF defects than those within 6 degrees of the fovea, further study will be needed to evaluate the structure-function relationship.
The present study found that the GCIPL parameters in zone 1 could be reliably used for the diagnosis of glaucoma. In agreement with previous studies, the present study also revealed that the minimum GCIPL thickness was the most accurate parameter for diagnos-ing glaucoma [19–21]. Similarly, Jeong et al. proposed that glaucoma progression occurs focally, and the sus-ceptibility of retinal ganglion cells to glaucomatous dam-age differs across regions [19]. Thus, the average or sectorial GCIPL thickness might not be able to detect glaucomatous damage as sensitively as the minimal GCIPL thickness.
The inferotemporal GCIPL parameters in the
present study also showed high AUROCs for the de-tection of glaucoma. These results are in agreement with prior results, which suggested that the infero-temporal area of the macula is the most vulnerable papillomacular bundle area to glaucomatous damage [14, 17, 19, 22, 23]. Furthermore, Hood et al. specu-lated that the vulnerable area to damage in glaucoma is a part of the high-density axon region and that the probability of glaucomatous damage is proportional to the axon density, which is known as the crowding hy-pothesis [3, 17, 18]. Takayama et al. similarly pro-posed that the papillomacular bundle is typically spared until advanced glaucoma damage occurs, and that the retinal ganglion cells in the nasal macular Table 6Pairwise comparison of area under the receiver
operating characteristic of GCIPL thickness in glaucoma group conducted by DeLong et al.’s method
Difference between areas Inferotemporal sector of zone 1
Minimum of Zone 1
Inferotemporal sector of zone 2
0.011
(0.394) 0.024(0.261) Average of zone 2 0.058*
(0.041) 0.072 * (0.005) Minimum of zone 2 0.023
(0.443) 0.036(0.163) Inferotemporal
sector of conventional 6 × 6 mm
0.013
(0.434) 0.027(0.111)
Average of conventional 6 × 6 mm
0.051*
(0.045) 0.066 * (0.004) Minimum of conventional
6 × 6 mm
0.066*
area are less susceptible to glaucoma than those in the temporal side to the macula [14].
With decreasing GCIPL thickness, the GCIPL parame-ters in OCT become more sensitive to glaucoma-related changes and thus more diagnostically useful. The mini-mum GCIPL thickness in zone 1, based on a 4 × 4 mm2 area centered on the fovea, was the most accurate par-ameter for the detection of glaucoma among all of the GCIPL parameters assessed here across wider areas that were also centered on the fovea. Since nearly complete retinal images could be obtained through wide-scanning techniques in SS-OCT or SD-OCT, this technique is needed to investigate various parameters based on SS-OCT images.
There are some limitations in the present study. First, the sample size of the study was relatively mod-est. Second, in the wide-scan images, the fovea was not located in the same place in each participant, and the variability in identifying the grid around the fovea could lead to errors in the results. To minimize the variation of the fovea in the scan, we compared the parameters in the superior and inferior areas between each zone 2 and conventional ETDRS area. The data in the present study showed the reliable correlation and agreements between two areas. Third, the SS-OCT 12 × 9 mm2-wide scan protocol used here en-abled us to analyze the GCIPL thickness around the macula in only a square 1 × 1 mm2region, rather than in a circular 1 × 1 mm2 region. As such circular mea-surements are not possible with the present SS-OCT protocol, the present study based on square area ana-lysis was limited in its ability to evaluate the diagnos-tic value of the GCIPL thicknesses in a circular area around the macula. However, to minimize the bias as-sociated with using a square area for measuring the GCIPL thickness, we compared measurements from the conventional 6 × 6 mm2 area with those obtained using our newly developed approach, which analyzes a square 6 × 6 mm2 area. We found that the GCIPL thickness of the newly created area did not differ sig-nificantly from that found in the conventional 6 × 6 mm2 area. Fourth, the participants in the present study underwent only standard 24–2 VF examination, not 10–2 VF test as functional test. Since the 10–2 visual field test has been useful tool to detect central visual dysfunction, the further investigation will be needed to evaluate the relationship between the vari-ous GCIPL parameters according to the range around the fovea and the functional damage detected by the 10–2 VF test.
Conclusions
The present study suggests that the minimum GCIPL thickness in a narrower area has the better diagnostic
value for the discrimination between glaucoma and nor-mal eyes than the GCIPL parameters acquired from wider areas centered on the fovea. We expect that im-provements in SS-OCT image acquisition protocols will contribute to improvements in the detection of glau-comatous damage using SS-OCT.
Abbreviations
AUROCs:Areas under the receiver operating characteristic; BCVA: Best-corrected visual acuity; CCT: Central corneal thickness; ETDRS: Early Treatment Diabetic Retinopathy Study; GCIPL: Ganglion cell-inner plexiform layer; ICCs: Intraclass correlation coefficients; IOP: Intraocular pressure; IPL: Inner plexiform layer; IRB: Institutional Review Board; MD: Mean deviation; PSD: Pattern standard deviation; RNFL: Retinal nerve fiber layer; ROC: Receiver operating characteristic; SD-OCT: Spectral domain optical cohrerence tomography; SITA: Swedish interactive thresholding algorithm; SS-OCT: Swept-source optical cohrerence tomography; VF: Visual field
Acknowledgements
Not applicable.
Authors’contributions
JS, MSK, JHS and JHJ conceived, designed and coordinated the study, analysed and interpreted the data, drafted the manuscript and revised it critically for important intellectual content. JS and JHJ participated in the design of the study and in the statistical analysis. JS and JHS performed the statistical analysis. MSK participated in the acquisition of data, in the statistical analysis and in the drafting of the manuscript. All authors read and approved the final manuscript and agree to be accountable of all aspects of the work.
Funding
Not applicable.
Availability of data and materials
The datasets used and/or analysed during the current study are available from the corresponding author on reasonable request.
Ethics approval and consent to participate
This study was approved by the Institutional Review Board (Pusan Nation University Yangsan Hospital, Yangsan, South Korea), and written informed consent was obtained from all subjects. All testing was conducted in a manner compliant with the Health Insurance Portability and Accountability Act and adhered to the tenets of the Declaration of Helsinki.
Consent for publication
Not applicable. No personal information is included in this study.
Competing interests
The authors declare that they have no competing interests.
Received: 26 July 2019 Accepted: 23 December 2019
References
1. Weinreb RN, Khaw PT. Primary open-angle glaucoma. Lancet. 2004;363: 1711–20.
2. Resnikoff S, Pascolini D, Etya'ale D, Kocur I, Pararajasegaram R, Pokharel GP, et al. Global data on visual impairment in the year 2002. Bull World Health Organ. 2004;82:844–51.
3. Hood DC, Slobodnick A, Raza AS, de Moraes CG, Teng CC, Ritch R. Early glaucoma involves both deep local, and shallow widespread, retinal nerve fiber damage of the macular region. Invest Ophthalmol Vis Sci. 2014;55:632–49. 4. Hood DC, Anderson S, Rouleau J, Wenick AS, Grover LK, Behrens MM, et al.
Retinal nerve Fiber structure versus visual field function in patients with ischemic optic neuropathy. A test of a linear model. Ophthalmology. 2008;115:904–10. 5. Drance SM. The early field defects in glaucoma. Investig Ophthalmol. 1969;8:84–91. 6. Morooka S, Hangai M, Nukada M, Nakano N, Takayama K, Kimura Y, et al.
7. Yang Z, Tatham AJ, Weinreb RN, Medeiros FA, Liu T, Zangwill LM. Diagnostic ability of retinal nerve fiber layer imaging by swept-source optical coherence tomography in glaucoma. Am J Ophthalmol. 2015;159:193–201.
8. Ishikawa H, Stein DM, Wollstein G, Beaton S, Fujimoto JG, Schuman JS. Macular segmentation with optical coherence tomography. Invest Ophthalmol Vis Sci. 2005;46:2012–7.
9. Nakano N, Hangai M, Nakanishi H, Mori S, Nukada M, Kotera Y, et al. Macular ganglion cell layer imaging in preperimetric glaucoma with speckle noise-reduced spectral domain optical coherence tomography. Ophthalmology. 2011;118:2414–26.
10. Ooto S, Hangai M, Tomidokoro A, Saito H, Araie M, Otani T, et al. Effects of age, sex, and axial length on the three-dimensional profile of normal macular layer structures. Invest Ophthalmol Vis Sci. 2011;52:8769–79. 11. Curcio CA, Messinger JD, Sloan KR, Mitra A, McGwin G, Spaide RF. Human
chorioretinal layer thicknesses measured in macula-wide, high-resolution histologic sections. Invest Ophthalmol Vis Sci. 2011;52:3943–54. 12. Loduca AL, Zhang C, Zelkha R, Shahidi M. Thickness mapping of retinal
layers by spectral-domain optical coherence tomography. Am J Ophthalmol. 2010;150:849–55.
13. Kerrigan-Baumrind LA, Quigley HA, Pease ME, Kerrigan DF, Mitchell RS. Number of ganglion cells in glaucoma eyes compared with threshold visual field tests in the same persons. Investig Ophthalmol Vis Sci. 2000;41:741–8. 14. Takayama K, Hangai M, Durbin M, Nakano N, Morooka S, Akagi T, et al. A
novel method to detect local ganglion cell loss in early glaucoma using spectral-domain optical coherence tomography. Investig Ophthalmol Vis Sci. 2012;53:6904–13.
15. Hood DC, Greenstein VC. Multifocal VEP and ganglion cell damage: applications and limitations for the study of glaucoma. Prog Retin Eye Res. 2003;22:201–51. 16. Traynis I, De Moraes CG, Raza AS, Liebmann JM, Ritch R, Hood DC.
Prevalence and nature of early glaucomatous defects in the central 10° of the visual field. JAMA Ophthalmol. 2014;132:291–7.
17. Hood DC, Raza AS, de Moraes CG, Liebmann JM, Ritch R. Glaucomatous damage of the macula. Prog Retin Eye Res. 2013;32:1–21.
18. Raza AS, Cho J, de Moraes CG, Wang M, Zhang X, Kardon RH, et al. Retinal ganglion cell layer thickness and local visual field sensitivity in glaucoma. Arch Ophthalmol (Chicago, Ill. 1960). 2011;129:1529–36.
19. Jeoung JW, Choi YJ, Park KH, Kim DM. Macular ganglion cell imaging study: Glaucoma diagnostic accuracy of spectral-domain optical coherence tomography. Invest Ophthalmol Vis Sci. 2013;54:4422–9.
20. Mwanza JC, Durbin MK, Budenz DL, Sayyad FE, Chang RT, Neelakantan A, et al. Glaucoma diagnostic accuracy of ganglion cell-inner plexiform layer thickness: comparison with nerve fiber layer and optic nerve head. Ophthalmology. 2012;119:1151–8.
21. Garas A, Vargha P, Holló G. Diagnostic accuracy of nerve fibre layer, macular thickness and optic disc measurements made with the RTVue-100 optical coherence tomograph to detect glaucoma. Eye. 2011;25:57–65. 22. Nukada M, Hangai M, Mori S, Nakano N, Nakanishi H, Ohashi-Ikeda H.
Detection of localized retinal nerve fiber layer defects in glaucoma using enhanced spectral-domain optical coherence tomography. Ophthalmology. 2011;118:1038–48.
23. Kotera Y, Hangai M, Hirose F, Mori S, Yoshimura N. Three-dimensional imaging of macular inner structures in glaucoma by using spectral-domain optical coherence tomography. Invest Ophthalmol Vis Sci. 2011;52:1412–21.
Publisher’s Note