A vessel segmentation method
for multi‑modality angiographic images based
on multi‑scale filtering and statistical models
Pei Lu
1†, Jun Xia
2†, Zhicheng Li
1, Jing Xiong
1, Jian Yang
3, Shoujun Zhou
1*, Lei Wang
1, Mingyang Chen
1and Cheng Wang
1Abstract
Background: Accurate segmentation of blood vessels plays an important role in the
computer-aided diagnosis and interventional treatment of vascular diseases. The sta-tistical method is an important component of effective vessel segmentation; however, several limitations discourage the segmentation effect, i.e., dependence of the image modality, uneven contrast media, bias field, and overlapping intensity distribution of the object and background. In addition, the mixture models of the statistical methods are constructed relaying on the characteristics of the image histograms. Thus, it is a challenging issue for the traditional methods to be available in vessel segmentation from multi-modality angiographic images.
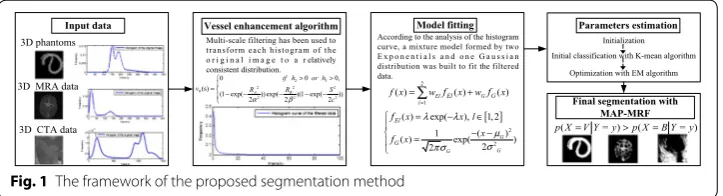
Methods: To overcome these limitations, a flexible segmentation method with a fixed
mixture model has been proposed for various angiography modalities. Our method mainly consists of three parts. Firstly, multi-scale filtering algorithm was used on the original images to enhance vessels and suppress noises. As a result, the filtered data achieved a new statistical characteristic. Secondly, a mixture model formed by three probabilistic distributions (two Exponential distributions and one Gaussian distribution) was built to fit the histogram curve of the filtered data, where the expectation maximi-zation (EM) algorithm was used for parameters estimation. Finally, three-dimensional (3D) Markov random field (MRF) were employed to improve the accuracy of pixel-wise classification and posterior probability estimation. To quantitatively evaluate the perfor-mance of the proposed method, two phantoms simulating blood vessels with different tubular structures and noises have been devised. Meanwhile, four clinical angiographic data sets from different human organs have been used to qualitatively validate the method. To further test the performance, comparison tests between the proposed method and the traditional ones have been conducted on two different brain mag-netic resonance angiography (MRA) data sets.
Results: The results of the phantoms were satisfying, e.g., the noise was greatly
sup-pressed, the percentages of the misclassified voxels, i.e., the segmentation error ratios, were no more than 0.3%, and the Dice similarity coefficients (DSCs) were above 94%. According to the opinions of clinical vascular specialists, the vessels in various data sets were extracted with high accuracy since complete vessel trees were extracted while lesser non-vessels and background were falsely classified as vessel. In the comparison experiments, the proposed method showed its superiority in accuracy and robustness
Open Access
© The Author(s) 2016. This article is distributed under the terms of the Creative Commons Attribution 4.0 International License (http://creativecommons.org/licenses/by/4.0/), which permits unrestricted use, distribution, and reproduction in any medium, provided you give appropriate credit to the original author(s) and the source, provide a link to the Creative Commons license, and indicate if changes were made. The Creative Commons Public Domain Dedication waiver ( http://creativecommons.org/publicdo-main/zero/1.0/) applies to the data made available in this article, unless otherwise stated.
RESEARCH
*Correspondence: [email protected]
†Pei Lu and Jun Xia
contributed equally to this work
1 Research Centre
for extracting vascular structures from multi-modality angiographic images with com-plicated background noises.
Conclusions: The experimental results demonstrated that our proposed method was
available for various angiographic data. The main reason was that the constructed mix-ture probability model could unitarily classify vessel object from the multi-scale filtered data of various angiography images. The advantages of the proposed method lie in the following aspects: firstly, it can extract the vessels with poor angiography quality, since the multi-scale filtering algorithm can improve the vessel intensity in the circumstance such as uneven contrast media and bias field; secondly, it performed well for extracting the vessels in multi-modality angiographic images despite various signal-noises; and thirdly, it was implemented with better accuracy, and robustness than the traditional methods. Generally, these traits declare that the proposed method would have signifi-cant clinical application.
Keywords: Multi-modality angiographic images, Vessel segmentation, Multi-scale
filtering, Statistical mixture model, Markov random field
Background
Nowadays, cardio- and cerebro-vascular diseases have greatly threatened human health. Since the use of imaging techniques such as computed tomography angiography (CTA) and magnetic resonance angiography (MRA) in minimally invasive surgery, high qual-ity image segmentation has become an important area of interest. A detailed review has been made on threshold based, pattern recognition based, and deformable models based segmentation algorithms which were used for medical images [1, 2]. The main tendency of these algorithms with their principle ideas, application field, advantages and disad-vantages were discussed. Conclusion has been drawn that each segmentation method with improvement, or in combination with other technique, could provide better perfor-mance [3, 4]. Clustering algorithms and supervised classification used for the segmenta-tion of atherosclerotic plaques were analysed in [5].
For the diagnosis and treatment of vascular diseases, it is critical to accurately extract and quantify the blood vessels from the angiographic image. Aimed at the extraction of blood vessels, different kinds of segmentation methods have been proposed, e.g.: multi-scale filtering [6–9], deformable models [10], statistical models [11–13], and hybrid meth-ods [14, 15]. Multi-scale filtering can enhance the intensity of the vessels while suppresses that of the background [16] in various angiographic data, however, further processing should be conducted in order to label the vessel class out. Deformable models well inte-grate bottom–up information and top–down priori knowledge, but the segmentation quality mainly depends on the model parameters [17, 18]. For statistical models, the ves-sels in the angiographic data with a given modality are segmented according to the inten-sity distributions of anatomical structures, by which voxels with overlapped intensities will inevitably be misclassified [19]. In order to reduce the probability of error classifica-tion, hybrid methods have been proposed to take the spatial contextual information into account [20], but limitations still exist for multi-modality angiographic images.
histogram into three regions, modelled by a mixture model of two Gaussian distribu-tions and one uniform distribution. Hassouna et al. [21] improved the mixture model with a Rayleigh distribution and three Gaussian distributions to provide an accurate fitting of the histogram curve. On the basis of statistical model analysis and improved curve evolution, a fast segmentation algorithm for extracting the 3D cerebral vessels was presented by Gao et al. [22]. To segment fine cerebral vessels with complicated contexts, a statistical method based on maximum a posteriori and Markov random field (MAP– MRF) with multi-pattern neighbourhood system (MP-NBS) was proposed by Zhou et al. [23], where the larger cerebrovascular network can be extracted out automatically. In general, statistical segmentation methods need to construct mixture probability distri-butions and adjust their parameters to fit a certain image histogram, where the vessels in a particular position are segmented according to the specific intensity distribution of a certain angiography image. To sum up, a given statistical model only deals with a spe-cific imaging modality on a given anatomical part, which is to say that the statistical seg-mentation method should change its models to fit a certain medical data. This issue has greatly restricted the application of statistical methods.
Being different from the above-mentioned statistical vessel segmentation method, in this paper, a flexible method for extracting vessels from various modalities of angio-graphic images was developed. Up to present, statistical modelling against the data of multi-scale filtering response was not been used to vessel segmentation from angio-graphic data. One reason lies in the complexity of constructing mixture model, and the other lies in the error being not easily controlled with parameters estimation. We have done this attempt, and our method includes the following several steps. In the first step, image data of different modalities were filtered by multi-scale vessel enhancement algorithm. The intensity of the vessels was enhanced, whereas the intensity of the back-ground voxels was suppressed, and the filtered data turned to a new distribution. Then, the filtered data was modelled by a new mixture model consisting of reduced distribu-tion classes. Based on the histogram curve analysis, a Gaussian distribudistribu-tion was used to model the high intensity which represents the vessels; while two Exponential distri-butions were used to model the low and middle intensity regions which represent the background voxels. The parameters of the mixture model were estimated by the EM algorithm. At last, the vessels were marked out by MAP–MRF algorithm.
The rest of this paper is organized as follows. In “Methods” section, the proposed method is described in detail, where the multi-scale filtering based vessel enhancement, histogram analysis, the mixture model constructing for histogram curve fitting, param-eters estimation, and the MAP–MRF segmentation algorithm are presented in succes-sion. “Experiments” section details the experiments that were conducted on a series of phantoms, the MRA data, and the CTA data, where results are also presented. Summa-ries and future work are discussed in “Results and discussions” section, and the conclu-sions are drawing in the last section.
Methods
distributions was built to fit the histogram curve of the filtered data. The parameters of the three distributions were automatically estimated through peak-points detecting of the histogram curve, K-means clustering algorithm, and EM algorithm. Finally, the blood vessels were segmented by the MAP–MRF algorithm.
Vessel enhancement algorithm
We use the algorithm of three dimensional multi-scale filtering algorithm [6] to strengthen the intensity of the vessels while weakening that of the background. Accord-ing to the eigenvalues of Hessian, the vessel function with multi-scale filterAccord-ing is expressed as:
where RA, RB and S are the three measures that can be respectively controlled by the
parameters α, β and c, so that the vessel function be sensitive to the vessel shapes. The relationships between these parameters and the eigenvalues are shown in the following:
Here, h1, h2, and h3 are the eigenvalues corresponding to the eigenvectors of three
orthonormal directions which are robust to the scaling factor. The resultant ratios
RA and RB would be sensitive to the shapes of the blood vessel structure (e.g., blob-,
plate-, and line-like structures), while the measure S would be used to suppress image noise.
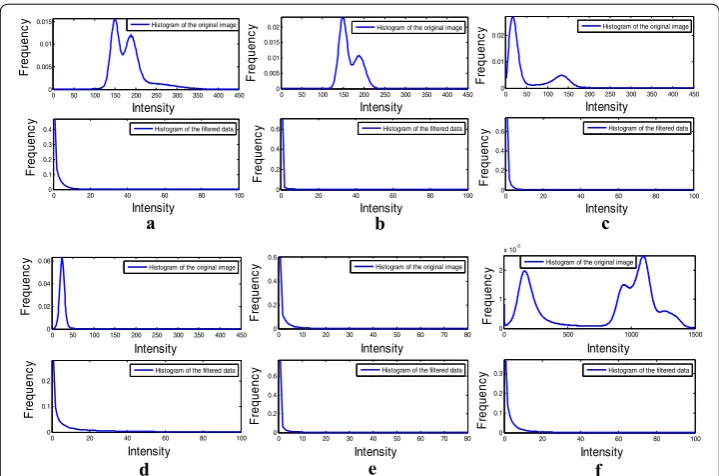
The above-mentioned enhancement algorithm was tested on several angiographic data sets. The histogram curves of the original data sets and those of the corresponding filtered data sets are compared in Fig. 2. Note that the low, middle, and high intensity regions of the filtered data gained from various modality original data exhibit similar distribution features.
After processed using multi-scale filtering, the vessels would be enhanced while the background tissues would be weakened, such that the resultant histogram curve of the filtered data would be fitted by reduced model elements.
(1)
v0(s)=
0 if h2>0 or h3>0,
�
1−exp�−R2A
2α2
�� exp � −R 2 B
2β2
� �
1−exp�−2Sc22
�� (2)
RA= |h
2| |h3|
RB= √|h1|
|h2h3|
S= �H�F =
� �
j≤Dh 2 j
Input data Vessel enhancement algorithm Model fitting Parameters estimation
Final segmentation with MAP-MRF 3D phantoms
3D MRA data
3D CTA data
2 2 2 2 0 2 3 2 2 0
(s) (1 exp( ))exp( )(1 exp( ))
2 2 0, 2 0 A B h or if
v R R S
c h α β = − − − − − > > 2 1
( ) El ( ) G ( )
l El G
f x wf x wf x
=
=∑ +
[ ]
2 2
( ) exp( ), 1,2 ( ) 1
( ) exp( ) 2 2 G GG El
G
x x l
x x f f λ λ µ σ πσ = − ∈ − − =
Multi-scale filtering has been used to transform each histogram of the o r i g i n a l i m a g e t o a r elatively consistent distribution.
According to the analysis of the histogram curve, a mixture model formed by two E x p o n e n t i a l s a n d o n e G a u s s i a n distribution was built to fit the filtered data.
Initialization Initial classification with K-mean algorithm
Optimization with EM algorithm
( ) ( )
p X V Y = y= >p X B Y = y=
Mixture model construction
Through the comparison of the histogram curves between the original and the filtered data in Fig. 2, it can be seen obviously that the vessels occupy the high intensities region with a range of gradual change, thus a Gaussian distribution could be used to model the vessel class. For the background class, the Exponential distributions showed the best fitting performance after several probability distribution functions were tested. There-fore, two Exponential distributions were used to model the low and middle intensity regions of background voxels. As a result, the mixture model for the filtered data can be described as a linear combination of the three probability distribution functions:
where the mixture model f(x) is composed of Exponential distributions fE1(x) and fE2(x)
as well as Gaussian distribution fG(x). The parameters wE1, wE2, and wG are the
propor-tion coefficients whose sum is unity. The three distribupropor-tions can be defined as follows:
where parameters λ, μ, σ, and the proportion coefficients wEl, wG should be firstly
esti-mated before the classification procedure. To begin with, the intensity range of the fil-tered data was enlarged to be consistent with the original image data. Then, the filfil-tered
(3)
f(x)=
2
l=1
wElfEl(x)+wGfG(x)
(4)
fEl(x)=exp(−x),l∈[1, 2]
(5)
fG(x)=
1 √
2π σG exp
−(x−µG)2
2σG2
0 500 1000 1500
0 1 2
x 10-3
Intensity
Fr
eq
ue
nc
y Histogram of the original image
0 20 40 60 80 100 0 0.1 0.2 0.3 Intensity Fr eq ue nc
y Histogram of the filtered data 0 10 20 30 40 50 60 70 80
0 0.2 0.4 0.6 Intensity Fr eque nc
y Histogram of the original image
0 10 20 30 40 50 60 70 80 0 0.2 0.4 0.6 Intensity Fr equ en
cy Histogram of the filtered data 0 50 100 150 200 250 300 350 400 450
0 0.02 0.04 0.06 Intensity Fr eque nc y
Histogram of the original image
0 20 40 60 80 100 0 0.1 0.2 Intensity Fr eque nc
y Histogram of the filtered data
0 50 100 150 200 250 300 350 400 450 0 0.01 0.02 Intensity Fr equenc
y Histogram of the original image
0 20 40 60 80 100 0 0.2 0.4 0.6 Intensity Fr eque nc
y Histogram of the filtered data 0 50 100 150 200 250 300 350 400 450
0 0.005 0.01 0.015 Intensity Fr eq ue nc
y Histogram of the original image
0 20 40 60 80 100 0 0.1 0.2 0.3 0.4 Intensity Fr eq ue nc y
Histogram of the filtered data
0 50 100 150 200 250 300 350 400 450 0 0.005 0.01 0.015 0.02 Intensity Fr equ en
cy Histogram of the original image
0 20 40 60 80 100 0 0.2 0.4 0.6 Intensity Fr equ enc
y Histogram of the filtered data
a b c
d e f
Fig. 2 The histogram curves of both the original data and the filtered data from a to b phantoms c–e MRA,
data was classified into three parts using the K-means algorithm. For the initialization of the K-means algorithm, the histogram curve of the original image was smoothed, and the peak points were automatically found out through local extremum method. If there were more than three peak points in the original histogram curve, the K-means algo-rithm would be initialized by the first three peak values. Otherwise, it would be initial-ized according to the following rule:
where Imax and Imin are the maximum and the minimum intensity values of the filtered
data. The variables µinitk_1, µinitk_2, and µkinit_3 are the initial cluster centroids while μk_l, σk_l, wk_l, (l = 1, 2, 3) represent the distribution parameters which were all estimated by the
K-means algorithm.
As the accuracy of theses parameters plays an important role in the final classification, the EM algorithm was used to improve the estimation performances of these param-eters. The results of the K-means algorithm were used as the initial values for the EM algorithm, as shown in Eq. (7):
Then, the parameters were iteratively updated with the EM algorithm as follows:
where N is the total number of the voxels in the filtered data and xj is the
correspond-ing intensity of voxel j. The posterior probability f k(El|x
j) and f k(G|xj) are gained by the
Bayes formula that are explained in Eq. (10)
MAP–MRF based classification
A series of filtered data was modelled by the proposed mixture model, and the com-bination of two Exponential distributions and one Gaussian distribution shows a good
(6)
µinitk_1=Imax
µinitk_2=(Imax+Imin)/2
µinitk_3=Imin
(7)
initE1 =1.0/µk_1,wEinit1 =wk_1
initE2 =1.0/µk_2,wEinit2 =wk_2
µinitG =µk_3,σ
init
G =σk_3,w
init G =wk_3
(8)
k+1
El =
�N
j=1fk(El|xj)
�N
j=1fk(El|xj)xj
wkEl+1= N1
�N
j=1fk(El|xj)
,l∈[1, 2]
(9)
µkG+1=
�N
j=1fk(G|xj)xj �N
j=1fk(G|xj)
,wk+1
G =
1 N
�N
j=1fk(G|xj)
(σGk+1)2=
�N
j=1fk(G|xj)(xj−µ k+1
G )
2
�N j=1fk(G|xj)
(10)
fk(El|xj)= w
k Elf
k(x j|El)
�2
l=1wk
Elf k(x
j|El)+wk Gf
k(x j|G)
fk(G|xj)=
wk Gf
k(x j|G)
�2
l=1wk
Elf k(x
j|El)+wk
Gf k(x
fitting to the histogram curves of the filtered data from the multi-modality angiographic images. According to the MAP algorithm, a voxel belongs to the vessel class only if it meets the following criteria:
Equation (11) gives the simplest case of binary vessel labelling, in which the voxels of the filtered data are labelled as either blood vessels or background according to their posteriori probability. However, misclassification still exists when significant vascu-lar signal losses or the noise has high intensity value because MAP classification only depends on the voxel intensity. Therefore, MRF algorithm is introduced for enhanced segmentation.
Spatial interaction between neighbouring voxels is modelled by MRF. Assume that X is an MRF, observed vector Y is conditionally independent, then MAP–MRF based expres-sions can be written as
where p(X|Y), being the low level MRF process, is modelled as a mixture model talked above; the term p(X), being the high level MRF process, is given by the Gibbs distribu-tion [24] as follows
where U(x) is the energy function, Ω denotes the space of all possible labelling, and Z is a normalizing constant to be the sum of the numerator over all possible configurations of x. With the isotropic multi-level logistic (MLL) model [25], U(x) can be expressed as
where η denotes the neighbourhood cube with the size of 3×3×3, V(xs,xr) is the energy of pair-points in this MP-NBS [23], and the energy function U(xs) is proportional
to the summation of the weighted V(xs,xr) with respect to βsr. The instances of V(xs,xr) used are given below.
The regularization parameter βsr is meant for the strength of the interaction between
pair-wise neighbouring voxels.
Overall, according to the MAP–MRF approach, the posterior probability of the vessel class can be expressed by
Meanwhile, the posterior probability of the background class is given by
(11)
wGfG(xj) >wE1fE1(xj)+wE2fE2(xj)
(12)
p(X|Y)∝p(Y|X)p(X)
(13) p(X=x)= exp(−U(x))
Z , Z =
x∈Ω
exp(−U(x))
(14)
U(xs)=
r∈η
βsrV(xs,xr) ∀r∈η
(15)
V(xs,xr)=
1, if xs=xr
0, elsewhere
(16)
p(X=V|Y =y)∝fG(y)exp(−U(V))
(17)
p(X=B|Y =y)∝ wE1fE1(y)+wE2fE2(y)
wE1+wE2
Finally, the MAP–MRF model is solved by iteratively using the iterated conditional modes (ICM) [26], and a voxel belongs to the vessel class only if it meets the following rule:
Experiments
The experiment results of the proposed segmentation method are presented in this sec-tion. In order to quantitatively and qualitatively validate the proposed method, tests were conducted on phantoms and various modality angiographic images from MRA, and CTA data. Additionally, comparisons with the traditional methods have also been discussed at the end of this section.
Experiment of quantitative validation
Since it was not easy to acquire the golden standard of vessels in real clinical data, phan-toms with known ground truth and complicated background noises were designed to quantitatively validate the proposed method. The percentage of the number of misclassi-fied voxels to that of the total voxels of the phantom was calculated as the segmentation error ratio. As a popular metric for evaluating the accuracy of automated or semi-auto-mated segmentation methods, the Dice similarity coefficients (DSCs) was used to esti-mate the segmentation performance on the phantom data by comparing their results to the ground truth.
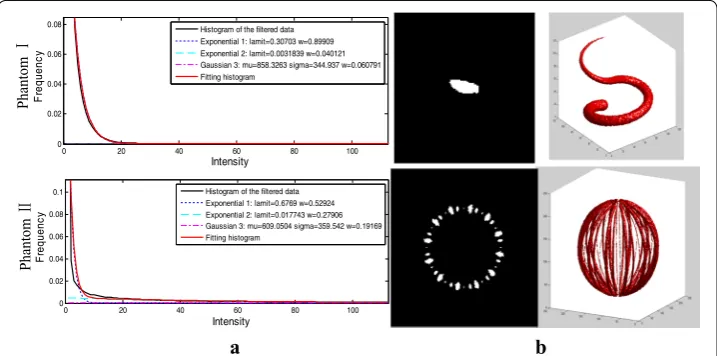
Two 3D phantoms were built to simulate the real clinical vessels data, which were shown in Fig. 3.
The simulation processes of mixture distributions for target and background were referred to our approach by Zhou et al. [23]. The main characteristics lied in follows: (1) Considering that the components of the background voxels in the angiographic images are often Gauss signals, different levels of Gaussian noises w.r.t. (µ,σ2,ω) were added (18)
p(X=V|Y =y) >p(X=B|Y =y)
into the two phantoms. (2) The proportion of the ground truth is not limited in our method, i.e., the proportions of the target and the background could be randomly set by adjusting the size of their volumes. (3) The vessels occupy the high intensities region, thus, in the setting of parameters (µ,σ2,ω), the value μ of the vessel target should be
greater than that of each Gauss noise.
Among the two phantoms one was a single curving tubular target, and the other con-sists of a series of tubular targets, where the intensity values of the two vessel objects were generated with stochastic ones of 810 and 650 respectively. The diameter of each tubular target smoothly changed, like that of a real vessel structure. Three Gauss-ian noises with the parameters (µ,σ2,ω) designed as (148, 102, 0.4), (187, 152, 0.4), and (228, 602, 0.24) were added into the first phantom while two Gaussian noises with the parameters (148, 102, 0.5), and (187, 152, 0.3) were added into the second phantom. The
data volumes in the two phantoms were 128 × 128 × 128 and 240 × 240 × 240
vox-els respectively. The 3D view of the ground truth and some slices of the phantoms were shown in Fig. 3.
In the first step, the phantoms were pre-processed with the multi-scale filtering algo-rithm. After that, the vessels were marked out using the proposed segmentation method. For the filtered data of the phantoms, the estimated two Exponential distributions and one Gaussian distribution curves were presented in Fig. 4a together with their fitting curves. Slices of the segmentation results and their 3D views were plotted in Fig. 4b. Meanwhile, the segmentation error ratios and the DSCs of the two phantoms were listed in Table 1, where Ntotal represents the total voxel number of the phantom, Nover, and
Nunder are the number of voxels in over segmentation and under segmentation
respec-tively. Thus, the sum of Nover and Nunder is the number of voxels in misclassification. Sg
is the set of pixels assigned to the targets in the ground truth, Sm is the set of pixels
assigned to the targets in the segmentation result, and N(·) represents the number of pixels in the corresponding region. The DSC provided a measure of how accurate a method was, with its value closer to 1 indicating greater accuracy.
0 20 40 60 80 100
0 0.02 0.04 0.06 0.08 0.1
Intensity
Fr
equenc
y
Histogram of the filtered data Exponential 1: lamit=0.6769 w=0.52924 Exponential 2: lamit=0.017743 w=0.27906 Gaussian 3: mu=609.0504 sigma=359.542 w=0.19169 Fitting histogram
0 20 40 60 80 100
0 0.02 0.04 0.06 0.08
Intensity
Fr
equen
cy
Histogram of the filtered data Exponential 1: lamit=0.30703 w=0.89909 Exponential 2: lamit=0.0031839 w=0.040121 Gaussian 3: mu=858.3263 sigma=344.937 w=0.060791 Fitting histogram
Phantom
Phantom
a b
Fig. 4 Experiments on phantoms. a The estimated two Exponential distributions and one Gaussian
Experiment of clinical validation
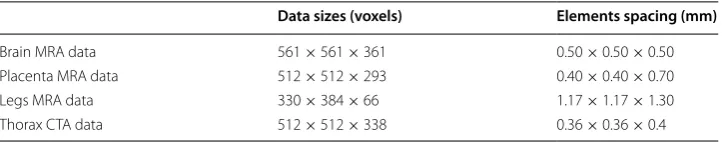
This section detailed the qualitative validation that was conducted on four clinical data, each of which held a different statistical characteristic. Among the four clinical data, the brain MRA data set was offered by Guangzhou General Hospital of the Chinese People’s Liberation Army (PLA). The placenta MRA, legs MRA, and the thorax CTA data sets were gained from Shenzhen No.2 People’s Hospital. These clinical data sets were shown in Fig. 5, and the sizes and elements spacing of these data were listed in Table 2.
The images of different organs from various imaging equipment exhibited different statistical characteristics. After using the vessel enhancement algorithm, the histograms of the filtered data of these clinical data obtained a new relatively consistent distribution. For the filtered data, the vessel class was modelled by a Gaussian distribution, and the background class was modelled by two Exponential distributions. The results of distri-bution curves fitting are shown in Fig. 6.
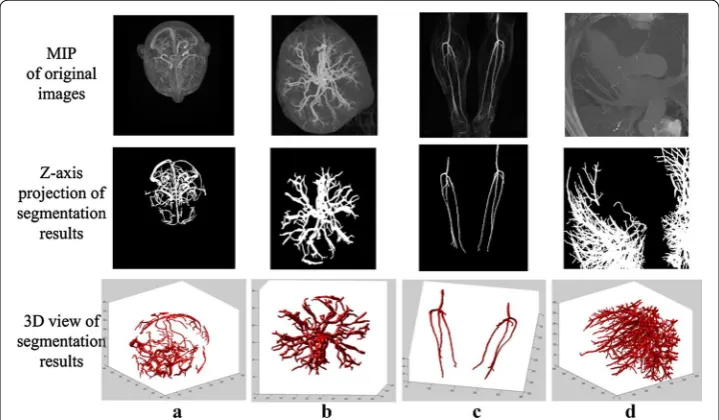
For clinical validation with respect to the real angiographic data, the Z-axis projections as well as the 3D views of the segmentation results were compared to the corresponding Table 1 Fitting error ratios and the DSCs for the phantoms
Phantoms I Phantoms II
Fitting error
Nover+Nunder
Ntotal
(%) 0.21 0.11
DSC
2N(Sg∩Sm)
N(Sg)∪N(Sm)
(%) 94.74 96.94
Fig. 5 The clinical data sets. a Brain MRA data. b Placenta MRA data. c Legs MRA data. d Thorax CTA data
Table 2 Data sizes and elements spacing of the clinical data
Data sizes (voxels) Elements spacing (mm)
Brain MRA data 561 × 561 × 361 0.50 × 0.50 × 0.50
Placenta MRA data 512 × 512 × 293 0.40 × 0.40 × 0.70
Legs MRA data 330 × 384 × 66 1.17 × 1.17 × 1.30
maximal intensity projection (MIP) of the original images, as suggested by clinical experts on cardio- and cerebro-vascular diseases. Parts of the results are given in Fig. 7.
Experiment of comparison tests
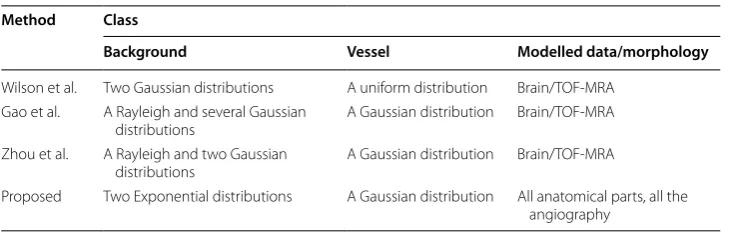
As an amendment to above-mentioned quantitative and clinical validation experiments, comparison tests were conducted against the traditional methods. Since our study was mainly based on statistical models, three popular model-based segmentation methods were chose for the tests. The three algorithms were methods of Wilson et al. [20], Gao et al. [22], and Zhou et al. [23]. The mixture models used in the proposed method and
0 20 40 60 80 100
0 0.02 0.04 0.06 0.08 0.1
Intensity
Fr
eq
ue
nc
y
Histogram of the filtered data Exponential 1: lamit=0.41687 w=0.83916 Exponential 2: lamit=0.04881 w=0.15572 Gaussian 3: mu=178.1847 sigma=112.0755 w=0.0051162 Fitting histogram
0 20 40 60 80 100
0 0.01 0.02 0.03 0.04
Intensity
Fr
eq
ue
nc
y
Histogram of the filtered data Exponential 1: lamit=0.22852 w=0.55744 Exponential 2: lamit=0.021384 w=0.39779 Gaussian 3: mu=698.7146 sigma=516.3426 w=0.044773 Fitting histogram
0 10 20 30 40 50 60
0 0.05 0.1 0.15
Intensity
Fr
eq
ue
nc
y
Histogram of the filtered data
Exponential curl-line 1: lamit=0.74135 w=0.89832 Exponential curl-line 2: lamit=0.04793 w=0.092314 Gaussian curl-line 3: mu=99.004 sigma=42.0793 w=0.00937 Fitting histogram
0 20 40 60 80 100
0 0.01 0.02 0.03 0.04 0.05 0.06
Intensity
Fr
eque
nc
y
Histogram of the filtered data Exponential 1: lamit=0.27064 w=0.79998 Exponential 2: lamit=0.023425 w=0.17918 Gaussian 3: mu=382.4061 sigma=226.7121 w=0.020837 Fitting histogram
a b
c d
Fig. 6 The mixture model fitting results from the angiographic image data of the anatomical parts of the
a brain, b placenta, c legs, and d thorax
Fig. 7 The MIP of the original images compared to the Z-axis projections and 3D views of the segmentation
the three traditional ones were different from each other, as shown in Table 3. Besides, the proposed mixture model was used to fit the filtered data, and the mixture models of the other three were used to fit the original data. To get the best segmentation results from each of the traditional methods, brain MRA data was used for the tests according to their application ranges. During the validation, the three traditional methods were implemented using models specified in the original papers and parameters as best as possible.
The online brain MRA data-sets (http://www.insight-journal.org/midas/community/ view/21) have previously been used by many researchers to test their vessel segmenta-tion methods. They were acquired at the element spacing of 0.5 × 0.5 × 0.8 mm3 with
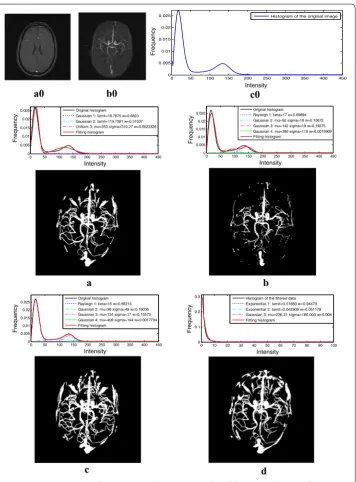
the data volumes of 448 × 448 × 128 voxels. Comparison tests were conducted on the ten data-sets, and the experimental results of a single MRA data from the four segmen-tation methods are displayed in Fig. 8.
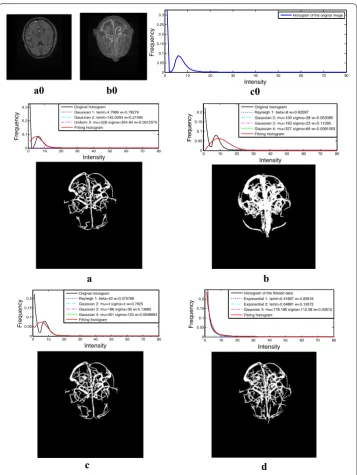
To further verify the effectiveness of the proposed method, comparison tests were also conducted on some data sets offered by the aforementioned Guangzhou General Hospital of the Chinese PLA. The image acquisition parameters of these data together with those of the online brain MRA data sets were listed in Table 4. Because of uneven contrast media and bias field, these MRA data sets exhibited a poor image quality. One brain MRA data set and its histogram curve are shown in Fig. 9, from which we can see this kind of data hold a different statistical property.
Results and discussions
In this paper, multi-scale filtering algorithm was firstly used for vessel enhancement and noise suppression before the statistical based classification, where filter parameters settings of α, β, c were same for all the data-sets. Suggested by Frangi’s method [6], a compromise value of α and β equal to 0.5 would make multi-scale filtering algorithm to differentiate tubular-like structures from plate-, and blob-like ones; while the parameter
c depended on the grey-scale range of the image and was set as half the value of the max-imum Hessian norm. The filtered data from multi-modality angiographic images turns to a relatively consistent statistical distribution after the vessel enhancement algorithm. The following statistical model used two Exponential distributions and one Gaussian distribution to fitting the relatively consistent statistical distribution, which classified the vessels through adjusting model components to fit a certain histogram curve of the filtered data. To sum up, as a flexible segmentation method, it performs well in vessel
Table 3 Mixture models used in the four methods Method Class
Background Vessel Modelled data/morphology
Wilson et al. Two Gaussian distributions A uniform distribution Brain/TOF-MRA
Gao et al. A Rayleigh and several Gaussian
distributions A Gaussian distribution Brain/TOF-MRA
Zhou et al. A Rayleigh and two Gaussian
distributions A Gaussian distribution Brain/TOF-MRA
Proposed Two Exponential distributions A Gaussian distribution All anatomical parts, all the
0 50 100 150 200 250 300 350 400 450 0
0.005 0.01 0.015 0.02 0.025
Intensity
Frequency
Histogram of the original image
0 50 100 150 200 250 300 350 400 450 0
0.005 0.01 0.015 0.02 0.025
Intensity
Frequency
Original histogram Rayleigh 1: beta=17 w=0.69894 Gaussian 2: mu=92 sigma=18 w=0.10672 Gaussian 3: mu=142 sigma=19 w=0.19275 Gaussian 4: mu=380 sigma=119 w=0.0015969 Fitting histogram
0 50 100 150 200 250 300 350 400 450 0
0.005 0.01 0.015 0.02 0.025
Intensity
Frequency
Original histogram Gaussian 1: lamit=18.7675 w=0.6823 Gaussian 2: lamit=119.7381 w=0.31537 Uniform 3: mu=553 sigma=319.27 w=0.0023326 Fitting histogram
0 50 100 150 200 250 300 350 400 450 0
0.005 0.01 0.015 0.02 0.025
Intensity
Frequency
Original histogram Rayleigh 1: beta=15 w=0.66213 Gaussian 2: mu=96 sigma=49 w=0.18036 Gaussian 3: mu=134 sigma=17 w=0.15573 Gaussian 4: mu=406 sigma=144 w=0.0017794 Fitting histogram
0 10 20 30 40 50 60 70 80 90 100 0
0.1 0.2 0.3
Intensity
Frequency
Histogram of the filtered data Exponential 1: lamit=0.51683 w=0.94479 Exponential 2: lamit=0.042909 w=0.051178 Gaussian 3: mu=236.21 sigma=160.003 w=0.004 Fitting histogram
a0
a b
c d
b0 c0
Fig. 8 Segmentation results of one online MRA data set. a0 One slice of the MRA data. b0 MIP of the MRA
data. c0 Histogram curve of the MRA data. a Method of Wilson et al. b Method of Gao et al. c Method of Zhou
et al. d The proposed method
Table 4 Data sizes and elements spacing of the images in experiment 3
Data sizes (voxels) Elements spacing (mm)
The online brain MRA data 448 × 448 × 128 0.50 × 0.50 × 0.80
enhance and histogram fitting for the filtered data and is robust to various angiographic images from different human organs and different imaging equipment.
For phantom validation, the method performed well for images despite various signal noises. The tubular object was enhanced while background noise was suppressed effec-tively. The accuracy of the proposed method was tested by several 3D phantoms. The phantoms were built to simulate the real angiographic images where different noises were added to simulate the background voxels. Compared to the known ground truth,
0 10 20 30 40 50 60 70 80
0 0.05 0.1 0.15 0.2 0.25 0.3
Intensity
Frequency
Histogram of the original image
0 10 20 30 40 50 60 70 80 0
0.1 0.2 0.3
Intensity
Frequency
Original histogram Gaussian 1: lamit=4.7989 w=0.78279 Gaussian 2: lamit=142.0284 w=0.21595 Uniform 3: mu=528 sigma=304.84 w=0.0012575 Fitting histogram
0 10 20 30 40 50 60 70 80 0
0.05 0.1 0.15 0.2
Intensity
Fr
equen
cy
Original histogram Rayleigh 1: beta=8 w=0.82597 Gaussian 2: mu=100 sigma=28 w=0.053085 Gaussian 3: mu=193 sigma=23 w=0.11285 Gaussian 4: mu=327 sigma=69 w=0.0081003 Fitting histogram
0 10 20 30 40 50 60 70 80 0
0.05 0.1 0.15 0.2
Intensity
Frequency
Original histogram Rayleigh 1: beta=43 w=0.075786 Gaussian 2: mu=4 sigma=4 w=0.7825
Gaussian 3: mu=186 sigma=36 w=0.13685 Gaussian 4: mu=451 sigma=123 w=0.0048664 Fitting histogram
0 10 20 30 40 50 60 70 80 0
0.05 0.1 0.15 0.2
Intensity
Frequency
Histogram of the filtered data Exponential 1: lamit=0.41687 w=0.83916 Exponential 2: lamit=0.04881 w=0.15572 Gaussian 3: mu=178.185 sigma=112.08 w=0.00512 Fitting histogram
a0
a b
c d
b0 c0
Fig. 9 Segmentation results of a single MRA data set from the hospital. a0 One slice of the MRA data. b0 MIP
of the MRA data. c0 Histogram curve of the MRA image. a Method of Wilson et al. b Method of Gao et al.
the mixture model efficiently fitted the histogram curves of both phantoms with the seg-mentation error ratios being 0.21 and 0.11%, and the DSCs being 94.74 and 96.94%. See Table 1, which strongly confirmed the segmentation quality.
For clinical validation, the proposed method was tested on multi-modality angio-graphic images from different human organs. The mixture model in our method fitted well in each histogram curve of the filtered data. Comparing with the MIP from the orig-inal images and the segmentation results, the complete vessel trees were extracted while lesser non-vessels and background were falsely classified as vessel. The results were sat-isfactory according to the suggestion of clinical experts. Parts of the results are given in Fig. 7.
In comparison tests, the results from traditional statistical based methods and the proposed method were presented. Experimental results of a single MRA data from the four segmentation methods are displayed in Fig. 8. The mixture model built by Zhou et al. obtained the best fitting performance among the three traditional methods accord-ing to the histogram fittaccord-ing performance and the Z-axis projection of these segmenta-tion results. In their method, a Gaussian distribusegmenta-tion was used to model the vessel class, while a Rayleigh distribution and two Gaussian distributions were used to model the background class. At the same time, the mixture model built in this paper fitted well for the histogram of the filtered data, and more small vessels were marked out which can been seen from the Z-axis projection of its segmentation result. From Figs. 8 and 9 we can see the mixture model built in Zhou’s method exhibited a good performance in histogram fitting for the online MRA data, but not for the second MRA data which con-tains a different statistical characteristic. In contrast, the mixture model generated from our method fitted well for both filtered data whose histograms had a relatively consistent statistical property. As a result, the proposed method demonstrated stronger robustness.
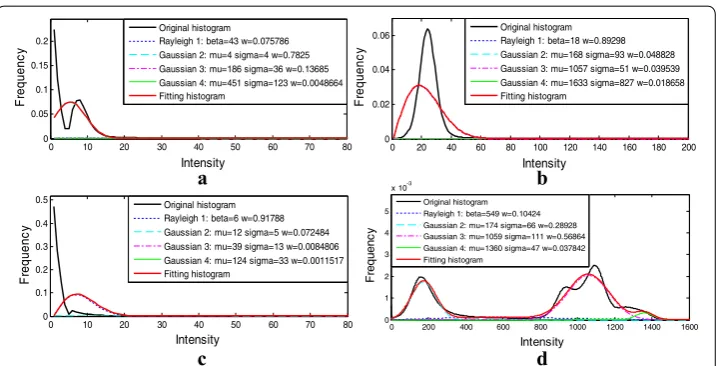
For fitting the histogram curves of the original images, and the mixture models devel-oped by Zhou et al. exhibited the best fitting performance comparing with the traditional models. However, different angiographic images correspond to different histogram curves. The four clinical data sets from different organs that were described in the part of clinical validation experiment were segmented by Zhou et al.’s method, and the model fitting results are shown in Fig. 10. As a result, the traditional method is not available to classify vessels from angiographic images which hold a different statistical characteristic. In other words, the traditional methods are limited in multi-modality application.
scientific researches. With the aim of contributing to the field of interventional surgery, our future works are primarily focused on vascular path planning and 3D augmented reality.
Conclusions
In this paper, a flexible segmentation method has been proposed for vessel extraction. In the first step, the original image data was filtered with multi-scale filtering algorithm. The filtered data obtained a relatively consistent statistical property, and was modelled with a mixture model which consisted of two Exponential distributions and one Gauss-ian distribution. The EM algorithm was used for parameter estimation, while the MAP– MRF algorithm was used in the Bayesian classification. The proposed method has been tested on phantoms as well as the various modality angiographic images from MRA and CTA data from different imaging equipment. Each histogram of the filtered data from these multi-modality angiographic images could be modelled by relatively consistent mixture probability distributions, and the mixture model displayed a good fitting perfor-mance. The segmentation error ratios of the phantoms were less than 0.3% and the DSCs were above 94%. The results of the vessel segmentation procedures have indicated that the method in this paper was accurate and robust for vessel segmentation from multi-modality angiographic images.
Abbreviations
EM: expectation maximization; 3D: three-dimensional; MAP–MRF: maximum a posteriori and Markov random field; MAP: maximum a posteriori; MRF: Markov random field; CTA: computed tomography angiography; MRA: magnetic resonance angiography; MLL: multi-level logistic; MP-NBS: multi-pattern neighbourhood system; ICM: iterated conditional modes; PLA: People’s Liberation Army; MIP: maximal intensity projection.
Authors’ contributions
PL and SZ determined the research subject, and completed the design of the algorithm. JX is responsible for the acquisi-tion and analysis of the human data. PL, SZ, MC and CW implemented the algorithm, and performed the experiments. ZL, JX, JY and LW provided important suggestions for the paper, and were responsible for the data analysis. All authors read and approved the final manuscript.
0 10 20 30 40 50 60 70 80 0
0.05 0.1 0.15 0.2
Intensity
Fr
equenc
y
Original histogram Rayleigh 1: beta=43 w=0.075786 Gaussian 2: mu=4 sigma=4 w=0.7825 Gaussian 3: mu=186 sigma=36 w=0.13685 Gaussian 4: mu=451 sigma=123 w=0.0048664 Fitting histogram
0 20 40 60 80 100 120 140 160 180 200 0
0.02 0.04 0.06
Intensity
Fr
equenc
y
Original histogram Rayleigh 1: beta=18 w=0.89298 Gaussian 2: mu=168 sigma=93 w=0.048828 Gaussian 3: mu=1057 sigma=51 w=0.039539 Gaussian 4: mu=1633 sigma=827 w=0.018658 Fitting histogram
0 10 20 30 40 50 60 70 80 0
0.1 0.2 0.3 0.4 0.5
Intensity
Fr
eq
ue
nc
y
Original histogram Rayleigh 1: beta=6 w=0.91788 Gaussian 2: mu=12 sigma=5 w=0.072484 Gaussian 3: mu=39 sigma=13 w=0.0084806 Gaussian 4: mu=124 sigma=33 w=0.0011517 Fitting histogram
0 200 400 600 800 1000 1200 1400 1600 0
1 2 3 4 5
x 10-3
Intensity
Fr
eq
ue
nc
y
Original histogram Rayleigh 1: beta=549 w=0.10424 Gaussian 2: mu=174 sigma=66 w=0.28928 Gaussian 3: mu=1059 sigma=111 w=0.56864 Gaussian 4: mu=1360 sigma=47 w=0.037842 Fitting histogram
a b
c d
Fig. 10 The model fitting results of the clinical data described in experiment 2 by the method of Zhou et al.
Author details
1 Research Centre for Medical Robotics and Minimally Invasive Surgical Devices, Institute of Biomedical and Health
Engineering, Shenzhen Institutes of Advanced Technology, Chinese Academy of Sciences, Shenzhen 518055, China.
2 Radiology Department, Shenzhen Second People’s Hospital, The First Affiliated Hospital of Shenzhen University,
Shenzhen 518035, China. 3 Beijing Engineering Research Centre of Mixed Reality and Advanced Display, School of Optics
and Electronics, Beijing Institute of Technology, Beijing 100081, China. Acknowledgements
The study has been financially supported by the following grants: National High Technology Research and Develop-ment Program of China (863 Program) (Grant No. 2015AA043203), National Natural Science Foundation of China (Grant No. 61471349), Basic Discipline Layout Project of Shenzhen City (Grant No. JCYJ20150731154850923), and Technology innovation program of Shenzhen City (Grant No. JSGG20160229203812944).
Competing interests
The authors declare that they have no competing interests.
Availability of data and supporting materials
The datasets generated during and/or analysed during the current study are available from the corresponding author on reasonable request.
Ethics approval and consent to participate
The human data used in this research has been approved by the ethics committee of Shenzhen No.2 People’s Hospital, and the committee’s reference number is 20160701. We have been informed that the patients were consent to partici-pate in the study.
Funding
The four sources of funding for this research reported are listed as follows: National High Technology Research and Development Program of China (863 Program) (Research and development for cerebral vascular real-time interventional therapy with mobile surgical robot system, Grant No. 2015AA043203), National Natural Science Foundation of China (Computer-assisted analysis and clinical application research of cerebral arteriovenous malformations based on MRA, Grant No. 61471349), Basic Discipline Layout Project of Shenzhen City (Research of surgical vessel intervention with immersing multi-perception mode, Grant No. JCYJ20150731154850923), and Technology innovation program of Shenz-hen City (Research and development of minimally invasive spinal surgery system based on multi-modality imaging and Intraoperative navigation, Grant No. JSGG20160229203812944). The first funding provides support in the design of this study, the second one and the third one are responsible for data collection, and the last one for data analysis.
Received: 28 July 2016 Accepted: 31 October 2016
References
1. Ma Z, Tavares JMRS, Jorge RMN. A review on the current segmentation algorithms for medical images. In: Int. conf. on imaging theory and applications. 2009.
2. Ma Z, Tavares JMRS, Jorge RN, Mascarenhas T. A review of algorithms for medical image segmentation and their applications to the female, pelvic cavity. Comput Methods Biomech Biomed Eng. 2010;13(2):235–46.
3. Oliveira RB, Filho ME, Ma Z, Papa JP, Pereira AS, Tavares JMRS. Computational methods for the image segmentation of pigmented skin lesions: a review. Comput Methods Programs Biomed. 2016;131:127–41.
4. Filho M, Ma Z, Tavares JMRS. A review of the quantification and classification of pigmented skin lesions: from dedi-cated to hand-held devices. J Med Syst. 2015;39(177):1–12.
5. Jodas DS, Pereira AS, Tavares JMRS. A review of computational methods applied for identification and quantification of atherosclerotic plaques in images. Expert Syst Appl. 2015;46:1–55.
6. Frangi AF, Niessen WJ, Vincken KL, Viergever MA. Multiscale vessel enhancement filtering. In: First international conference on medical image computing and computer-assisted intervention. Berlin: Springer; 1998. p. 130–37. 7. Zhou C, Chan HP, Sahiner B, Hadjiiski LM, Chughtai A, Patel S, Wei J, Ge J, Cascade PN, Kazerooni EA. Automatic
multiscale enhancement and segmentation of pulmonary vessels in ct pulmonary angiography images for cad applications. Med Phys. 2007;34(12):4567–77.
8. Ye DH, Kwon D, Yun ID, Sang UL. Fast multiscale vessel enhancement filtering. In: Medical imaging. Bellingham: International Society for Optics and Photonics; 2008. p. 691423.
9. Chen C, Zhang JZ. Improved multi-scale Retinex enhancement algorithm of medical X ray images. Comput Eng Appl. 2015;9:191–5.
10. Mesejo P, Valsecchi A, Marrakchi-Kacem L, Cagnoni S, Damas S. Biomedical image segmentation using geometric deformable models and metaheuristics. Comput Med Imaging Graph. 2015;43:167–78.
11. Gan R, Wong WCK, Chung ACS, Yu SCH. Statistical cerebrovascular segmentation in three-dimensional rotational angiography based on maximum intensity projections. Med Phys. 2005;32(9):195–200.
12. Xiong TS, Huang YY. Robust gaussian mixture modelling based on spatially constraints for image segmentation. J Inf Hiding Multimed Signal Process. 2015;6(5):857–68.
13. Zhang H, Wen T, Zheng Y, Xu D, Wang D, Nguyen TM. Two fast and robust modified Gaussian Mixture models incor-porating local spatial information for image segmentation. J Signal Process Syst. 2015;81(1):1–14.
• We accept pre-submission inquiries
• Our selector tool helps you to find the most relevant journal • We provide round the clock customer support
• Convenient online submission • Thorough peer review
• Inclusion in PubMed and all major indexing services • Maximum visibility for your research
Submit your manuscript at www.biomedcentral.com/submit
Submit your next manuscript to BioMed Central
and we will help you at every step:
15. Qian HY, Zhou WP, Bao XD, Luo LM. MRA blood vessel segmentation based on anti-concentration diffusion method and Mumford-Shah model relating to grayscale histogram. Signal Process. 2007;23(2):273–7.
16. Tang S, Lin T, Yang J, Fan J, Ai D, Wang Y. Retinal vessel segmentation using supervised classification based on multi-scale vessel filtering and Gabor wavelet. J Med Imaging Health Inform. 2015;5(7):9–17.
17. Yan P, Kassim AA. Segmentation of volumetric MRA images by using capillary active contour. Med Image Anal. 2006;10(3):317–29.
18. Bauer C, Tsorantin P. Segmentation of interwoven 3d tubular tree structures utilizing shape priors and graph cuts. Med Image Anal. 2010;14(2):172–84.
19. Wilson DL, Noble JA. An adaptive segmentation algorithm of time-of-flight MRA data. IEEE Trans Med Imaging. 1999;18(10):938–45.
20. Yousefi S, Liu T, Wang RK. Segmentation and quantification of blood vessels for OCT-based micro-angiograms using hybrid shape/intensity compounding. Microvasc Res. 2015;97:37–46.
21. Hassouna MS, Farag AA. Cerebrovascular segmentation from TOF using stochastic models. Med Image Anal. 2006;10:2–18.
22. Gao X, Uchiyama Y, Zhou X, Hara T, Asano T, Fujita H. A fast and fully automatic method for cerebrovascular segmen-tation on time-of-flight (TOF) MRA image. J Digit Imaging. 2011;24(4):609–25.
23. Zhou SJ, Chen WF, Jia FC, Hu QM, Xie YQ, Chen MY, Wu JH. Segmentation of brain magnetic resonance angiography images based on MAP–MRF with multi-pattern neighborhood system. Med Image Anal. 2013;17:1220–35. 24. Besag J. Spatial interaction and the statistical analysis of lattice systems. J R Stat Soc B. 1974;36(2):192–236. 25. Derin H, Elliott H. Modeling and segmentation of noisy and textured images using Gibbs random fields. IEEE Trans
Pattern Anal Mach Intell. 1987;9(1):39–55.