Open Access
Research
Correlates of serum lipoprotein (A) in children and adolescents in
the United States. The third National Health Nutrition and
Examination Survey (NHANES-III)
Thomas O Obisesan*
1, Muktar H Aliyu
2, Abayomi S Adediran
1,
Vernon Bond
3, Celia J Maxwell
4and Charles N Rotimi
5Address: 1Section of Geriatrics, Department of Medicine, Howard University Hospital, Washington, USA, 2Department of Epidemiology, University of Alabama at Birmingham, USA, 3Department of Human Health & Leisure Studies, Howard University, Washington, USA, 4Institute for Women's Health, Howard University Hospital, Washington, USA and 5National Human Genome Center Genetic Epidemiology Unit, Department of Microbiology, Howard University, Washington, USA
Email: Thomas O Obisesan* - tobisesan@howard.edu; Muktar H Aliyu - Aliyu-S@ms.soph.uab.edu;
Abayomi S Adediran - abayomi_2001@yahoo.com; Vernon Bond - Vbond@howard.edu; Celia J Maxwell - cmaxwell@howard.edu; Charles N Rotimi - crotimi@howard.edu
* Corresponding author
Lipoprotein(a)AdolescenceGenderEthnicityParental History
Abstract
Objective: To determine the correlates of serum lipoprotein (a) (Lp(a)) in children and adolescents in the United States.
Methods: Cross-sectional study using representative data from a US national sample for persons aged 4–19 years participating in The Third National Health Nutrition and Examination Survey (NHANES-III).
Results: We observed ethnicity-related differences in levels of Lp(a) > 30 mg/dl, with values being markedly higher in African American (black) than nonhispanic white (white) and Mexican American children in multivariate model (P < 0.001). Higher levels of Lp(a) > 30 mg/dl associated with parental history of body mass index and residence in metro compared to nonmetro in Blacks, and high birth weight in Mexican American children in the NHANES-III. In the entire group, total cholesterol (which included Lp(a)) and parental history of premature heart attack/angina before age 50 (P < 0.02) showed consistent, independent, positive association with Lp(a). In subgroup analysis, this association was only evident in white (P = 0.04) and black (P = 0.05) children. However, no such collective consistent associations of Lp(a) were found with age, gender, or birth weight.
Conclusion: Ethnicity-related differences in mean Lp(a) exist among children and adolescents in the United States and parental history of premature heart attack/angina significantly associated with levels of Lp(a) in children. Further research on the associations of Lp(a) levels in childhood with subsequent risk of atherosclerosis is needed.
Published: 16 December 2004
Lipids in Health and Disease 2004, 3:29 doi:10.1186/1476-511X-3-29
Received: 11 November 2004 Accepted: 16 December 2004
This article is available from: http://www.lipidworld.com/content/3/1/29 © 2004 Obisesan et al; licensee BioMed Central Ltd.
Introduction
Levels of serum or plasma Lp(a) above 30 mg/dL are asso-ciated with increased risk of coronary artery disease and stroke in adults of European descent [1-3]. Given the high degree of structural homology of one of the domains of its apolipoprotein(a) component with plasminogen, one proposed mechanism is interference with thrombolysis [1,3]. Adults of African descent have mean levels of Lp(a) approximately twice those of Europeans but do not have commensurately increased risk of atherosclerotic disease; nor has Lp(a) been shown to be a coronary artery disease risk factor in Blacks [4,5]. The explanations for the differ-ential effects of Lp(a) on CVD risk among different popu-lations are poorly understood. Because birth weight has been shown to influence levels of Lp(a) [6], and adverse patterns of blood lipids and atherosclerosis itself begin in childhood, studies of population and individual differ-ences in the early onset and progression of risk factors through adolescence are important [7]. Given the reported contribution of intrinsic factors, family history, and environmental factors to the CVD risk in adults [8-10], the identification of inherited risk markers and envi-ronmental variables that may interact with levels of Lp(a) > 30 mg/dl to modify its influence on the development of atherosclerosis at an early age, is therefore imperative.
Few studies have examined the epidemiology of Lp(a) in representative samples of total populations of children and adolescents[11,12]. However, no study has examined whether the effects of inherited and acquired or environ-mental factors interact with Lp(a) > 30 mg/dl, to cause dif-ferential attributable risk in different populations using data from a nationally representative sample of children in the US. We utilized data from a national survey of over 30,000 persons age 1 year and older with extensive blood lipid data to examine correlates of Lp(a) in children and adolescents and specifically to determine whether: [1] eth-nic differences in shape of Lp(a) distributions seen in adults are also seen as early as age 4 in children; [2] family history of cardiovascular disease is associated with higher levels of Lp(a); [3] the effects of ethnicity and family his-tory of CVD on the levels of Lp(a) are influenced by low birth weight, other personal, behavioral or environmental variables.
Methods
Data for this analysis was obtained from The Third National Health and Nutrition Examination Survey (NHANES-III) conducted on a nationwide multi-stage probability sample of about 40,000 persons from the civilian, non-institutionalized population aged 2 months and over of the United States excluding reservation lands of American Indians. Of these, 31,311 were examined. Our analysis was restricted to children aged 4–11 years (518 whites, 877 blacks, and 685 Mexican Americans)
and adolescents aged 4–19 years (336 Whites, 665 Blacks and 504 Mexican Americans) with valid Lp(a) measure-ments in Phase II of the survey conducted in 1991–1994. Details of the planning, sampling, operation, informed consent procedures, and measures taken to maintain con-fidentiality of information have been previously detailed [13].
Demographic, medical history and behavioral informa-tion were collected prior to the examinainforma-tion by household interview of the parents or guardians of children and of adolescents aged 12 and over. Parents of children aged 2 months-11 years were asked "How much did the child weigh at birth?". Parents responding "don't know" were asked "Did the child weigh more than 5 1/2 pounds (2500 grams) or less? Responders were then asked, "Did the child weigh more than 9 pounds (4100 grams) or less?" An approximate category of weight at birth was cre-ated by combined responses to exact birth weights and the latter two questions. Participants' parent or guardian was also asked, "Has either of the biological parents ever been told by a doctor that he or she had a) high blood pressure or stroke before age 50 b) heart attack or angina before the age of 50? c) high blood cholesterol at any age? d) diabe-tes at any age? All "Yes" responses were followed by "Which, father, mother, or both?" Other interview varia-bles are described elsewhere [13].
Blood samples were obtained at the examination centers [14]. A subsample of persons 12 years and over was asked to fast overnight for the examination of lipids in the morning. Lp(a) in serum was measured immunochemi-cally by using an enzyme-lined immunosorbant assay (ELISA) (Strategic Diagnostics, Newark, DE) [14], which does not have cross reactivity with plasminogen or LDL non sensitive to apo(a) size heterogeneity. The normal range was set at 0 to 30 mg/dL because concentrations above 30 mg/dL have been associated with increase risk for coronary heart disease and stroke [1,3] (Plasma con-centrations were 3 % lower than serum concon-centrations). The quality control of the Lp(a) assay has been described in detail elsewhere [14]. Serum samples with Lp(a) > 80 mg/dL were diluted into the assay range with sample diluent.
morning and fasted 9 hours or more, and whose triglycer-ide concentration was less than or equal to 400 mg/dL. Because fasting was not required in children, LDL could be calculated on only 15% of this sample. In selected anal-yses, serum total cholesterol was corrected for Lp(a) cho-lesterol as follows: TCc = TC - Lp(a) × 0.30 [11]. Standing height was measured to the nearest 0.1 centimeter, weight to the nearest 0.01 kg, triceps, subscapular, suprailiac and mid-thigh skinfold thickness to the nearest 0.1 millimeter and waist and buttocks circumference to the nearest 0.1 centimeter [15,16].
Statistical analysis
Population estimates for many of the variables other than Lp(a) have been published by the National Center for Health Statistics [14,17]. Because, body weight, family history, socio-economic factors including income, gender, ethnicity, birth weight and regional diversity have been shown to influence levels of Lp(a) and or CVD risk in gen-eral, [18-20,6,21] our analyses of the population estimate and correlates of Lp(a) were mindful of these factors. In order to ensure adequate weight for a given age group, and to examine pre- peri- and post pubertal effects on levels of Lp(a), quintile distribution of age was used as a categori-cal variable. Detailed descriptive statistics and measures of association were computed initially using unweighted data. Kendall's nonparametric rank correlation was used to assess the association of Lp(a) with other variables and compared to Pearson correlation [22]. To determine the
influence of gender and ethnicity on the distribution of Lp(a), analysis of covariance was used to compute adjusted means for subjects within sex and ethnic catego-ries, and to assess the statistical significance of differences of means among groups. Stepwise logistic multiple regres-sion analysis was used to develop models for predicting Lp(a) >30 mg/dL for each sex, and ethnic group [22]. Only variables with pre-specified hypotheses and with sta-tistically significant univariate correlation coefficients were eligible to enter the regression models. Following these preliminary analyses, preplanned hypotheses and major findings of the unweighted analyses were con-firmed using techniques that incorporated sampling weights and design features of the survey [14]. Population estimates for mean Lp(a) and percentiles and statistical tests of weighted proportions were produced using Statis-tical Analysis System (SAS) callable SUDAAN [23]. Chi-Square analysis was used for the comparisons of distribu-tions of Lp(a) categorized into 10 mg/dL strata between sex, ethnicity and age groups. Associations of Lp(a) with other variables were confirmed in final weighted analysis, using PROC LOGIST procedure in SUDAAN [23] with alpha set at <0.05. Since substantial proportions of white and Mexican American children had undetectable Lp(a), log or other transformations could not produce an approximately normal distribution of Lp(a) for paramet-ric analyses. Therefore analytic results presented are pri-marily those using Lp(a) > 30 mg/dL as a categorized variable.
Table 1: Selected percentiles of lipoprotein(a) distributions and prevalence of concentrations > 30 mg/dL in children and young adults aged 4–19 years by ethnic group and age: NHANES-III, 1988–1994.
Ethnic group Age (yrs) Lipoprotein(a) (mg/dL) N
Percentile Percent > 30 (mg/dL)
5 10 50 90 95
Nonhispanic white
4–5 0 0 7 38 62 15.0 214
6–11 0 0 12 48 65 18.8 304
12–15 0 0 10 48 56 20.2 187
16–19 0 0 9 53 62 25.8 149
Nonhispanic black
4–5 2 6 31 75 94 52.5* 303
6–11 1 5 32 76 100 53.3* 574
12–15 0 5 33 77 95 56.4* 358
16–19 1 6 31 69 76 54.6* 307
Mexican American
4–5 0 0 5 30 48 8.2 309
6–11 0 0 9 45 62 21.0 376
12–15 0 0 9 48 58 20.1 272
16–19 0 0 8 36 52 11.4 232
Results
Univariate Analyses Ethnicity
Blacks had higher median Lp(a) than whites, who had higher levels than Mexican Americans (Table 1). The dif-ference was already apparent at ages 4–5 years. Further,
the shape of the Lp(a) distributions differed markedly for BLACKS compared to other ethnic groups at each age and overall. Blacks had a bimodal distribution that was less skewed than whites or Mexican Americans (Figure 1). The percentage of children aged 4–19 with Lp(a) > 30 mg/dL, was higher in Blacks (54.3, SE 1.8) than in Whites (20.3, Percent Frequency of Lp(a) mg/dl in children aged 4–16 years, by ethnic group in the Third National Health and Nutrition Examination Survey, 1988–1994
Figure 1
Percent Frequency of Lp(a) mg/dl in children aged 4–16 years, by ethnic group in the Third National Health and Nutrition Examination Survey, 1988–1994.
Table 2: Median lipoprotein(a) and prevalence of concentrations >30 mg/dL in children aged 4–16 years by ethnic group and parental history of heart or an angina below age 50, high cholesterol, or diabetes: NHANES-III, 1988–1994
Ethnic group Lipoprotein(a) mg/dL N
Median (mg/dL) Percent > 30 (mg/dL) Heart
Attack
High Cholesterol
Diabetes Heart Attack
High Cholesterol
Diabetes Heart Attack
High Cholesterol
Diabetes
Nonhispanic white
Yes 25 13 12.5 42.6* 26.7 32.8 15 138.0 34
No 10 8 8 18.4 16.1 18.0 722 586.0 701
Nonhispanic black
Yes 45 28 33.5 72.4* 48.9 56.6 53 111.0 86
No 32 33 32 54.1 55.5 54.8 1242 1176.0 1206
Mexican American
Yes 12 9.5 7 34.5* 19.6 19.2 21 134.0 45
No 7.5 7 8 18.3 18.7 18.7 990 870.0 966
* Indicates statistically significant association of parental history of heart attack before age 50 with levels of Lp(a) > 30 mg/dl nonhispanic black, nonhispanic white and Mexican American children. Significance level was set at < 0.05.
0 10 20 30 40 50 60
Percent frequency
Nonhispanic Whites
Nonhispanic Blacks
Mexican Americans
5 15 25 35 45 55 65 75 85 95 105 115 120+
SE 2.4) or Mexican Americans (16.8, SE 2.3), both overall (Chi square 47.4, p < 0.001) and in each age group (Table 1).
Age
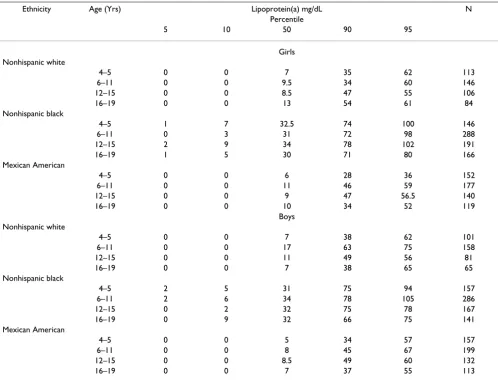
Table 3 shows percentiles by sex, age and ethnic group. Among boys of all sex-ethnicity groups, median Lp(a) was higher at age 6–11 than at age 4–5, then tended to decline slightly through age 16–19. Among girls, there was no consistent pattern for median Lp(a), being highest at age 16–19 in whites, at age 12–15 in blacks, and at 6–11 in Mexican Americans. The percentage with Lp(a) > 30 mg/ dL varied significantly by age group only in Mexican Americans (Chi square = 10.6, P = 0.02) (Table 1).
Gender
Median Lp(a) did not differ consistently by gender across age or ethnic groups (Table 3). Similarly, the percentage
with Lp(a) > 30 mg/dL did not differ significantly by gen-der within ethnic groups (Chi Square = 0.003, P = 0.96).
Birth Weight
Birth weight by parental recall was available for children aged 4–11 years (Table 4). Birth weight did not vary with Lp(a) in any ethnic group. Further, in blacks, the percent-age with Lp(a) >30 mg/dL did not differ by birth weight category (52.5, 53.3, 56.4, respectively). Small numbers of cases with both abnormal birth weight and elevated Lp(a) >30 mg/dL among whites and Mexican Americans pre-cluded meaningful analysis.
Family history
In all the groups combined (age range 4–16 years), the percentage with Lp(a) > 30 mg/dL was significantly higher among those with parental history of heart attack/angina before age 50 years compared to those without (50.0 per-Table 3: Selected percentiles of lipoprotein(a) distributions and prevalence of concentrations > 30 mg/dL in children and young adults aged 4–19 years by ethnic group and age: NHANES-III, 1988–1994.
Ethnicity Age (Yrs) Lipoprotein(a) mg/dL N
Percentile
5 10 50 90 95
Girls Nonhispanic white
4–5 0 0 7 35 62 113
6–11 0 0 9.5 34 60 146
12–15 0 0 8.5 47 55 106
16–19 0 0 13 54 61 84
Nonhispanic black
4–5 1 7 32.5 74 100 146
6–11 0 3 31 72 98 288
12–15 2 9 34 78 102 191
16–19 1 5 30 71 80 166
Mexican American
4–5 0 0 6 28 36 152
6–11 0 0 11 46 59 177
12–15 0 0 9 47 56.5 140
16–19 0 0 10 34 52 119
Boys Nonhispanic white
4–5 0 0 7 38 62 101
6–11 0 0 17 63 75 158
12–15 0 0 11 49 56 81
16–19 0 0 7 38 65 65
Nonhispanic black
4–5 2 5 31 75 94 157
6–11 2 6 34 78 105 286
12–15 0 2 32 75 78 167
16–19 0 9 32 66 75 141
Mexican American
4–5 0 0 5 34 57 157
6–11 0 0 8 45 67 199
12–15 0 0 8.5 49 60 132
cent versus 30.2 percent), Chi square 2.72, P = 0.011), whereas the percentage (Lp(a) > 30 mg/dL) was similar among those with parental history of diabetes and high cholesterol vs. those without (Figure 2). Due to small
numbers of children with a history of heart attack within ethnic groups, the difference in percentage of persons with Lp(a) did not attain significance in within-groups analysis: white children, 42.56% versus 18.36%, P = 0.23, Table 4: Selected percentiles of lipoprotein(a) distributions and prevalence of concentrations > 30 mg/dL in children aged 4–11 years by ethnic group and birth-weight: NHANES-III, 1988–1994.
Ethnic group Age (yrs) Lipoprotein(a) mg/dL N
Birth Weight Median 50 Percent > 30 mg/dL
Nonhispanic white
<2500 gm 12 15.0 32
2500–4100 gm 10 18.8 441
>4100 gm 7 20.2 43
Nonhispanic black
<2500 gm 32 52.5 115
2500–4100 gm 32 53.3 702
>4100 gm 29 56.4 44
Mexican American
<2500 gm 3 8.2 45
2500–4100 gm 8 21.0* 573
>4100 gm 5 20.1* 57
* Indicates within group statistically significant association of Lp(a) > 30 mg/dl with birth weight using birth weight < 2500 gm as the reference value. Significance level was set at < 0.05.
Prevalence of lipoprotein(a) concentration > 30 mg/dl in children aged 4–16 years, by combined ethnic group, and parental his-tory of heart disease or angina, high cholesterol, or diabetes below age 50 in the Third National Health and Nutrition Examina-tion Survey, 1988–1994
Figure 2
Prevalence of lipoprotein(a) concentration > 30 mg/dl in children aged 4–16 years, by combined ethnic group, and parental his-tory of heart disease or angina, high cholesterol, or diabetes below age 50 in the Third National Health and Nutrition Examina-tion Survey, 1988–1994
0
10
20
30
40
50
60
Heart Attack
High Cholesterol
Diabetes
Family History
Percent with LP(a) >30 mg/dl
Yes
black children 72.37% versus 54.06%, P = 0.12, Mexican American children 34.46% versus 18.26%, P = 0.33 (Table 2). In white children, the percentage was higher in children with a parent with high blood cholesterol com-pared to children without (26.74% versus 16.12%; P = 0.02). However, no significant differences were seen in other groups.
Region
Among white children, median Lp(a) was lower in the Midwest (8.2 mg/dL) and South (8.2) than in the Northeast (16.4), or West (10.1). No differences were noted for Blacks and too few Mexican Americans lived in the Northeast and Midwest for evaluation. In white chil-dren, the percentage with Lp(a) > 30 mg/dL were 15.1 in the Midwest, Northeast 25.1, South 21.2, West 21.4 (P = 0.56). Among blacks, a greater percent of metropolitan, compared to non-metropolitan (57% Vs 49.7%; P = 0.04) had Lp(a) > 30 mg/dL. No significant differences were seen in other groups.
Income
Family income < $20,000 was not associated with Lp(a) > 30 mg/dL in whites or Mexicans, but Blacks with low income tended to have a higher percentage of individuals with Lp(a) >30 mg/dL (56.9% versus 50.5%, P = 0.10). Poverty income ratio was not significantly correlated with Lp(a).
Multivariate Analyses
The following additional variables known to influence CVD risk were assessed as correlates of Lp(a) by ethnic group: age, total serum cholesterol, HDL cholesterol, cas-ual triglycerides, hours of fasting, weight, height, body mass index, waist circumference, waist-to-hip ratio, sub-scapular skinfold thickness, suprailiac skinfold thickness, pulse rate, systolic and diastolic blood pressure, heavy activity frequency or TV hours. Logistic regression analysis with Lp(a) > 30 as dichotomous dependent variable and age in months as independent variable revealed a signifi-cant linear association in whites (beta = 0.004, SE = 0.002,
P = 0.03) and a quadratic association in Mexican Ameri-cans (age beta 0.068, SE = 0.013, P < 0.001, age squared beta -0.000, SE beta 0.000, P < 0.001), indicating a lower prevalence of Lp(a) > 30 mg/dL at both ages 4–5 and 16– 19 than at 6–15 years. Age and age squared, and sex were entered first in all analyses described below. Controlling for age, sex was not significantly associated with high Lp(a) in any group. Compared to whites, non-hispanic black ethnicity was significantly associated with high Lp(a) after controlling for age and sex (P < 0.001). Mexi-can AmeriMexi-can ethnicity was not signifiMexi-cantly associated with lower prevalence of high Lp(a) (P = 0.35). Within ethnic groups at ages 4–11 years, low birth weight (<2500 g) was not significantly associated with high Lp(a) after
controlling for age and sex. High birth weight (>4100 g) was associated with high Lp(a) (beta 1.87, P = 0.02) only in Mexican Americans.
Parental history of heart attack/angina before age 50 was significantly associated with Lp(a) >30 after controlling for age and sex both in white children (beta -1.14, SE 0.55,
P = 0.04) and in blacks (beta -0.80, SE 0.39, P = 0.05). Parental history of heart attack/angina was also signifi-cantly associated with high Lp(a) in all children (P = 0.02) after controlling for age, sex and ethnicity. In white chil-dren, parental history of high blood cholesterol (P = 0.07) and diabetes mellitus (P = 0.16) were not significantly associated with high Lp(a) after adjustment for age and sex.
Residence in central cities/fringe areas remained signifi-cantly associated with high Lp(a) in black children after controlling for age, sex, region, season, and time of the day (beta = -0.33, SE = 0.13, P = 0.02). Region, rural/ urban code, family income < 20,000 or higher poverty income ratio were not significantly associated with high Lp(a) in white or Mexican American children (all P > 0.05).
Body mass index or weight were significant predictors of Lp(a) > 30 mg/dL only among black children after con-trolling for age, sex, region, rural/urban code, season and poverty income ratio, e.g. weight(kg) P = 0.02. Neither HDL cholesterol nor casual triglyceride concentration was significantly associated with Lp(a) after controlling for multiple variables. Total serum cholesterol was signifi-cantly associated with Lp(a) after controlling for multiple variables in all three ethnic groups as expected.
Discussion
The most important findings of this study are that ethnic-ity significantly associated with Lp(a), and that parental history of heart attack significantly associated with Lp(a) levels >= 30 mg/dl. While non-hispanic black children had significantly higher total Lp(a) level, compared to white and Mexican American children, no consistent asso-ciations of age or gender with Lp(a) were found in NHANES-III below age 20. Low birth weight (<2500 g) was not significantly associated with high Lp(a) after con-trolling for age and sex in the entire group. Higher levels of Lp(a) >30 mg/dl was evident in metropolitan com-pared to non-metropolitan non-hispanic black children.
Mechanisms
cells which release growth factors. Lp(a) acquires a patho-genic profile on entering the arterial cell wall as a result of the influence of factors operating in the inflammatory environment of the atheromatous vessel, such as proteo-lytic enzymes of the metalloproteinase family [25]. About 80% of the amino acids in apo(a) are homologous with those of plasminogen, suggesting a possibly thrombolytic effect which might both promote atherosclerosis and trig-ger acute thrombotic occlusions [1,3,26].
Whereas levels of Lp(a) above 30 mg/dL was shown to increase risk of coronary heart disease in European sam-ples [3,24], no such association has been found in black populations, in whom the concentration is twice that in Europeans [24,27]. Study of serum concentrations of this particle in children is especially important since, unlike LDL, its concentration is postulated to be remarkably sta-ble throughout the life of an individual. Thus, identifica-tion of persons at increased risk early in life would permit more effective intervention to lower levels of modifiable risk factors such as LDL cholesterol.
Environment, Ethnicity, Age and Gender
A number of studies of adults have compared Lp(a) levels in Whites and Blacks, and have uniformly reported two-fold higher levels in Blacks [4,5,11]. In Texas, Mexican American adults were found to have lower Lp(a) than whites. Conversely, Kambor et al observed higher mean and median plasma Lp(a) concentrations in hispanic men than white men in Colorado with lesser difference seen in women[28]. Although the explanations for these findings remain unclear, environmental factors, genetic admixture [29] or a combination of both should be considered.
No previous reports of studies comparing Lp(a) in whites and blacks and Mexican American children in the same study were found prior to NHANES-III. In fact, few com-parisons of plasma Lp(a) concentrations were found for hispanic children or other children below age 8 years prior to NHANES-III [30,31]. The present findings extend the published report by examining children in greater detail and examining the relationship of birth weight and family history of cardiovascular disease with Lp(a) in children.
Perhaps one of the most noteworthy observation from this study is the significantly higher levels of Lp(a) >30 mg/dl in black, compared to white and Mexican American children (Table 1). Ethnic-related differences in Lp(a) similar to those in adults were found in children as young as 4–5 years of age, supporting the presence of higher lev-els of Lp(a) in black children compared to other ethnic groups (Table 1). This observation is consistent with find-ings of the Bogalusa Heart Study of white and black chil-dren, and the NHLBI Growth and Health Study of girls that showed higher Lp(a) levels in black than white
chil-dren [30,32]. Findings in Mexican Americans in the NHANES-III study is analogous to reports from the Colo-rado study showing a greater percent of Hispanics than whites (19% versus 12%) to have Lp(a) > 25 mg/dL.
The explanation for ethnic-related differences in levels of Lp(a) in the US remains unclear. Other than total choles-terol, no single environmental or biological variable con-sistently associated with levels of Lp(a) in the NHANES-III sample. While levels of Lp(a) > 30 mg/dl received signifi-cant contributions from BMI and residence in metro com-pared to non-metro in black children, only higher birth weight significantly contributed to levels of Lp(a) in Mex-ican AmerMex-ican children. Contrary to a previous report of association of low birth weight with elevated Lp(a) con-centration in black children, [6] we found no consistent association of low birth weight with levels of Lp(a) in black or white children in the present study (Table 4).
At the genetic level, heritability estimates were reportedly higher for Whites than for Blacks [33,34] despite the dis-proportionately higher levels of Lp(a) in Blacks. This observation raises an important question about the genetic determinants of differential levels of Lp(a) in non-hispanic Blacks compared to Whites. A recent study on genetic linkage analysis by Barkley et al found no linkage evidence to support the presence of a single but separate gene with large effects specifically segregating in non-his-panic Blacks that may account for elevated Lp(a) lev-els[35] Conversely, high levels of Lp(a) levels have been suggested to be an old African trait that is associated with mutations in the coding sequences of apo(a) [36]. Collec-tively, these disagreements among studies suggest that higher levels of Lp(a) in non-hispanic Blacks compared to other ethnic groups, may result from a complex interac-tion of genes with environmental and metabolic factors, [37]. Future identification of the presence and nature of this interaction is imperative.
Studies of adults found an association of higher age and female gender with higher Lp(a) levels [38]. The Bogalusa Heart Study found a small but significant gender differ-ence and a weak positive correlation with age (p < 0.001) in white girls 11–17 years of age [30]. However, we found no consistent associations of age or gender with Lp(a) in NHANES-III below age 20 (Table 3). Despite the levels of Lp(a) that tended to be highest between age 6 – 11 years in boys, the lack of similar trend in girls, and the absence of age-related difference in the levels of Lp(a) in the com-bined group, suggests that pre-pubertal or pubertal status may not significantly influence levels of Lp(a) in children.
behav-ioral, or environmental variables. It therefore appears likely, that multiple factors at the environment and or genetic levels may act together to differentially influence levels of Lp(a) in children and adolescents in the US.
Family History
Few studies of the association of Lp(a) with family history have been reported in children [30,39]. Our observations of significant association of parental history of heart attack/angina before age 50, with levels of Lp(a) >30 mg/ dl in NHANES-III (Figure 2) are consistent with results from the Bogalusa study that found an association of parental history of premature heart attack with higher lev-els of Lp(a) [30]. However, contrary to Bogalusa study showing an association of Lp(a) with parental history of hypercholesterolemia, trends for family history in black children in NHANES-III were concordant with those in whites, although not attaining statistical significance. More recently, Dirisamer and colleagues provided addi-tional support for higher levels of Lp(a) levels in children and adolescents from families with premature coronary heart disease compared to those without familial coro-nary heart disease [40]. In young adults aged 23–35 years in the CARDIA study, a non-significant trend toward higher Lp(a) levels in those with a family history of myo-cardial infarction was observed in whites, but no associa-tion was seen in blacks [33]. Collectively, the associaassocia-tion of parental history of premature heart attack appears asso-ciated with levels of Lp(a) > 30 mg/dl, may lend support to the theory of genetic underpinning for the higher levels of Lp(a) observed in black children.
In the NHANES-III study, no association of Lp(a) were seen with family history of stroke, hypertension, or diabetes. Similarly, family history of high cholesterol and diabetes were not significantly associated with levels of Lp(a) >30 mg/dl in the entire sample (Figure 2), except in non-hispanic white children (Table 2). Cross-sectional studies of adults have not consistently shown a relation-ship of Lp(a) with NIDDM. Conversely, several reports indicate an association between IDDM with Lp(a) [29,41]. However, NIDDM is thought to have a stronger genetic component in its etiology than IDDM [42]. Despite the inconsistencies in the literature, there is strong evidence to suggest that Lp(a) is a risk factor for vascular disease in diabetics [43]. Further research on clinical and subclinical diabetes and Lp(a) is needed.
Limitations
Limitations of the present study include possible bias from survey non-response, missing values for some varia-bles, and confounding by variables not measured. Fortu-nately, several special studies of earlier NHANES-III data have indicated little bias due to non-response [44]. Although, adequate reliability has been demonstrated for
Lp(a) measurement [14], the lack of a single, generally accepted laboratory method and national standardization program remains a problem, perhaps explaining in part the inconsistencies among studies [3]. The relatively large sample size provided good statistical power and the con-servative criteria for statistical significance reduced the possibility of chance findings attaining significance despite a large number of tests. Overall, the representa-tiveness of the sample and the use of sample weights pro-vided wide generalizability of the results to United States black and white and Mexican American children and ado-lescents of the same ages.
In conclusion, ethnicity significantly associated with lev-els of Lp(a). Parental history of heart attack/angina before age 50 years associated with levels of Lp(a) > 30 mg/dl in offspring. Collectively, different pathological thresholds may have to be established for elevated serum Lp(a) lev-els, to be used as a risk marker for coronary heart disease in different populations. Future research should include longitudinal studies of Lp(a) in white, black and hispanic children followed to adulthood. Racial admixture as well as environment and behavioral variables associated with acculturation and urban residence should be studied, especially in Mexican American and black populations. Standardization of methods will facilitate inter-study and longitudinal comparisons.
Acknowledgements
We acknowledge Thomas Socey, for computer programming; and the staff and contractors of the Division of Health Examination Statistics of the National Center for Health Statistics, who conducted the survey and pre-pared the data for analysis.
The project was supported by grant #AG00980 (NIA) to Obisesan TO, and RR10284 (HU).
References
1. Huang KC, Lue BH, Yen RF, Shen CG, Ho SR, Tai TY, Yang WS: Plasma adiponectin levels and metabolic factors in
nondia-betic adolescents. Obes Res 2004, 12(1):119-124.
2. Wild SH, Fortmann SP, Marcovina SM: A prospective case-control study of lipoprotein(a) levels and apo(a) size and risk of cor-onary heart disease in Stanford Five-City Project
participants. Arterioscler Thromb Vasc Biol 1997, 17(2):239-245.
3. Craig WY, Neveux LM, Palomaki GE, Cleveland MM, Haddow JE: Lipoprotein(a) as a risk factor for ischemic heart disease:
metaanalysis of prospective studies. Clin Chem 1998,
44(11):2301-2306.
4. Rotimi CN, Cooper RS, Marcovina SM, McGee D, Owoaje E, Ladipo M: Serum distribution of lipoprotein(a) in African Americans and Nigerians: potential evidence for a
genotype-environ-mental effect. Genet Epidemiol 1997, 14(2):157-168.
5. Marcovina SM, Albers JJ, Wijsman E, Zhang Z, Chapman NH, Kennedy
H: Differences in Lp[a] concentrations and apo[a]
poly-morphs between black and white Americans. J Lipid Res 1996,
37(12):2569-2585.
6. Okosun IS, Dever GE, Choi ST: Low birth weight is associated with elevated serum lipoprotein(a) in white and black
Amer-ican children ages 5-11 y. Public Health 2002, 116(1):33-38.
7. Lenfant C: Task force on Research in Epidemiology and
Pre-vention of Cardiovascular Diseases. Circulation 1994,
8. Pajak A: [Psychosocial and nutritional risk factors for cardio-vascular disease--longitudinal cohort study. Assumptions,
goals and methods of the screening survey]. Przegl Lek 2002,
59(12):993-998.
9. Hegele RA: Environmental modulation of atherosclerosis end
points in familial hypercholesterolemia. Atheroscler Suppl 2002,
2(3):5-7.
10. Cook DG, Cappuccio FP, Atkinson RW, Wicks PD, Chitolie A, Nakandakare ER, Sagnella GA, Humphries SE: Ethnic differences in fibrinogen levels: the role of environmental factors and the
beta-fibrinogen gene. Am J Epidemiol 2001, 153(8):799-806.
11. Baroni S, Scribano D, Valentini P, Zuppi C, Ranno O, Giardina B: Serum apolipoprotein A1, B, CII, CIII, E, and lipoprotein (a)
levels in children. Clin Biochem 1996, 29(6):603-605.
12. Schumacher M, Kessler A, Meier A, Weigert S, Wood WG: Lipopro-tein(a) concentrations in cord and capillary blood from new-borns and in serum from in-patient children, adolescents and
adults. Eur J Clin Chem Clin Biochem 1994, 32(5):341-347.
13. Plan and operation of the Third National Health and
Nutri-tion ExaminaNutri-tion Survey, 1988-94. Series 1: programs and
collection procedures. Vital Health Stat 1 1994:1-407.
14. The Third National Health and Nutrition Examination
Sur-vey, 1988-94. Reference manuals and reports (CD ROM). In US Department of Health and Human Services National Center for Health Statistics Hyattsville, MD: Center for Disease Control and Prevention ; 1996.
15. Valadian I, Porter D: Physical growth and development from
conception to maturity. In Little, Brown & Company Boston ;
1977:280.
16. Body Measurements (Anthropometry). Westat Inc National
Health and Nutrition Examination Survey III National Center for Health Statistics 1996.
17. Winkleby MA, Robinson TN, Sundquist J, Kraemer HC: Ethnic var-iation in cardiovascular disease risk factors among children and young adults: findings from the Third National Health
and Nutrition Examination Survey, 1988-1994. Jama 1999,
281(11):1006-1013.
18. Borrell LN, Diez Roux AV, Rose K, Catellier D, Clark BL: Neigh-bourhood characteristics and mortality in the
Atherosclero-sis Risk in Communities Study. Int J Epidemiol 2004,
33(2):398-407.
19. Crews DJ, Lochbaum MR, Landers DM: Aerobic physical activity effects on psychological well-being in low-income Hispanic
children. Percept Mot Skills 2004, 98(1):319-324.
20. Devroey D, Kartounian J, Vandevoorde J, Betz W, Cogge M, De Man B, De Ridder L, Block P, Van Gaal L: Primary prevention of coro-nary heart disease in general practice: a cross sectional
pop-ulation study. Int J Clin Pract 2004, 58(2):130-138.
21. Obisesan TO, Vargas CM, Gillum RF: Geographic variation in stroke risk in the United States. Region, urbanization, and hypertension in the Third National Health and Nutrition
Examination Survey. Stroke 2000, 31(1):19-25.
22. SAS Institute Inc. SAS/STAT User's Guide, version 6, fourth
edition. Cary NC: SAS Institute Inc. .
23. Shah BV, Barnwell BG, Bieler GS: SUDAAN Software for the Sta-tistical Analysis of Correlated Data User's Manual Release 7.0. Research Triangle Park. North Carolina: Research Triangle Institute ; 1996.
24. Lawn RM: Lipoprotein(a) in heart disease. Sci Am 1992, 266(6):54-60.
25. Scanu AM: Lp(a) lipoprotein--coping with heterogeneity. N Engl J Med 2003, 349(22):2089-2090.
26. Marcovina SM, Koschinsky ML: Evaluation of lipoprotein(a) as a
prothrombotic factor: progress from bench to bedside. Curr
Opin Lipidol 2003, 14(4):361-366.
27. Moliterno DJ, Jokinen EV, Miserez AR, Lange RA, Willard JE, Boerwin-kle E, Hillis LD, Hobbs HH: No association between plasma lipo-protein(a) concentrations and the presence or absence of
coronary atherosclerosis in African-Americans. Arterioscler
Thromb Vasc Biol 1995, 15(7):850-855.
28. Kamboh MI, Rewers M, Aston CE, Hamman RF: Plasma apolipo-protein A-I, apolipoapolipo-protein B, and lipoapolipo-protein(a) concentra-tions in normoglycemic Hispanics and non-Hispanic whites
from the San Luis Valley, Colorado. Am J Epidemiol 1997,
146(12):1011-1018.
29. Haffner SM, Gruber KK, Morales PA, Hazuda HP, Valdez RA, Mitchell BD, Stern MP: Lipoprotein(a) concentrations in Mexican Americans and non-Hispanic whites: the San Antonio Heart
Study. Am J Epidemiol 1992, 136(9):1060-1068.
30. Srinivasan SR, Dahlen GH, Jarpa RA, Webber LS, Berenson GS: Racial (black-white) differences in serum lipoprotein (a) dis-tribution and its relation to parental myocardial infarction in
children. Bogalusa Heart Study. Circulation 1991, 84(1):160-167.
31. Dixon LB, Shannon BM, Tershakovec AM, Bennett MJ, Coates PM, Cortner JA: Effects of family history of heart disease, apolipo-protein E phenotype, and lipoapolipo-protein(a) on the response of
children's plasma lipids to change in dietary lipids. Am J Clin
Nutr 1997, 66(5):1207-1217.
32. Kimm SY, Pasagian-Macaulay A, Aston CE, McAllister AE, Glynn NW, Kamboh MI, Ferrell RE: Correlates of lipoprotein(a) levels in a biracial cohort of young girls: the NHLBI Growth and Health
Study. J Pediatr 1999, 135(2 Pt 1):169-176.
33. Scholz M, Kraft HG, Lingenhel A, Delport R, Vorster EH, Bickeboller H, Utermann G: Genetic control of lipoprotein(a)
concentra-tions is different in Africans and Caucasians. Eur J Hum Genet
1999, 7(2):169-178.
34. Mooser V, Scheer D, Marcovina SM, Wang J, Guerra R, Cohen J, Hobbs HH: The Apo(a) gene is the major determinant of
var-iation in plasma Lp(a) levels in African Americans. Am J Hum
Genet 1997, 61(2):402-417.
35. Barkley RA, Brown AC, Hanis CL, Kardia SL, Turner ST, Boerwinkle E: Lack of genetic linkage evidence for a trans-acting factor having a large effect on plasma lipoprotein[a] levels in
Afri-can AmeriAfri-cans. J Lipid Res 2003, 44(7):1301-1305.
36. Kraft HG, Lingenhel A, Pang RW, Delport R, Trommsdorff M, Ver-maak H, Janus ED, Utermann G: Frequency distributions of apol-ipoprotein(a) kringle IV repeat alleles and their effects on lipoprotein(a) levels in Caucasian, Asian, and African
popu-lations: the distribution of null alleles is non-random. Eur J
Hum Genet 1996, 4(2):74-87.
37. Dube N, Voorbij R, Leus F, Gomo ZA: Lipoprotein(a) concentra-tions and apolipoprotein(a) isoform distribution in a
Zimba-bwean population. Cent Afr J Med 2002, 48(7-8):83-87.
38. Bovet P, Rickenbach M, Wietlisbach V, Riesen W, Shamlaye C, Darioli R, Burnand B: Comparison of serum lipoprotein(a) distribution and its correlates among black and white
populations. Int J Epidemiol 1994, 23(1):20-27.
39. Taimela S, Viikari JS, Porkka KV, Dahlen GH: Lipoprotein (a) levels in children and young adults: the influence of physical
activ-ity. The Cardiovascular Risk in Young Finns Study. Acta
Paediatr 1994, 83(12):1258-1263.
40. Dirisamer A, Widhalm K: Lipoprotein(a) as a potent risk
indica-tor for early cardiovascular disease. Acta Paediatr 2002,
91(12):1313-1317.
41. Wassef N, Sidhom G, Zakareya el K, Mohamed el K: Lipoprotein(a)
in android obesity and NIDDM. Diabetes Care 1997,
20(11):1693-1696.
42. Rewers M, Hamman RF: Risk factors for non-insulin-dependent diabetes. In Diabetes in America. Bethesda, Maryland, National Institutes of Health ; 1995:179-220.
43. Koschinsky ML, Marcovina SM: The relationship between
lipo-protein(a) and the complications of diabetes mellitus. Acta
Diabetol 2003, 40(2):65-76.
44. Jones JL, Kruszon-Moran D, Wilson M, McQuillan G, Navin T, McAu-ley JB: Toxoplasma gondii infection in the United States: