R E S E A R C H
Open Access
Buccal mucosa micronuclei counts in
relation to exposure to low dose-rate
radiation from the Chornobyl nuclear
accident and other medical and
occupational radiation exposures
D. Bazyka
1, S. C. Finch
2, I. M. Ilienko
1, O. Lyaskivska
1, I. Dyagil
1, N. Trotsiuk
1, N. Gudzenko
1, V. V. Chumak
1,
K. M. Walsh
3, J. Wiemels
4, M. P. Little
5*and L.B. Zablotska
6Abstract
Background:Ionizing radiation is a well-known carcinogen. Chromosome aberrations, and in particular micronuclei represent an early biological predictor of cancer risk. There are well-documented associations of micronuclei with ionizing radiation dose in some radiation-exposed groups, although not all. That associations are not seen in all radiation-exposed groups may be because cells with micronuclei will not generally pass through mitosis, so that radiation-induced micronuclei decay, generally within a few years after exposure.
Methods:Buccal samples from a group of 111 male workers in Ukraine exposed to ionizing radiation during the cleanup activities at the Chornobyl nuclear power plant were studied. Samples were taken between 12 and 18 years after their last radiation exposure from the Chornobyl cleanup. The frequency of binucleated micronuclei was analyzed in relation to estimated bone marrow dose from the cleanup activities along with a number of environmental/occupational risk factors using Poisson regression adjusted for overdispersion.
Results:Among the 105 persons without a previous cancer diagnosis, the mean Chornobyl-related dose was 59.5 mSv (range 0–748.4 mSv). There was a borderline significant increase in micronuclei frequency among those reporting work as an industrial radiographer compared with all others, with a relative risk of 6.19 (95% CI 0.90, 31.08, 2-sidedp= 0.0729), although this was based on a single person. There was a borderline significant positive
radiation dose response for micronuclei frequency with increase in micronuclei per 1000 scored cells per Gy of 3.03 (95% CI -0.78, 7.65, 2-sidedp= 0.1170), and a borderline significant reduction of excess relative MN prevalence with increasing time since last exposure (p= 0.0949). There was a significant (p= 0.0388) reduction in MN prevalence associated with bone X-ray exposure, but no significant trend (p= 0.3845) of MN prevalence with numbers of bone X-ray procedures.
(Continued on next page)
* Correspondence:mark.little@nih.gov
5Division of Cancer Epidemiology and Genetics, National Cancer Institute,
National Institutes of Health, Department of Health and Human Services, Radiation Epidemiology Branch, Room 7E546, 9609 Medical Center Drive, Bethesda, MD 20892-9778, USA
Full list of author information is available at the end of the article
(Continued from previous page)
Conclusions:There are indications of increasing trends of micronuclei prevalence with Chornobyl-cleanup-associated dose, and indications of reduction in radiation-Chornobyl-cleanup-associated excess prevalence of micronuclei with time after exposure. There are also indications of substantially increased micronuclei associated with work as an industrial radiographer. This analysis adds to the understanding of the long-term effects of low-dose radiation exposures on relevant cellular structures and methods appropriate for long-term radiation biodosimetry.
Keywords:Micronucleus, Ionizing radiation, Chornobyl, Chromosome aberrations, Radiography
Background
Ionizing radiation is a well-known carcinogen in humans, and a known clastogen leading to broken chromosomes. Chromosomal aberrations [1, 2] and more specifically for-mation of micronuclei (MN) in cell cytoplasm [3] could represent an early biological predictor of cancer risk. A cytological consequence of the induction of chromosome aberrations is the formation of MN that are observed in interphase cells as a result of a breakdown in repair of chromosomal breaks and general dysfunction of the chromosomal apparatus. MN originate from chromosome fragments or whole chromosomes that are not included in the main daughter nuclei during nuclear division [4–6]. MN rates in peripheral blood lymphocytes (PBL) are mod-erately rare, typically occurring at levels of 5–25 / 1000 cells [3] and at generally somewhat lower levels in the buc-cal mucosa, in the range 0.5–10 / 1000 cells [7, 8]. How-ever, despite their moderate rarity, binucleated cells can be easily observed and studied [5, 8]. MN rates generally in-crease with age [9], although this is not universally ob-served [10]. MN can also be affected by cigarette smoking [9] and ionizing radiation dose [10], with a complex de-pendence on radiation dose, radiation energy and dose rate [11–13]. Because cells with MN will not generally pass through mitosis, radiation-induced MN generally decay fairly rapidly (over a period of years) after exposure [14].
It has been suggested that MN are suitable for bio-monitoring genetic damage rates [5, 15, 16], in particular damage arising from ionizing radiation exposure, al-though this is rendered more difficult by the dependence of MN prevalence on age and cigarette smoking. Many studies have shown that the number of radiation-induced MN is strongly correlated with dose and quality of radiation [17–21]. The dose response for MN follow-ing a sfollow-ingle acute low LET radiation exposure is known to be strongly curvilinear (upward curving), although a more linear relationship is known for high LET radiation exposure [22]. After whole-body exposure with low lin-ear energy transfer (LET) radiation, doses down to 0.1 Gy can be detected [22].
Sari-Minodier et al. [4] evaluated the induction of MN in relation to occupational radiation exposure in a group of 132 exposed hospital workers and 69 controls,
adjusting for the possible confounding effects of gender, age, smoking status, familial cancer history and medical irradiation. They demonstrated more frequent MN in the exposed group compared with controls despite the very low levels of exposure (generally <5 mSv / year) [4]. Several studies have been conducted in Chornobyl-exposed children in Belarus, demonstrating elevated rates of MN compared to those from the control areas with little or no radiation exposure [16, 23, 24]. A study of MN in intact cells exposed to serum samples from Chornobyl cleanup workers in Belarus 20 years after ex-posure observed a significant elevation in MN counts, suggestive of clastogenic factors in their exposed serum which could induce instability [25]. It has been sug-gested that radiation is one of a number of agents capable of inducing such MN-associated instability [15].
The present study is aimed at evaluating MN in buccal cells in a group of liquidators (cleanup workers) follow-ing the Chornobyl accident, collected 16–18 years after exposure. We assess the frequency of MN in relation to various environmental and occupational risk factors, with particular emphasis on assessing excess MN associ-ated with radiation exposure from the Chornobyl accident, and possible modifications by age at exposure and the time between radiation exposure and buccal cell sampling.
Methods
Subjects
Information about the influence of environmental fac-tors other than Chornobyl radiation, habits, and thera-peutic and diagnostic radiological procedures was collected via a special questionnaire [29]. During inter-view, study participants were asked to donate buccal cell samples. The majority of those who agreed were controls previously involved in case-control studies [26, 27], but a small number of cases (n = 3) also agreed to donate buccal cell samples. The National Research Center for Radiation Medicine (NRCRM) in Kyiv and University of California San Francisco (UCSF) Institutional Review Boards approved this study. Before enrollment, each pa-tient gave written informed consent.
Collection of buccal cell samples for MN analysis.
Exfoliated buccal cells were obtained from the study subjects between November 2002 and March 2004, i.e., 16 to 18 years after the Chornobyl accident. After sign-ing the consent form, commercial “Scope” mouthwash from a plastic container was vigorously swished by the subject in their mouth for 45 s. The throat was not cleared or gargled during the procedure. The mouth-wash was then expectorated back into the container which was held close to the mouth. The containers were then tightly sealed and sent back to NRCRM within 24 h of the sample collection. The mouthwash samples were transferred to a 15 ml conical tube and centrifuged at 1500 x g for 15 min. The supernatant was decanted, and the cell pellet was resuspended in 3 ml of TE buffer so-lution [Tris-EDTA (100 x concentration; pH 8.0) in diethylpyrocarbonate (DEPC) treated water; 1:100 solu-tion]. The 3 ml suspension of cells was distributed into cryovials and stored at -80C. The cells were re-suspended, dropped onto slides and dried at room temperature, and staining solution added, consisting of 10 ml of 0.5% propidium iodide in phosphate-buffered saline (PBS) containing 10% Glycerol. We assess the ad-vantages of this method of buccal cell sampling in com-parison with phlebotomy-derived PBL and cytobrush-exfoliated buccal cell samples in the Discussion.
Because of a priori doubts as to the effect of prior chemo-therapy and radiochemo-therapy, most analyses (Tables 1, 2 and 3, Fig. 1) exclude 6 persons recorded as having a previous tumor, the three persons reporting treatment for radiother-apy or chemotherradiother-apy for cancer (one person reporting both types of therapy), and the three leukemia cases known from a previous study [27]. Exclusion of these 6 case resulted in an analysis dataset of 105 persons. However, we also pro-vide in Appendix 2 Tables 8 and 9 certain analyses with these 6 individuals included.
Microscopy
Slides each containing 1000 binucleated cells were scored for micronuclei via oil immersion light microscopy with
900× (40 × 15 × 1.5) magnification. Binucleated cells were scanned and the number of cells with micronuclei was counted. The slides were randomized and coded so that the scorer was not aware of subject ID or dose. The cri-teria for selecting binucleated cells to score are the following:
a) binucleated cells with main nuclei that are separate and of approximately equal size;
b) main nuclei that touch and even overlap as long as nuclear boundaries can be distinguished; and
c) main nuclei that are linked by nucleoplasmic bridges.
Not scored cells included: trinucleated, quadronu-cleated, or other multinucleated cells.
Dosimetry
A time-and-motion method of retrospective dose recon-struction in cleanup workers, known as RADRUE, was developed for the Leukemia Study and for a similar study conducted in Belarus, Russia, and Baltic countries [30] by an international group of scientists including ex-perts from Belarus, France, Russia, the United States, and Ukraine [31, 32]. The method used combined data on work history from dosimetric questionnaires with field radioactivity measurements to estimate individual bone marrow doses for all study subjects. In-person terviews were conducted by trained interviewers and in-cluded questions concerning locations of work and residence while in the 30-km exclusion zone around the Chornobyl nuclear power plant, types of work, transpor-tation routes, and corresponding dates. All study sub-jects were necessarily alive at the time of buccal cell sampling and the associated interview, so that there is not the complication of use of proxy subjects that previ-ous analyses of the underlying case-control dataset have faced [26, 27]. Our analyses were based on the cumula-tive doses derived as the sums of the arithmetic means of the annual 1986–1990 bone marrow doses estimated by generating 10,000 realizations of dose predictions from RADRUE [31].
Statistical methods
To evaluate the relationship between cumulative esti-mated dose and MN, we fitted an additive model, linear-exponential in dose, in which the expected number of MN for individualiwas given by:
μi¼Scoredi exp X
l¼1 N
γlZil
" #
þαDiexp½βDi !
ð1Þ
where Scoredi is the number of whole scored cells, Zil
ð ÞN
Table 1Influence of various potentially hazardous factors on micronuclei (MN) counts (after exclusion of 6 cancer cases)
Number % Translocation rate
Mean MN / 1000 scored
SD p-value heterogeneity
Dose (mGy) 0–19 62 59.0 3.91 5.78 0.4556
20–99 29 27.6 3.48 4.32
100–249 4 3.8 8.50 11.21
250–499 7 6.7 4.95 4.11
≥500 3 2.9 3.67 0.58
Age at buccal sample (years) 40–49 19 18.1 4.21 7.08 0.7758
50–59 32 30.5 3.40 4.98
60–69 38 36.2 5.12 5.61
≥70 16 15.2 2.48 3.67
Years since last exposure < 12 12 10.8 4.00 5.03 0.6956
12–13 34 30.6 5.04 6.74
≥14 57 51.4 3.45 4.77
Unknown 2 1.8 3.50 4.95
Days of active work in Chornobyl exclusion zone 0 NA NA NA NA 0.7813
1–29 19 17.1 3.30 4.40
30–59 45 40.5 3.87 5.36
60–89 20 18.0 6.03 7.89
90–179 14 12.6 3.47 3.53
≥180 7 6.3 2.48 3.21
Smoking status Never smoker/missing 40 38.1 3.85 5.85 0.3187
Former and current smokers
65 61.9 4.14 5.30
Alcohol consumption status Never drinker/missing 24 22.9 3.82 6.50 0.6585
Former and current drinkers
81 77.1 4.09 5.20
Work as industrial radiographer Never 101 96.2 4.03 5.45 0.0516
Ever 1 1.0 15.00 0.00
Unknown 3 2.9 0.33 0.58
Work with potential radiation exposure (other than Chornobyl)
Never 90 85.7 4.27 5.71 0.5483
Ever 14 13.3 2.74 3.89
Unknown 1 1.0 1.00 0.00
Work in nuclear industry (including Chornobyl NPP) Never 97 92.4 4.18 5.67 0.1794
Ever 5 4.8 3.27 0.83
Unknown 3 2.9 0.33 0.58
Work in army with potential radiation exposure (excluding Chornobyl)
Never 98 93.3 4.28 5.60 0.0307
Ever 5 4.8 0.60 0.89
Unknown 2 1.9 0.50 0.71
Work with potential radiation exposure (excluding Chornobyl)
Never 100 95.2 4.18 5.57 0.2626
Ever 3 2.9 1.33 2.31
Unknown 2 1.9 0.50 0.71
Radiotherapy for conditions other than cancer Never 103 98.1 4.04 5.52 0.3920
Ever 1 1.0 6.67 0.00
Table 1Influence of various potentially hazardous factors on micronuclei (MN) counts (after exclusion of 6 cancer cases)(Continued)
Any dental X-rays Never 43 41.0 4.23 6.11 0.1709
Ever 62 59.0 3.89 5.06
Any chest X-rays Never 53 50.5 3.42 5.52 0.4753
Ever 50 47.6 4.71 5.51
Unknown 2 1.9 3.33 4.71
Any bone X-rays Never 57 54.3 4.51 6.37 0.3192
Ever 47 44.8 3.54 4.22
Unknown 1 1.0 0.00 0.00
X-rays other than dental, chest, bone Never 73 69.5 3.65 5.58 0.0776
Ever 31 29.5 5.06 5.27
Unknown 1 1.0 0.00 0.00
Total 105 100.0 4.03 5.49
Heterogeneityp-values are adjusted for overdispersion
Table 2Relative risk of various non-Chornobyl radiation-related factors on risk of micronucleus prevalence (after exclusion of 6 can-cer cases)
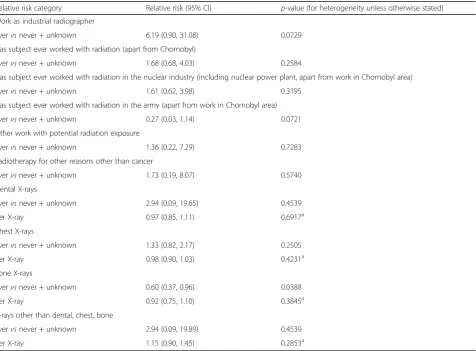
Relative risk category Relative risk (95% CI) p-value (for heterogeneity unless otherwise stated) Work as industrial radiographer
Evervsnever + unknown 6.19 (0.90, 31.08) 0.0729
Has subject ever worked with radiation (apart from Chornobyl)
Evervsnever + unknown 1.68 (0.68, 4.03) 0.2584
Has subject ever worked with radiation in the nuclear industry (including nuclear power plant, apart from work in Chornobyl area)
Evervsnever + unknown 1.61 (0.62, 3.98) 0.3195
Has subject ever worked with radiation in the army (apart from work in Chornobyl area)
Evervsnever + unknown 0.27 (0.03, 1.14) 0.0721
Other work with potential radiation exposure
Evervsnever + unknown 1.36 (0.22, 7.29) 0.7283
Radiotherapy for other reasons other than cancer
Evervsnever + unknown 1.73 (0.19, 8.07) 0.5740
Dental X-rays
Evervsnever + unknown 2.94 (0.09, 19.65) 0.4539
per X-ray 0.97 (0.85, 1.11) 0.6917a
Chest X-rays
Evervsnever + unknown 1.33 (0.82, 2.17) 0.2505
per X-ray 0.98 (0.90, 1.03) 0.4231a
Bone X-rays
Evervsnever + unknown 0.60 (0.37, 0.96) 0.0388
per X-ray 0.92 (0.75, 1.10) 0.3845a
X-rays other than dental, chest, bone
Evervsnever + unknown 2.94 (0.09, 19.89) 0.4539
per X-ray 1.15 (0.90, 1.45) 0.2853a
Allp-values relate to improvement in fit of the model with the specific variable added, adjusted for the set of background variables that minimize Akaike Information Criterion (AIC) (as inAppendix 1Table 7) (with that variable omitted if already included in the optimal background model). Heterogeneityp-values and confidence intervals are adjusted for overdispersion
a
exposure, diagnostic X-rays etc), andDiis the total
buc-cal dose (in Gy), derived from questionnaire-assessed Chornobyl-related exposure (via RADRUE). The linear-exponential form of dose response used in model (1) is a standard one in analysis of radiobiological data [33], with the linear term αDi representing the MN induction
ef-fect, and the exponential term exp[βDi] representing a
sterilization effect. We also fitted a model for the relative MN rate, again linear-exponential in dose:
μi¼Scorediexp X
l¼1 N
γlZil
" #
1þαDiexp½βDi
ð Þ ð2Þ
Exposure to various medical and occupational risk fac-tors was qualitatively assessed, and taken into account in the regression model via the terms ð ÞZil Nl¼1. In order to
adequately fit MN prevalence taking account of all factors other than radiation, we considered variables taken from a candidate set of variables that included
Table 3Regression analysis of radiation-associated absolute and relative risk of micronucleus prevalence (after exclusion of 6 cancer cases)
Model number Linear term for absolute risk (α) model (/1000 Scored cells /Gy)
Linear term for relative risk (α) (/Gy) Exponential term (β) (/Gy) Deviance (df) p-value
AIC-minimizing background model (no dose term)
1 - - - 106.04 (75)
Absolute risk model in dose (1), background adjusted using AIC-minimizing model
2 3.03 (−0.78a, 7.65) - 102.56 (74) 0.1170b
3 0.71 (−3.05a, 16.40) - 2.51 (−5.36, 11.05a) 102.10 (73) 0.5710c
Relative risk model in dose (2), background adjusted using AIC-minimizing model
4 - 1.19 (−0.49, 3.93) - 103.60 (74) 0.1902b
5 - 0.14 (−0.97a, 7.98) 4.27 (−8.36a, 16.89a) 102.67 (73) 0.4205d
Allp-values relate improvement in fit evaluated via anF-test. All models adjust for background variables that minimize Akaike Information Criterion (AIC), as in
Appendix 1Table 7. 2-sidedp-values and confidence intervals are adjusted for overdispersion
a
Wald-based CI
b
p-value of improvement in fit over null model in dose (model number 1)
c
p-value of improvement in fit over linear model in dose (model number 2)
d
p-value of improvement in fit over linear model in dose (model number 4)
various occupational (including Chornobyl-related), medical and other terms, some derived from a previous study of these workers [27], and polynomial terms in the (centered) age at buccal sampling, (agei−60.104)k, with
integralkbetween 1 and 8, given in Appendix 1 Table 6. Age at buccal sampling, agei, was centered at its mean
value, 60.104 years in the full sample, in order to im-prove the stability of parameter estimates. In order to avoid over-parameterized models, the Akaike Informa-tion Criterion (AIC) [34, 35] was employed to select the optimal subset of descriptive variables from this set. AIC penalizes against overfitting by adding 2 x [number of fitted parameters] to the model deviance. A mixed forward-backward stepwise algorithm was used to select the set of variables minimizing AIC, using R [36]. The indicated optimal models were augmented to make them polynomially complete in age at buccal sampling, so that if the optimal model included a variable (agei−60.104)k
for some index k, then all terms (agei−60.104)m for
in-dices 0≤m≤kwere also included in the model. The op-timal set of variables are given in Appendix 1 Table 7.
Additional models analogous to models (1) and (2) were also fitted, in which adjustment was made for the modifying effects of age at first exposure, ei, or time
be-tween last exposure and buccal cell sampling,ti, on the
radiation-associated absolute excess risk:
μi¼Scorediðexp X
l¼1 N
γlZil
þαDiexp
δðei−43:593Þ þϕðti−15:870ÞÞ ð3Þ
and the radiation-associated relative excess risk
μi¼Scorediexp X
l¼1 N
γlZil
" #
ð1þαDiexp½δðei−43:593Þ þϕðti−15:870ÞÞ
ð4Þ
The age at first exposure and time since last exposure variables were centered by subtracting their mean values,
43.593 years and 15.870 years among those without can-cer, respectively, in order to stabilize parameter esti-mates. [It should be noted that without a modifying effect of age (or other variables) in the background term,
exp P
l¼1
N γlZil
, precisely the same p-values and
esti-mates of these coefficients (δ,ϕ) would be obtained in the relative risk model (4) as with the additive model (3), a consequence of the algebraic equivalence of these models in this special case.] Tables 2, 3, 4 and 5 detail the model fits to the MN frequency data, via Poisson maximum likelihood, and associated parameter esti-mates. Because of indications of marked over-dispersion, in the analyses (Tables 1, 2, 3, 4 and 5) all p-values (which are 2-sided) are computed using F-tests, derived from quasi-likelihood techniques [37], and the square roots of the associated variance inflation factors (defined by ϕ=deviance/df) are used to scale profile-likelihood confidence intervals in the standard way, i.e., by multi-plying the distance of confidence limit to the best esti-mate by the square root of the inflation factor. Very similar estimates of the variance inflation factor derived in this way, which after adjustment for the background variables were about 1.4–1.5, were yielded by use of quasi-likelihood models in R [36], taking account of overdispersion [37]. Models were fitted using R [36] and Epicure [38]. Although all p-values are 2-sided, arguably 1-sided p-values (which would be about half the values given) are possibly more relevant for certain of the tests that we perform, given that one would expect MN prevalence only to increase with increasing dose. We emphasize in a few relevant places the two-sided nature of the relevant tests.
Results
Among the 105 persons without previous cancer the estimated mean Chornobyl-related bone marrow dose was 59.5 mSv (range 0–748.4 mSv) and the mean age at first exposure was 43.6 years (range 27.8–
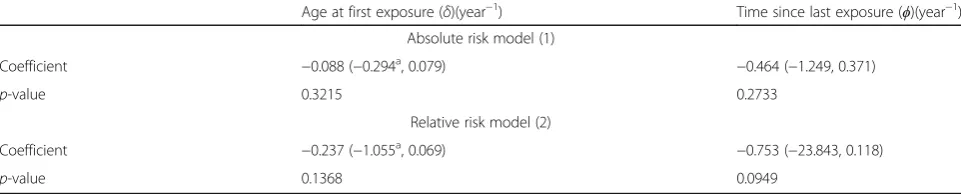
Table 4Regression analysis of modifying effect of age at first exposure and time since last exposure on absolute and relative radiation-associated excess risk of micronucleus prevalence (after exclusion of 6 cancer cases)
Age at first exposure (δ)(year−1) Time since last exposure (ϕ)(year−1)
Absolute risk model (1)
Coefficient −0.088 (−0.294a, 0.079)
−0.464 (−1.249, 0.371)
p-value 0.3215 0.2733
Relative risk model (2)
Coefficient −0.237 (−1.055a, 0.069)
−0.753 (−23.843, 0.118)
p-value 0.1368 0.0949
Allp-values relate improvement in fit of the model to a model without adjustment for the specific temporal effect (age at first exposure and time since last exposure), using models of the form considered in Tables2and3, evaluated via anF-test. All models adjust for background variables that minimize Akaike Information Criterion (AIC), as inAppendix 1Table 7.p-values and confidence intervals are adjusted for overdispersion
a
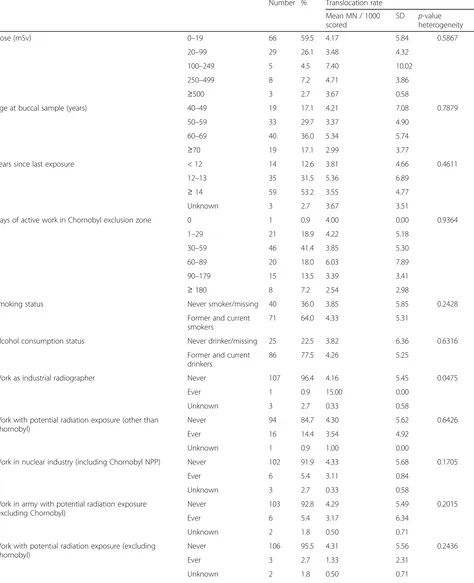
63.0 years). Among the same group with information on years since last exposure, the mean years since last exposure was 15.9 years (range 12.4–17.8 years). There are variations of MN prevalence with days of active work in the Chornobyl exclusion zone, being particularly high among those working 50–99 days, by type of work as a cleanup worker, and among those 25 persons in military occupations (Table 1). Minim-izing AIC led to inclusion of 11 variables, providing a parsimonious model of underlying MN prevalence that includes a 5th order polynomial in age at buccal sample (Appendix 1 Table 7).
Table 2 demonstrates that there is a borderline sig-nificant increase in MN frequency among those reporting work as an industrial radiographer, with a relative risk of 6.19 (95% CI 0.90, 31.08, p = 0.0729). There are weak indications of increased MN fre-quency associated with radiation work apart from Chornobyl, or with radiation work in the nuclear in-dustry, with relative risks of 1.68 (95% CI 0.68, 4.03, p = 0.2584), and 1.61 (95% CI 0.62, 3.98, p = 0.3195), respectively (Table 2), although there was a borderline significant reduction in MN prevalence among those reporting radiation work in the army, with a relative risk of 0.27 (95% CI 0.03, 1.14, p = 0.0721) (Table 2). There was a significant decrease in numbers of MN among those reporting bone X-rays, with a relative risk of 0.60 (95% CI 0.37, 0.96, p = 0.0388), although there were only weak indications of a (negative) trend with numbers of bone X-rays (p = 0.3845) (Table 2).
Table 3 demonstrates that after adjustment for some of these variables, there are borderline significant
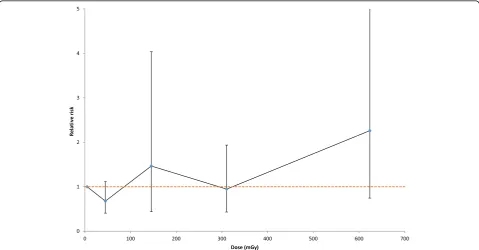
indications of a positive Chornobyl-related radiation dose response for the absolute risk of MN of 3.03 MN per 1000 scored cells per Gy (95% CI -0.78, 7.65, 2-sided p = 0.1170); there is somewhat weaker evidence of such trends using a relative risk model (2-sided p = 0.1902). There was some elevation of MN in a group exposed to intermediate levels of dose, 100–250 mGy, also at higher levels of dose, 500 + mGy (Fig. 1, Table 1). There is no evidence of a linear-exponential dose response, whether using absolute or relative risk models (p = 0.5710, p = 0.4205, respectively, Table 3).
Table 4 demonstrates that there was a borderline significant reduction of excess relative MN prevalence with increasing time since last exposure (p = 0.0949), and there are somewhat weaker indications (p = 0.2733) of a reducing trend in absolute excess MN prevalence with increasing time since last expos-ure. Variations of radiation-associated MN prevalence with age at first exposure are somewhat weaker, whether using relative risk or absolute risk models (p = 0.1368, p = 0.3215, respectively). The modifying effect of time since last exposure, whether on relative or absolute risk, is notably large, ϕ=−0.753 year−1 or ϕ= −0.464 year−1, respectively. Table 5 demon-strates that there are only weak indications of signifi-cant modifying effects on the MN Chornobyl-related dose response by number of days of work, or by number of active days of work, in the Chornobyl ex-clusion zone, whether in relation to absolute (p = 0.2808, p = 0.2590, respectively) or relative risk (p = 0.1671, p = 0.2156, respectively) models. There
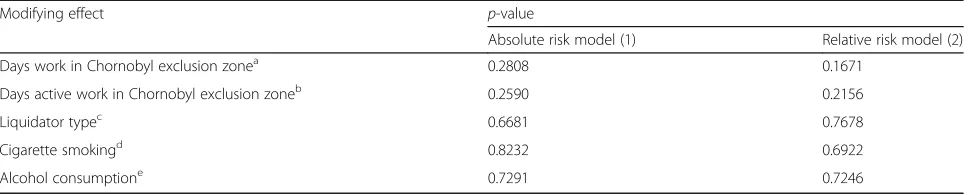
Table 5Regression analysis of modifying effect on radiation dose of days (active) work in the Chornobyl exclusion zone, liquidator type, cigarette smoking and alcohol consumption on absolute and relative excess risk of micronucleus prevalence data (after exclusion of 6 cancer cases)
Modifying effect p-value
Absolute risk model (1) Relative risk model (2)
Days work in Chornobyl exclusion zonea 0.2808 0.1671
Days active work in Chornobyl exclusion zoneb 0.2590 0.2156
Liquidator typec 0.6681 0.7678
Cigarette smokingd 0.8232 0.6922
Alcohol consumptione 0.7291 0.7246
Allp-values relate improvement in fit of a linear model in radiation dose without adjustment to the radiation term for the specific effect (days (active) work in Chornobyl exclusion zone, liquidator type, smoking consumption, alcohol consumption), using models of the form considered in Tables2,3and4, evaluated via anF-test. All models adjust for background variables that minimize Akaike Information Criterion (AIC), as inAppendix 1Table 7.p-values are adjusted for overdispersion
a
based on days work in Chornobyl exclusion zone treated as a categorical variable (unknown number of days or number < 30, days work≥30 and <90, days work≥90)
b
based on days active work in Chornobyl exclusion zone treated as a categorical variable (number of active days <30, active days work≥30 and <90, active days work≥90)
c
based on liquidator work treated as a categorical variable (unknown + early responders + firefighters + nuclear power workers, military personnel, drivers + construction workers)
d
based on cigarette smoking treated as a categorical variable (unknown smoking status or never smoker, 1–9 cigarettes per day,≥10 cigarettes per day)
e
are no indications of modifications of MN prevalence by type of liquidator, cigarette smoking, or alcohol consumption, whether in relation to absolute (p = 0.6681, p = 0.8232, p = 0.7291, respectively) or relative risk (p = 0.7678, p = 0.6922, p = 0.7246, respectively) (Table 5).
Analyses including the 6 individuals with cancer were not markedly different (Appendix 2 Tables 8 and 9).
Discussion
We observed a large and borderline significant (2-sided p = 0.0729) increase in MN frequency among those reporting work as an industrial radiographer, although this finding was based on a single case. We also observed borderline-significant indications of a positive Chornobyl-related radiation dose response for MN (2-sided p= 0.1170). There is a substantial and borderline signifi-cant (p = 0.0949) reduction of Chornobyl-dose-related relative prevalence with increasing time since last expos-ure. We observed a significant decrease in numbers of MN among those reporting bone X-rays (2-sided p = 0.0388), but there was no significant trend in MN prevalence with numbers of bone X-rays.
The MN assay using buccal cells is a minimally inva-sive method for studying DNA damage, chromosomal instability, cell death and the regenerative potential of human buccal mucosal tissue. This method is increas-ingly used in molecular epidemiological studies for in-vestigating the impact of nutrition, lifestyle factors, genotoxic exposure and genotype on DNA damage, chromosome mis-segregation and cell death. Although MN in buccal mucosa occur at a lower frequency than in PBL [3, 7, 8], there is no reason to exclude their use for this reason. Biologically one would expect the ex-cess MN to persist to the same relative extent in vari-ous tissues of the body, so that it is not unreasonable to examine any radiation-exposed tissue in the body, in particular the buccal mucosa, for this marker of exposure. Although there are some very high skin doses due to low energy beta emitters [39], in the Chornobyl liquidators “photon energy spectra varied from one location to another and from one time period to another but were generally centered be-tween 0.15 and 0.4 MeV” [32]. In the range of energy from 0.15 to 0.4 MeV, dose does not vary much with energy or from one organ/tissue to another [40]. Both blood and epithelial tissue are highly regenerative tis-sues with a continuous need for repopulation and a base of stem cells needed for lifetime renewal. Be-cause of the long time between exposure and sam-pling, the damage measured here is primarily of the buccal stem cells. The biomarkers measured in this assay have been associated with increased risk of ac-celerated ageing, cancer and neurodegenerative
diseases [41]. However, because cells with MN will not generally pass through mitosis, MN generally decay fairly rapidly, over a few years, after mutagenic exposure. In particular, there is human in vivo data demonstrating this. A study of a pregnant woman and her then in utero child, both heavily exposed (to several Gy) from an orphan 60Co source, demon-strated a progressive decline in MN in mother and daughter over the period from 41 days to 16 years after the accident [42]. This may also explain our generally null findings in relation to radiation expos-ure from the Chornobyl accident, last exposexpos-ure from which occurred between 12 and 18 years prior to buccal cell sampling. Although not statistically signifi-cant, there is a pronounced negative modifying effect of time since exposure on the association of MN with radiation dose (Table 4).
The excess of MN that we observed among those reporting work as industrial radiographers, with a rela-tive risk of 6.19 (95% CI 0.90, 31.08) (Table 2), should be compared with those in a study of Sari-Minodier et al. [43], who found a smaller, approximately two-fold, in-crease in a group of 29 radiographers compared with a group of 24 controls. The confidence intervals on our relative risks are wide, and so the relative risks in these two groups are statistically compatible despite these dis-parate point estimates.
Increases in MN frequency have been observed in some groups exposed to dental and other diagnostic X-rays procedures [7, 44], although not in many others [45–49]. In all these studies comparisons were made of MN within subjects before and shortly after (generally within a few days) of X-ray exposure. It is interesting that although negative for MN, the stud-ies of Ribeiro et al. [45, 47], Angelieri et al. [46, 49] and Lorenzoni et al. [48] showed increases in the cytotoxic endpoints of karrhyorexis, pyknosis, and karyolysis after X-ray exposure, suggesting a substan-tial degree of induced cell death among buccal mu-cosa. This may explain the reduced MN frequency that we observed, presumably a much longer time after bone X-ray exposure than in these earlier stud-ies. Unfortunately the cytotoxic endpoints considered in these earlier studies (karrhyorexis, pyknosis, and karyolysis) were not evaluated here. In addition to induced cell death of damaged mucosa, bone X-ray exposure may stimulate enhanced DNA repair as a hormetic effect [50].
during a 10-year period [4]. The effect was cantly greater in females than in males, and a signifi-cant correlation between age and MN rates was observed in females but not in males. There was no significant effect of cigarette smoking. A large study of 1392 radiation workers and 143 controls in China demonstrated increased MN prevalence at relatively low occupational radiation doses (~50 mSv equivalent dose), and variation of MN prevalence also with ex-posure time [51]. A significant excess prevalence (p < 0.001) of MN in PBL was observed in a group of 25 exposed male workers compared with a group of 25 age-matched controls, with borderline signifi-cant indications (p = 0.079) of an increasing dose response [52]; exposure occurred 32–41 years previ-ously. In PBL of patients receiving radiotherapy, MN yield increased with increasing equivalent dose and there was a general decline in MN yields with in-creasing length of follow-up, with considerable vari-ation between individuals [53]. Whether this variation reflects inter-individual differences in sus-ceptibility to radiation-induced DNA damage, or sim-ply inter-individual differences in ability to clear MN, is unknown. However, in the period from 19 to 75 months after treatment, seven of thirteen patients showed higher MN yields than their respective levels before radiotherapy, indicating the persistence of radiation-induced residual cytogenetic damage in some subjects [53]. Such differences could be influ-enced by numerous subject characteristics, including germline genetics. However, the relatively short inter-val between radiation exposure and sampling should be noted. Because we performed analysis a long time after radiation exposure (e.g., at least 12.4 years after exposure from the Chornobyl accident) we used vari-ous methods to attempt to increase the MN assay sensitivity, although we did not use the cytokinesis-block micronucleus test (CB-MNT) [54]. The main analysis assessed counts of binucleated cells, com-monly regarded as a type of cell with defective cyto-kinesis [8].
The method of alcohol-based mouthwash-expectorated buccal cell sampling that we employ is less commonly used than the cytobrush-exfoliated buccal cell collection method [9]. However, there have been a number of recent studies in the literature that use this method of mouthwash-mediated buccal cell collection, in particular those of Lum and Le Marchand [55], Garcia-Closas et al. [56], and Andrisin et al. [57]. As highlighted by Garcia-Closas et al. [56] and Lum and Le Marchand [55] the use of alcohol-based mouthwash has certain decisive advan-tages over cytobrush-exfoliated buccal cell collection in the proportion of high molecular weight DNA extracted and its stability, and the much lower proportion of
non-human (bacterial) DNA content. As shown by Andri-sin et al. [57] the method also produces samples with stable DNA content, that can be kept at room temperature for up to 90 days, unlike cytobrush-exfoliated buccal cell samples, that require processing within a matter of days; as shown by Walsh et al. [58] there is significant bacterial contamination on cytobrush-collected buccal samples within 4 days of sample collection. The method is also more accept-able to study subjects than PBL samples obtained via phlebotomy or cytobrush-exfoliated buccal cell collec-tion, being less invasive; it is also preferable to saline-mouthwash collected buccal samples because of the more agreeable aftertaste. Admittedly not all of these advantages of the mouthwash method matter here, since all samples were processed within a few days of collection. Also, as discussed in the Introduction the baseline frequency of MN produced by this method is lower than for PBL.
A refinement of the assay, using a pan-centromeric DNA probe labeling the centromeric region, discrimi-nates between centromere-negative MN (C-MN) and centromere-positive MN (C+MN). Significantly higher frequency of C-MN have been observed using this assay in a number of radiation-exposed groups exposed at relatively low levels of radiation dose (generally <100 mSv) [43, 59], also in an individual receiving a large (65 Gy) therapeutic dose [60]. The finding of sig-nificantly elevated MN prevalence in immortalized HPV-G cells exposed to serum samples from Chornobyl cleanup workers from Belarus some 20 years after ex-posure is of interest [25]. However, the study did not dir-ectly examine the rates of MN in the blood cells of the Belarus cleanup workers, but rather the effects of the soluble factors contained in sera from radiation-exposed subjects on human immortalized reporter cells treated with these sera, and as such is only tangentially relevant to the present study.
There has also been no demonstrated dose-related in-crease in MN frequency in the bone marrow cells of a small sample of Hiroshima atomic bomb survivors [63]. It is possible that the interval between exposure and sampling, about 5 years, may have contributed to this null finding. Interestingly, Oesterle and Finch observed internuclear bridges in the marrow smears in a large proportion of the heavily exposed (>3 Gy) survivors, and a substantial excess karyomere frequency in a group exposed to even larger doses (> 6 Gy) [63].
Bone marrow doses were estimated here by the RADRUE method [28]. RADRUE has been subject to ex-tensive validation, in particular with thermoluminescent dosimetry (TLD) badges worn by certain reliably film-badged groups of workers (AC-605 liquidators), and various biological dosimeters, in particular electron paramagnetic resonance (EPR) in teeth and fluorescence in situ hybridization (FISH) in peripheral blood lympho-cytes, as documented in the report of Kryuchkov et al. [32]. Although RADRUE dose estimates would not be biased, nevertheless there are considerable uncertainties in RADRUE doses, which have been estimated to have mean geometric standard deviation (GSD) about 1.9; the GSD was considerably higher, 4–6, when the subject was deceased and a proxy had to be used, but this is not rele-vant here, because all study subjects were alive at the time of interview [32]. These errors are of complex form, very likely a mixture of Berkson and classical type [64]. Classical dose errors would be expected to bias trends with dose towards the null; Berkson-type errors would not bias dose response trends, but would inflate the as-sociated confidence intervals [64, 65].
Genome sequencing has uncovered a new mutational phenomenon called chromothripsis, characterized by extensive genomic rearrangements and an oscillating pattern of DNA copy number levels, all restricted to a few chromosomes. Using a combination of live-cell imaging and single-cell genome sequencing, Zhang et al. [66] demonstrated that MN formation can generate a spectrum of genomic rearrangements, some of which re-capitulate known features of chromothripsis. These events are restricted to the mis-segregated chromosome and occur within one cell division. Zhang et al. [66] demonstrated that the mechanism for chromothripsis may involve the fragmentation and subsequent reassem-bly of a single chromatid from a MN. Chromothripsis has been linked with proton beam irradiation in vitro [67] and has also been shown to drive telomerase reacti-vation in CLL [68], the most common cancer experi-enced by Chornobyl cleanup workers.
In our study buccal cells rather than PBL have been used, but as above the only complication this is likely to introduce is the somewhat lower prevalence of MN. The study has some limitations. The dose from
Chornobyl-related exposure was derived from questionnaire-based assessments, using RADRUE, and all other information relating to occupational and medical exposure was also questionnaire-derived. There was no assessment of radi-ation dose from radiotherapy or from other sources, nor was there any assessment made of the timing of the medical procedures and types of occupational exposure. The design of the questionnaire given to the study sub-jects made it impossible to determine the sequence of exposure of ionizing radiation and the possible con-founding factors. That said, since we found no effect of any other occupational or medical factor, it is perhaps unlikely that there would be confounding due to these factors. Fourteen subjects had evidence of treatment for cancer, but exclusion of these made no difference to in-ference on dose response. This study gives no answer to the question of whether previous low-dose radiation ex-posure could change DNA susceptibility to chemo- or radiotherapy and elongate the time of damage persist-ence, that might be revealed by the MN assay.
As well as the long time interval between Chornobyl-related radiation exposure and buccal cell sampling, an-other factor that must be considered is the generally modest levels of radiation dose. The mean dose in the present study was 59.5 mSv, with a maximum dose of 748.4 mSv. Data from an experiment involving ex vivo
60
Co-gamma irradiation of fibroblasts suggests that the minimal dose at which an elevated level of MN can be observed is about 200–250 mGy, minimally dependent on age [69]; only 10 of our cases had doses in excess of 250 mSv (Table 1, Appendix 1 Table 6). Set against that, a number of occupationally radiation-exposed groups observed increases in MN at levels of dose somewhat lower than the present study [4, 51]. A more detailed in-vestigation of our results is still needed. Quantification of the precise dose-response relationship between MN levels and radiation dose in in vitro models could inform future studies in humans. However, to be most germane, such studies must also assess the effects of various time intervals between radiation exposure and cell sampling.
Conclusions
Appendix 1
Table 6Candidate variables used for minimizing Akaike Information Criterion (AIC), via step-AIC algorithm
Variable Description
first period of first mission to the Chornobyl zone
days_act duration of active work in the Chornobyl zone in days
Case_leuk case of leukemia in the study of Zablotska et al. 2013
Year_first_exposed year first exposed via work in Chornobyl exclusion zone (calculated from dose record)
Year_last_exposed year last exposed via work in Chornobyl exclusion zone (calculated from dose record)
proxya proxy interviews
proxy_str proxy status based on the cases status in the set
number1 number of missions
first_year year first exposed via work in Chornobyl exclusion zone
duration total duration of work in the Chornobyl zone in months
duration_act duration of active work in the Chornobyl zone in months
days total duration of work in the Chornobyl zone in days
tse time since first exposure in the zone until diagnosis (for cases) and reference time (for controls) in years; tse < 0 (n= 4) is set to 0 radiation non-Chornobyl work with radiation exposure
industry work in hazardous industries
oil oil or chemical industry
chemical non-Chornobyl work with hazardous chemicals
petroleum work in petroleum industry
pesticides work with pesticides
solvents work with solvents
other_chemical work with hazardous chemicals other than in petroleum industry/pesticides/solvents
age age at diagnosis (for cases) and age at reference date (for controls)
age_x age at first exposure in the zone
subtypea subtype of leukemia
subtypeclla CLL subtype
subtypecll_str CLL subtype, based on the case status, matching controls set to case status
y_dxa year of diagnosis; for controls set to−1
reference reference year set to year of diagnosis (for cases) and for controls is the same as for matched case
y_int year of interview
liqtype type of work performed in the Chornobyl zone during the first mission
flag1 additional controls re-distributed among cases
flag2 controls used in risk analysis for Phase I but now matched to their original case used in set Phase II
flag_definite certainty in the leukemia diagnosis (definite + probable/other)
Phase study phase (phase I/phase II)
COM1_EXP1 dosimetry expert’s opinion about the quality of interview during the 1st mission to the 30-km exclusion zone
COM2_EXP1 dosimetry expert’s opinion about the quality of interview during the 2nd mission to the 30-km exclusion zone
COM3_EXP1 dosimetry expert’s opinion about the quality of interview during the 3rd mission to the 30-km exclusion zone
QUES1 interviewer’s opinion on the quality of questionnaire: Did subject reply with interest?
QUES2 interviewer’s opinion on the quality of questionnaire: Did the worker remember his job in the 30-km exclusion zone?
Liquid clean-up worker with data on interviewer’s opinion about the quality of interview
Exp expert dosimetrist who prepared dosimetric questionnaire for input into RADRUE
Table 6Candidate variables used for minimizing Akaike Information Criterion (AIC), via step-AIC algorithm(Continued)
seta cases with direct interviews
t11a if time_int_ch≠99 and time_int_ch≠ −1 and cases = 1 and proxy = 0 and−1≤time_int_ch≤1 then t11 = 1;else t11 = 0;
t1515a if time_int_ch≠99 and time_int_ch≠ −1 and cases = 1 and proxy = 0 and−1.5≤time_int_ch≤1.5 then t1515 = 1;else t1515 = 0;
t12a if time_int_ch≠99 and time_int_ch≠ −1 and cases = 1 and proxy = 0 and−1.0≤time_int_ch≤2.0 then t12 = 1;else t12 = 0;
t22 if time_int_ch≠99 and time_int_ch≠ −1 and cases = 1 and proxy = 0 and−2.0 < time_int_ch < 2.0 then t22 = 1; else t22 = 0
liqtype_recode type of work performed in the Chornobyl zone during the first mission recoded (from liqtype) (missing/early responders & firefighters/professional nuclear power workers/military personnel/drivers & construction workers)
num_miss number of missions to the Chornobyl exclusion zone
rad_exp study subject ever worked with radiation (other than the time the study subject spent in the Chornobyl area)
rad_radiography study subject ever worked with radiation as industrial radiographer (other than time study subject spent in the Chornobyl area)
rad_nuclear study subject ever worked with radiation in the nuclear industry (including NPP, other than time the study subject spent in the Chornobyl area)
rad_army study subject ever worked with radiation in army service (other than time the study subject spent in the Chornobyl area)
rad_other study subject ever worked with radiation other than in army/nuclear industry/industrial radiography (other than time the study subject spent in the Chornobyl area)
haz_exp study subject ever worked in a hazardous industry (specific types of chemical/electrical/road-building/other)
haz_chem study subject worked in chemical industry/oil industry (hazardous industry)
haz_el study subject worked in electrical industry (hazardous industry)
haz_road study subject worked in road-building industry (hazardous industry)
haz_other study subject worked in one of coal mining/military service/metallurgical industry/welding/gas equipment/other hazardous industries (hazardous industry)
chem_exp Has the study subject ever worked with hazardous chemicals?
chem_petrol study subject worked with petrol (petrol and agricultural pesticides/petrol and organic solvents)
chem_pest study subject worked with agricultural pesticides (petrol and agricultural pesticides/agricultural pesticides and organic solvents/ agricultural pesticides and other)
chem_solva study subject worked with organic solvents (petrol and organic solvents/agricultural pesticides and organic solvents)
chem_other study subject worked with hazardous chemical other than petroleum/agricultural pesticides/organic solvents
Oblast Dnipropetrovsk/Kyiv oblast/Kharkiv/Cherkassy/Chernihiv/Kyiv-city
Educ level of education of interviewee (8 years or less school/high school/trade school/higher education)
Urban Type of settlement (city/village/other)
radtxa Has the study subject had radiotherapy for cancer treatment
chemotxa Has study subject had chemotherapy for cancer treatment
radtx_other Has the study subject ever received radiotherapy for medical conditions other than cancer
x_dental Has study subject ever had dental X-ray?
x_dental_n Number of times study subject has had dental X-ray
x_bone Has interviewee ever had bone X-ray?
x_bone_n Number of times interviewee has had bone X-ray?
x_chest Has study subject ever had chest X-ray (except fluoroscopy)
x_chest_n Number of times study subject ever had chest X-ray (except fluoroscopy)
x_other Has the interviewee ever had other X-ray examinations (than bone, chest, dental)?
x_other_n How many times interviewee had any other type (than bone, chest, dental) of X-ray examination?
fam_cancer Have any of interviewee’s relatives had any solid cancer or leukemia (mother or father, or other relative)?
a
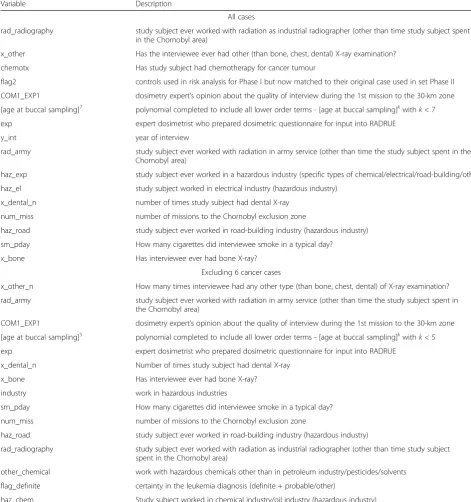
Table 7Optimal variable set, minimizing Akaike Information Criterion (AIC), fitted to data excluding any cancers (radtx≠1 AND chemotx≠1 AND Case_leuk = 0)(6 persons excluded) or in complete database. In either case variables are shown in order of selection into the final optimal model
Variable Description
All cases
rad_radiography study subject ever worked with radiation as industrial radiographer (other than time study subject spent in the Chornobyl area)
x_other Has the interviewee ever had other (than bone, chest, dental) X-ray examination?
chemotx Has study subject had chemotherapy for cancer tumour
flag2 controls used in risk analysis for Phase I but now matched to their original case used in set Phase II
COM1_EXP1 dosimetry expert’s opinion about the quality of interview during the 1st mission to the 30-km zone
[age at buccal sampling]7 polynomial completed to include all lower order terms - [age at buccal sampling]kwithk< 7 exp expert dosimetrist who prepared dosimetric questionnaire for input into RADRUE
y_int year of interview
rad_army study subject ever worked with radiation in army service (other than time the study subject spent in the Chornobyl area)
haz_exp study subject ever worked in a hazardous industry (specific types of chemical/electrical/road-building/other)
haz_el study subject worked in electrical industry (hazardous industry)
x_dental_n number of times study subject had dental X-ray
num_miss number of missions to the Chornobyl exclusion zone
haz_road study subject ever worked in road-building industry (hazardous industry)
sm_pday How many cigarettes did interviewee smoke in a typical day?
x_bone Has interviewee ever had bone X-ray?
Excluding 6 cancer cases
x_other_n How many times interviewee had any other type (than bone, chest, dental) of X-ray examination?
rad_army study subject ever worked with radiation in army service (other than time the study subject spent in the Chornobyl area)
COM1_EXP1 dosimetry expert’s opinion about the quality of interview during the 1st mission to the 30-km zone
[age at buccal sampling]5 polynomial completed to include all lower order terms - [age at buccal sampling]kwithk< 5 exp expert dosimetrist who prepared dosimetric questionnaire for input into RADRUE
x_dental_n Number of times study subject had dental X-ray
x_bone Has interviewee ever had bone X-ray?
industry work in hazardous industries
sm_pday How many cigarettes did interviewee smoke in a typical day?
num_miss number of missions to the Chornobyl exclusion zone
haz_road study subject ever worked in road-building industry (hazardous industry)
rad_radiography study subject ever worked with radiation as industrial radiographer (other than time study subject spent in the Chornobyl area)
other_chemical work with hazardous chemicals other than in petroleum industry/pesticides/solvents
flag_definite certainty in the leukemia diagnosis (definite + probable/other)
Appendix 2
Table 8Influence of various potentially hazardous factors on micronuclei (MN) counts, using all samples (including 6 cancer cases)
Number % Translocation rate
Mean MN / 1000 scored
SD p-value heterogeneity
Dose (mSv) 0–19 66 59.5 4.17 5.84 0.5867
20–99 29 26.1 3.48 4.32
100–249 5 4.5 7.40 10.02
250–499 8 7.2 4.71 3.86
≥500 3 2.7 3.67 0.58
Age at buccal sample (years) 40–49 19 17.1 4.21 7.08 0.7879
50–59 33 29.7 3.37 4.90
60–69 40 36.0 5.34 5.74
≥70 19 17.1 2.99 3.77
Years since last exposure < 12 14 12.6 3.81 4.66 0.4611
12–13 35 31.5 5.36 6.89
≥14 59 53.2 3.55 4.77
Unknown 3 2.7 3.67 3.51
Days of active work in Chornobyl exclusion zone 0 1 0.9 4.00 0.00 0.9364
1–29 21 18.9 4.22 5.18
30–59 46 41.4 3.85 5.30
60–89 20 18.0 6.03 7.89
90–179 15 13.5 3.39 3.41
≥180 8 7.2 2.54 2.98
Smoking status Never smoker/missing 40 36.0 3.85 5.85 0.2428
Former and current smokers
71 64.0 4.33 5.31
Alcohol consumption status Never drinker/missing 25 22.5 3.82 6.36 0.6316
Former and current drinkers
86 77.5 4.26 5.25
Work as industrial radiographer Never 107 96.4 4.16 5.45 0.0475
Ever 1 0.9 15.00 0.00
Unknown 3 2.7 0.33 0.58
Work with potential radiation exposure (other than Chornobyl)
Never 94 84.7 4.30 5.62 0.6426
Ever 16 14.4 3.54 4.92
Unknown 1 0.9 1.00 0.00
Work in nuclear industry (including Chornobyl NPP) Never 102 91.9 4.33 5.68 0.1705
Ever 6 5.4 3.11 0.84
Unknown 3 2.7 0.33 0.58
Work in army with potential radiation exposure (excluding Chornobyl)
Never 103 92.8 4.29 5.49 0.2015
Ever 6 5.4 3.17 6.34
Unknown 2 1.8 0.50 0.71
Work with potential radiation exposure (excluding Chornobyl)
Never 106 95.5 4.31 5.56 0.2436
Ever 3 2.7 1.33 2.31
Table 8Influence of various potentially hazardous factors on micronuclei (MN) counts, using all samples (including 6 cancer cases) (Continued)
Radiotherapy for conditions other than cancer Never 109 98.2 4.17 5.52 0.3851
Ever 1 0.9 6.67 0.00
Unknown 1 0.9 0.00 0.00
Any dental X-rays Never 46 41.4 4.45 6.16 0.1184
Ever 65 58.6 3.95 5.00
Any chest X-rays Never 54 48.6 3.40 5.47 0.1464
Ever 55 49.5 4.93 5.52
Unknown 2 1.8 3.33 4.71
Any bone X-rays Never 62 55.9 4.70 6.33 0.2739
Ever 48 43.2 3.55 4.17
Unknown 1 0.9 0.00 0.00
X-rays other than dental, chest, bone Never 77 69.4 3.72 5.48 0.0629
Ever 33 29.7 5.31 5.47
Unknown 1 0.9 0.00 0.00
Total 111 100.0 4.16 5.49
Heterogeneityp-values are adjusted for overdispersion
Table 9Regression analysis of absolute and relative risk of micronucleus prevalence data in relation to radiation dose, using all samples
Model number Linear term for absolute risk (α) model (/1000 Scored cells /Gy)
Linear term for relative risk (α) (/Gy) Exponential term (β) (/Gy) Deviance (df) p-value
AIC-minimizing background model (no dose term)
1 - - - 114.05 (80)
Absolute risk model in dose (1), background adjusted using AIC-minimizing model
2 2.90 (−1.26a, 7.66) - - 110.90 (79) 0.1379b
3 0.28 (−2.28a, 21.56) - 3.64 (−9.59a, 16.87a) 110.73 (78) 0.7310c
Relative risk model in dose (2), background adjusted using AIC-minimizing model
4 - 0.94 (−0.66, 3.68) - 112.50 (79) 0.3003b
5 - 0.06 (−0.74a, 0.86a) 4.57 (−16.45a, 25.60a) 111.72 (78) 0.4625d
Allp-values relate improvement in fit evaluated via anF-test
a
Wald-based CI
b
p-value of improvement in fit over null model in dose (model number 1)
cp
-value of improvement in fit over linear model in dose (model number 2)
d
Additional file
Additional file 1:Data files (Excel, text) and other R and Epicure files used in the analysis. (ZIP 3032 kb)
Acknowledgements
Not applicable.
Ethical approval and consent to participate
The data were hosted at three collaborating institutions: National Research Center for Radiation Medicine, Kyiv, Ukraine, Columbia University/University of California San Francisco (UCSF), and the National Cancer Institute (NCI). All subjects signed an informed consent form, and the study was reviewed and approved by the institutional review boards of the participating institutions in both Ukraine and the United States. The data were de-identified before transfer to the United States participating institutions. The key to the data exists in Ukraine, but US researchers did not have access to it at any point.
Funding
Research reported in this publication was supported by the National Cancer Institute of the National Institutes of Health under contract NO1-CP-21178 and award number 5K07CA132918. The content is solely the responsibility of the authors and does not necessarily represent the official views of the Na-tional Institutes of Health. AddiNa-tional support was provided by the Intramural Research Program of the National Institutes of Health, the National Cancer In-stitute, Division of Cancer Epidemiology and Genetics.
Availability of data and materials
The dataset and analysis files (including R [36] and Epicure [38] scripts) supporting the conclusions of this article is included within the article (and its additional file‘Additional file 1.zip’).
Authors’contributions
All authors of this research manuscript have directly participated in the planning, execution, or analysis of the study.The statistical analysis was conducted by MPL. Blood samples were collected and assayed, and associated interviews with the cleanup workers organized and conducted by DB, II, OL, ID, NT, NG. Dose estimates were made by VC. All authors participated in the writing of the manuscript.
Authors’information
Not applicable.
Competing interests
The authors declare that they have no competing interests.
Consent for publication
All authors of this manuscript agree to this submission toEnvironmental Healthand agree with the content and presentation of the manuscript. It is not under consideration for publication elsewhere, its publication is approved by all authors and tacitly or explicitly by the responsible authorities where the work was carried out, and it will not be published elsewhere in the same form, in English or in any other language, including electronically without the written consent of the copyright-holder.
Author details
1National Research Center for Radiation Medicine, 53 Melnikov Street, Kyiv
04050, Ukraine.2Rutgers-Robert Wood Johnson Medical School, 5635, 675 Hoes Lane W, Piscataway Township, New Brunswick, NJ 08854, USA.3UCSF Box 0520, Division of Neuroepidemiology, Helen Diller Family
Comprehensive Cancer Center, University of California San Francisco, 505 Parnassus Avenue, San Francisco, CA 94143-0520, USA.4Box 0520, Laboratory of Molecular Epidemiology, University of California San Francisco
Comprehensive Cancer Center, 1450 3rd Street, San Francisco, CA 94158, USA.5Division of Cancer Epidemiology and Genetics, National Cancer Institute, National Institutes of Health, Department of Health and Human Services, Radiation Epidemiology Branch, Room 7E546, 9609 Medical Center Drive, Bethesda, MD 20892-9778, USA.6Department of Epidemiology and Biostatistics, School of Medicine, University of California, San Francisco, 3333 California St, San Francisco, CA 94118, USA.
Received: 20 March 2017 Accepted: 6 June 2017
References
1. Norppa H, Bonassi S, Hansteen IL, Hagmar L, Stromberg U, Rossner P, et al. Chromosomal aberrations and SCEs as biomarkers of cancer risk. Mutat Res. 2006;600:37–45.
2. Boffetta P, van der Hel O, Norppa H, Fabianova E, Fucic A, Gundy S, et al. Chromosomal aberrations and cancer risk: results of a cohort study from Central Europe. Am J Epidemiol. 2007;165:36–43.
3. Bonassi S, El-Zein R, Bolognesi C, Fenech M. Micronuclei frequency in peripheral blood lymphocytes and cancer risk: evidence from human studies. Mutagenesis. 2011;26:93–100.
4. Sari-Minodier I, Orsière T, Auquier P, Martin F, Botta A. Cytogenetic monitoring by use of the micronucleus assay among hospital workers exposed to low doses of ionizing radiation. Mutat Res. 2007;629:111–21. 5. Fenech M, Bolognesi C, Kirsch-Volders M, Bonassi S, Zeiger E, Knasmüller S,
Holland N: Harmonisation of the micronucleus assay in human buccal cells– a Human Micronucleus (HUMN) project (www.humn.org) initiative commencing in 2007. Mutagenesis 2007, 22:3-4.
6. Norppa H, Falck GC. What do human micronuclei contain? Mutagenesis. 2003;18:221–33.
7. Preethi N, Chikkanarasaiah N, Bethur SS. Genotoxic effects of X-rays in buccal mucosal cells in children subjected to dental radiographs. BDJOpen. 2016;2:16001.
8. Holland N, Bolognesi C, Kirsch-Volders M, Bonassi S, Zeiger E, Knasmueller S, et al. The micronucleus assay in human buccal cells as a tool for biomonitoring DNA damage: the HUMN project perspective on current status and knowledge gaps. Mutat Res. 2008;659:93–108.
9. Fenech M, Holland N, Zeiger E, Chang WP, Burgaz S, Thomas P, et al. The HUMN and HUMNxLinternational collaboration projects on human micronucleus assays in lymphocytes and buccal cells–past, present and future. Mutagenesis. 2011;26:239–45.
10. Prosser JS, Moquet JE, Lloyd DC, Edwards AA. Radiation induction of micronuclei in human lymphocytes. Mutat Res. 1988;199:37–45.
11. Vral A, Thierens H, De Ridder L. Study of dose-rate and split-dose effects on the in vitro micronucleus yield in human lymphocytes exposed to X-rays. Int J Radiat Biol. 1992;61:777–84.
12. Bhat NN, Rao BS. Dose rate effect on micronuclei induction in cytokinesis blocked human peripheral blood lymphocytes. Radiat Prot Dosimetry. 2003; 106:45–52.
13. Noll M, Böck E, Schöner W, Egger P, Wolf C, Rüdiger H, et al. Correlation of the LET-dependent TL-response of LIF:Mg, Ti TL-dosemeters and gentoxic endpoints after proton irradiation. Appl Radiat Isot. 2000;52:1135–8. 14. Livingston GK, Falk RB, Schmid E. Effect of occupational radiation exposures
on chromosome aberration rates in former plutonium workers. Radiat Res. 2006;166:89–97.
15. Fenech M. Cytokinesis-block micronucleus assay evolves into a "cytome" assay of chromosomal instability, mitotic dysfunction and cell death. Mutat Res. 2006;600:58–66.
16. Fenech M, Perepetskaya G, Mikhalevich L. A more comprehensive application of the micronucleus technique for biomonitoring of genetic damage rates in human populations–experiences from the Chernobyl catastrophe. Environ Mol Mutagen. 1997;30:112–8.
17. Verhaegen F, Vral A. Sensitivity of micronucleus induction in human lymphocytes to low-LET radiation qualities: RBE and correlation of RBE and LET. Radiat Res. 1994;139:208–13.
18. Vral A, Verhaegen F, Thierens H, De Ridder L. Micronuclei induced by fast neutrons versus60Coγ-rays in human peripheral blood lymphocytes. Int J Radiat Biol. 1994;65:321–8.
19. Wuttke K, Müller W-U, Streffer C. The sensitivity of the in vitro cytokinesis-blocked micronucleus assay in lymphocytes for different and combined radiation qualities. Strahlenther Onkol. 1998;174:262–8.
20. Gersey B, Sodolak J, Hada M, Saganti P, Wilkins R, Cucinotta F, et al. Micronuclei induction in human fibroblasts exposed in vitro to Los Alamos high-energy neutrons. Adv Space Res. 2007;40:1754–7.
21. Willems P, August L, Slabbert J, Romm H, Oestreicher U, Thierens H, et al. Automated micronucleus (MN) scoring for population triage in case of large scale radiation events. Int J Radiat Biol. 2010;86:2–11.