R E S E A R C H A R T I C L E
Open Access
The use of continuous data versus binary data
in MTC models: A case study in rheumatoid
arthritis
Susanne Schmitz
1*, Roisin Adams
2and Cathal Walsh
1,2Abstract
Background: Estimates of relative efficacy between alternative treatments are crucial for decision making in health care. When sufficient head to head evidence is not available Bayesian mixed treatment comparison models provide a powerful methodology to obtain such estimates. While models can be fit to a broad range of efficacy measures, this paper illustrates the advantages of using continuous outcome measures compared to binary outcome measures. Methods: Using a case study in rheumatoid arthritis a Bayesian mixed treatment comparison model is fit to estimate the relative efficacy of five anti-TNF agents currently licensed in Europe. The model is fit for the continuous HAQ improvement outcome measure and a binary version thereof as well as for the binary ACR response measure and the underlying continuous effect. Results are compared regarding their power to detect differences between treatments. Results: Sixteen randomized controlled trials were included for the analysis. For both analyses, based on the HAQ improvement as well as based on the ACR response, differences between treatments detected by the binary outcome measures are subsets of the differences detected by the underlying continuous effects.
Conclusions: The information lost when transforming continuous data into a binary response measure translates into a loss of power to detect differences between treatments in mixed treatment comparison models. Binary outcome measures are therefore less sensitive to change than continuous measures. Furthermore the choice of cut-off point to construct the binary measure also impacts the relative efficacy estimates.
Keywords: Bayesian mixed treatment comparison models, Rheumatoid arthritis, Anti-TNF agents
Background
Meta-analysis has developed to be a widely used tool to combine trials evaluating the same intervention. This allows more powerful conclusions when a single study group is too small, and it fits naturally in the Bayesian framework where the inclusion of all available evidence into an analysis is anticipated [1]. A natural extension of a meta-analysis is a mixed treatment comparison (MTC) where more than two treatments are compared in a net-work of evidence. While direct evidence is preferable it is often not available due to ethical or financial reasons and MTC models provide a powerful tool to estimate rel-ative efficacy among treatments which are not directly
*Correspondence: [email protected]
1Department of Statistics, Trinity College Dublin, Dublin, Ireland Full list of author information is available at the end of the article
compared in a trial. A Bayesian approach to indirect com-parison allows the inclusion of a wide range of evidence and is flexible to deal with increasingly complex evidence structures [2].
The variance of an indirect comparison is typically larger than the variance of a comparable direct compari-son; the variance increases with every indirect link in the chain. It is therefore crucial to make the greatest use of available data.
Using a case study in rheumatoid arthritis this paper presents a MTC model on a range of efficacy measures illustrating the increased power of continuous outcome measures in such models compared to using binary mea-sures. For the presentation of the analysis we follow the checklist suggested by Spiegelhalter et al. [3].
Dichotomized outcome measures
Dichotomized outcome measures are widespread in med-ical research. The perceived advantage of simplicity in the interpretation comes at a cost, however [4]. The loss of information results in a loss of power to detect relation-ships, furthermore the type I error rate may be inflated [5] and there is a risk of underestimating the variance param-eter. These issues have been discussed in the literature relating to a number statistical analyses [6-9].
In this work we demonstrate the consequences of dichotomized outcome measures in the context of MTC modelling. It has been pointed out that dichotomization can be used when designing trials to quantify a treatment effect [10,11]. This is the primary aim of many clinical tri-als aiming for license approval. The anticipated efficacy level is taken as a cut-off point and results allow a straight-forward interpretation. Pharmacoeconomic assessments of healthcare interventions are now a formal compo-nent of decision making in many countries [12]. Evidence syntheses typically rely on published clinical trials to esti-mate the relative efficacy among alternative agents to inform decision making. This has created an additional use of clinical trials demonstrating treatment efficacy, for which dichotomized measures suffer from disadvantages compared to the underlying continuous effect measure. The loss of power due to dichotomization adds to the increased variance in indirect comparisons. This is espe-cially problematic for MTCs (vs. pairwise meta-analysis), since they typically have large standard errors due to the indirect nature of the comparison.
The intervention
Rheumatoid arthritis (RA) is a chronic, progressive and disabling auto-immune disease, causing swelling and damaging cartilage and bone around the joints. Any joint may be affected but it is commonly the hands, feet and wrists. Common symptoms are joint swelling, pain, morn-ing joint stiffness, poor sleep, fatigue and weight loss [13].
Over the past decade, enhanced understanding of the molecular pathogenesis has led to the development of biologic agents that target specific parts of the immune system. These innovative treatments have altered the path and face of RA and outcomes for patients and society.
Tumour necrosis factor alpha antagonists (anti-TNF-α)
are the first of the biologic treatment groups used in RA. There are currently five anti-TNF agents licensed for RA in Europe; adalimumab, certolizumab, etaner-cept, golimumab and infliximab. All of these agents have demonstrated considerable efficacy in placebo controlled randomized controlled trials (RCTs) in patients who have had an inadequate response to conventional Dis-ease Modifying Anti-Rheumatic Drugs (DMARDs) such as methotrexate (MTX) or sulphasalazine.
While there is a wealth of RCT evidence available for these agents compared to either placebo or conventional DMARDs, there are currently very limited head-to-head RCTs of anti-TNF agents. Despite this, some estimate of relative efficacy in order to inform choice of agent is needed. In the absence of head-to-head trials of rel-evant comparators, it is necessary to combine evidence from placebo controlled trials of different treatments and thereby derive an estimate of effect of one treatment against another. This can be broadly termed as mixed treatment comparison (MTC), an extension of meta-analysis. Different methodologies have been described for MTC; one such method uses Bayesian hierarchical mod-els. Such models provide more flexibility than classical methods to include more data and handle more complex modelling structures [14].
Aim of the analysis
The aim of this analysis is to demonstrate the advan-tage of using continuous measures in MTC models com-pared to using binary measures. In the present analysis a MTC model is fitted to estimate all pair-wise comparisons
among the five TNF-αinhibitors and placebo for a range
of outcome measures.
Nixon et al. [15] have developed a MTC model to fit the binomial American College of Rheumatology (ACR) out-come measure; it is possible to include trials with multiple treatment arms and to adjust for study level covariates. Jansen et al. [16] have presented a MTC model on the outcome of the Health Assessment Questionnaire (HAQ), which is measured on a continuous scale. However, they did not allow for multiple treatment arms or the inclusion of baseline characteristics. The present analysis extends Jansen’s methods to allow for these.
While binary measures are useful for demonstrating a certain level of efficacy in clinical trials, we will show that the loss of information when changing from the under-lying continuous scale to the binary outcome measure results in a loss of power to detect differences between treatments in MTC analyses.
Fitting models for a continuous improvement measure and a discretised version thereof as well as for binary outcome measures and a continuous version of these illustrates the enhanced power to detect differences of continuous measures compared to binary measures.
The chosen outcome measures are based on the ACR criteria and the HAQ score. Details are described in the next section.
Efficacy Measures
HAQ score. Table 1 summarises the different measures of improvement. While other measures exist, they are out-side the scope of this paper and are discussed elsewhere [17].
The ACR response criteria is a binary combination mea-sure including the number of tender and swollen joints, patient’s global assessment, physician’s global assessment, pain, degree of disability and level of acute-phase reac-tant. In order to achieve an ACR 20, ACR 50 or ACR 70 result, an improvement of 20%, 50% or 70% respectively is required in the swollen and tender joint counts as well as in 3 of the 5 remaining dimensions [18,19].
Continuous measures based on the ACR criteria have been introduced including the meanACR and the ACR hybrid measure [20]. The meanACR measures the mean % improvement in the seven ACR core set measures. The ACR hybrid measure combines the ACR 20, ACR 50 and ACR 70 with the ACRmean. A patient’s ACR hybrid out-come is the same as the ACRmean, but restricted by his binary ACR response. For example, the outcome for a patient who is an ACR 20 responder, but not an ACR 50 responder is restricted to the interval [0.2, 0.5).
The HAQ score represents the result of a self-report questionnaire in which patients rate their ability to per-form daily life activities such as washing one’s hair or getting in and out of a car. Values range from 0 to 3 in steps of 0.125, where high values indicate a more severe disease status. The improvement in HAQ score is measured on a continuous scale.
For the purpose of demonstrating the enhanced power of continuous measures in MTC models we have defined a discretised version of the HAQ score: HAQ 20 and HAQ 50. They are defined analogously to ACR 20 and ACR 50. A patient achieves a HAQ 20 outcome, if his HAQ score has improved by at least 20%; a 50% improvement is required for HAQ 50.
The DAS28 score is a combination measure on a con-tinuous scale from 0 to 10 incorporating swollen joint count (swollen28), tender joint count (tender28) (out of 28 defined joints), an evaluation of the patients general health
Table 1 Measuring improvement in RA: ACR (American College of Rheumatology); HAQ (Health Assessment Questionnaire); DAS28 (Disease Activity Score)
ACR HAQ DAS28
continuous meanACR HAQ %-improvement DAS28
ACRhybrid
binary ACR 20 HAQ 20∗ ACR 50 HAQ 50∗ ACR 70
∗Note: HAQ 20 and HAQ 50 are not validated response measures, they have
been created here for the purpose of illustrating the loss of power in binary vs. continuous measures.
(GH) and the erythrocyte sedimentation rate (ESR). The score is obtained using the formula [21]:
DAS28=0.56∗√tender28+0.28∗√swollen28
+0.70∗ln(ESR)+0.014∗GH (1)
Methods Data
A systematic literature review following the PRISMA method [22] was performed to identify trials meeting our inclusion criteria. The search included published studies up to and including October 2010 in PubMed, Embase and the Cochrane Database. Rheumatological inflammatory diseases other than RA, such as ankylos-ing spondylitis, psoriatic arthritis and connective tissue diseases were excluded from the search. The inclusion cri-teria were randomised controlled trials (RCTs), patients with established RA who have had an inadequate response to methotrexate (MTX) and who have been treated for at least 24 weeks (where 24 week data were not avail-able, data within 6 weeks either before or after 24 weeks were used). Both monotherapy and combination therapy were included with an explicit term in the statistical model allowing for the additional effect of MTX. More details on the selection process can be found elsewhere [23].
The outcome measures chosen were those described in the previous section based on the ACR criteria, the HAQ score and the DAS28. Unfortunately the DAS28 was reported in too few trials to fit a MTC model (DAS28 was only reported in 6 trials, not representing each of the treat-ments). The total number of responders achieving ACR 20, ACR 50 and ACR 70 response and the mean improve-ment and standard deviations (SDs) for the continuous HAQ measure were extracted. Authors were contacted in cases where the required data were not reported. Where no access to the missing data was provided, the follow-ing methodology was applied: in cases where the mean was not reported, the median was used; in the absence of SDs, interquartile ranges (IQRs) were used to estimate SDs using a normal approximation, and, in the remain-ing cases, the maximum of clinical trial SDs was used. The doses of biological agents included are those included in the RCTs. Demographic data including age, gender, mean disease duration, baseline HAQ score and number of previous DMARDs were recorded.
Statistical Model
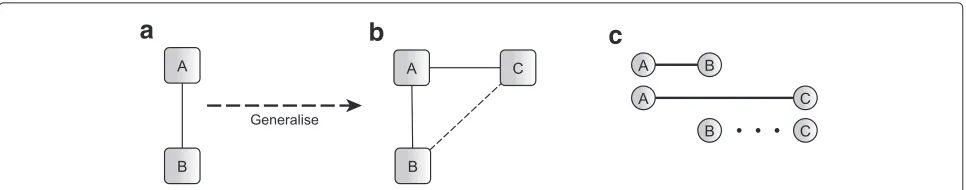
represents the underlying evidence structure of such mod-els. Figure 1 shows the generalisation of meta-analysis to the simplest case of an indirect comparison. Network diagrams consist of nodes representing the interventions included in the analysis and edges between nodes identify interventions which are directly compared in one or more trials. Dotted lines are used to indicate the indirect com-parison of interest. For simplicity, these are often omitted when all comparisons for which no direct evidence is available is of interest.
In a simple meta-analysis evidence from a range of tri-als comparing the same two interventions A and B is combined yielding an overall A vs. B estimate (see evi-dence network in Figure 1(a)). The underlying method-ology is well explored and used extensively in practice. The simplest case of a MTC occurs when this situation is extended to include a third intervention, drug C, which has also been compared to drug A in clinical trials (see Figure 1(b)). MTC modelling assumes that the combined evidence from A vs. B and A vs. C trials contains some information about the relative efficacy of B vs. C; in par-ticular B vs. C is assumed to be the difference between A vs. B and A vs. C (see Figure 1(c)). MTC models can be fitted for all underlying evidence structures as long as the network diagram is connected. Combining evidence this way evokes the assumption of treatment exchangeability, a similarity assumption among the trials. The effect of B in the A vs. B trials is assumed to occur if C was replaced by B in the A vs. C trials. Unfortunately this assump-tion can only be tested in networks of closed loop design, where consistency measures can be obtained; methods are described elsewhere [24]. When this is not the case, great care has to be taken in selecting the trials for the analysis. All models can be fitted in a Bayesian or in a classical framework. The Bayesian approach to MTC modelling is the most flexible, allowing the inclusion of a wide range of data and borrowing strength across the network ensures the optimal use of the data. Details on classical methods can be found elsewhere [25,26]. This analysis focuses on the Bayesian approach only.
In the remainder of this section the mathematical mod-els for binary and continuous outcome measures are described beginning with simple meta-analytic models
which are then extended to MTC models including base-line characteristics and other assumptions necessary for the RA model.
Simple Meta Analysis
In a simple meta analysis only two interventions are com-pared; evidence of a number of trials is combined to get an overall estimate for the difference in effect. The continuous mathematical model is the following [16]:
⎧ ⎪ ⎨ ⎪ ⎩
i ∼N(δi,σi2)
δi∼N(d,σδ2)
d∼[−,−] σδ∼[−,−]
(2)
i is the observed relative treatment effect in study i; σi the associated sampling error; i = 1,. . .N, where
N is the number of trials included in the analysis. The
model assumes random effects, meaning the study specific true effectsδiare drawn from a normal distribution with mean d and between trial variance parameterσδ2. Prior distributions need to be specified for the basic
parame-ter d and the between trial standard deviationσδ. The
choice of prior distribution is discussed in section “Prior distributions”, in this section we simply indicate which parameters require a prior distribution.
The binary counterpart to calculate odds ratios can be formulated as follows:
⎧ ⎪ ⎪ ⎪ ⎪ ⎪ ⎪ ⎨ ⎪ ⎪ ⎪ ⎪ ⎪ ⎪ ⎩
r.ci∼Bin(n.ci,p.ci); r.ti∼Bin(n.ti,p.ti) logit(p.ci)=μi
logit(p.ti)=μi+δi
δi∼N(d,σδ2)
d∼[−,−] μi∼[−,−] σδ∼[−,−]
(3)
A binomial likelihood is assumed for the number of patients and number of responders in control arm and treatment arm of each study;n.ci,n.ti,r.ci,r.tirespectively. The model calculates log odds ratios (LORs) for each study,δi, for which random effects are assumed yielding an
a
b
c
overall log odds ratio estimatedand a between trial stan-dard deviationσδ. Prior distributions need to be assigned tod, the logits in the control groupμiandσδ.
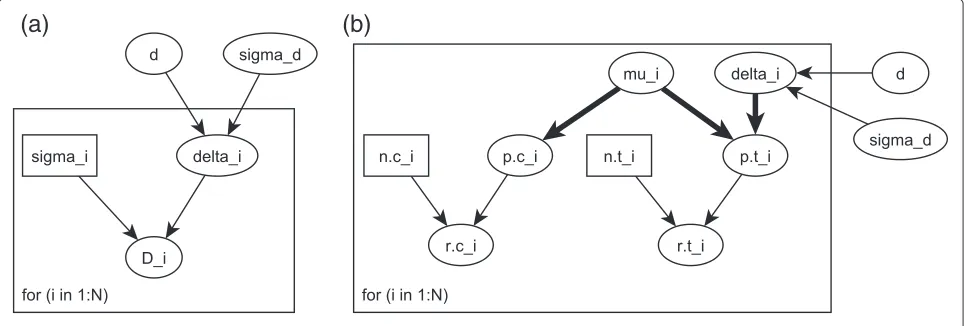
Figure 2 shows the directed acyclic graph (DAG) for (a) the continuous and (b) the binary meta-analysis model.
Extension to MTC
The models described in (2) and (3) for a simple meta analysis can be extended to a MTC model, which allows the estimation of relative efficacy among more than two interventions [14,16]. Mathematically this means the con-tinuous model in equation (2) changes to:
⎧ ⎪ ⎪ ⎪ ⎪ ⎨ ⎪ ⎪ ⎪ ⎪ ⎩
i∼N(δi,k,P,σi2)
δi,k,P∼N(dk,P,σδ2)
ICk,l=dk,P−dl,P k=l dk,P∼[−,−] σδ∼[−,−]
(4)
As before i refers to the observed relative treatment
effects of the comparison in study i with respective mea-sure of variabilityσi.kandlindicate the anti-TNF agent evaluated in the trials; 1 indicates adalimumab, 2 inflix-imab, 3 etanercept, 4 golimumab and 5 certolizumab. The baseline treatment is placebo, indicated by P. Assuming random effects, the study specific true effects are drawn from a normal distribution with a mean specific to the comparison; i.e. the effects of all trials comparing the same two interventions are drawn from the same normal distri-bution. The between trial variance parameter is assumed to be the same for all comparisons. Each comparison of drug k versus drug l,ICk,l, can be written in terms of basic parametersdk,P. Prior distributions are required for basic parameters and between trial standard deviationσδ.
For the binary outcome measures the model in equation (3) extends to:
⎧ ⎪ ⎪ ⎪ ⎪ ⎪ ⎪ ⎪ ⎪ ⎪ ⎨ ⎪ ⎪ ⎪ ⎪ ⎪ ⎪ ⎪ ⎪ ⎪ ⎩
r.ci∼Bin(n.ci,p.ci); r.ti∼Bin(n.ti,p.ti) logit(p.ci)=μi
logit(p.ti)=μi+δi,k,P
δi,k,P∼N(dk,P,σδ2)
ICk,l=dk,P−dl,P k=l
dk,P∼[−,−] μi∼[−,−] σδ∼[−,−]
(5)
Againn.ci,n.ti,r.ciandr.tirefer to the number of patients and number of responders in the control and treatment arm of each study. The model calculates LORsδi,k,P for each study, which are combined assuming random effects with a common mean for each baseline comparisondk,P. The between trial SD is assumed to be the same for all drugs. All other comparisonsICk,lcan be estimated from the baseline parameters. Prior distributions need to be defined fordk,P,μiandσδ.
Further extensions
For the use of the model for RA data three more adjust-ments have to be made. We want to allow for more than one treatment arm per study; adjustments have to be made for the concurrent treatment with MTX. Fur-thermore, we would like to model the improvement rel-ative to baseline disease activity, since disease activity at baseline influences the effectiveness of the intervention [27]. Also, the results of this analysis provide the basis for an economic analysis, which requires the percentage improvement in HAQ score as input parameters.
A step by step approach is taken to include these assumptions into the model described in (4) for the con-tinuous case and (5) for the binomial case.
As a first step the allowance for multiple treatment arms
is included. Let index j refer to treatment arm j (j =
(a)
(b)
1,. . .,M, whereMis the total number of treatment arms in the analysis) and s(j) refers to the study of treatment armj. The continuous mathematical model then takes the following form: ⎧ ⎪ ⎪ ⎪ ⎪ ⎪ ⎪ ⎪ ⎪ ⎪ ⎨ ⎪ ⎪ ⎪ ⎪ ⎪ ⎪ ⎪ ⎪ ⎪ ⎩
j=.tj−.cs(j)
j∼N(δj,k,P,σj2)
δj,k,P=δs(j),k,P
δs(j),k,P∼N(dk,P,σδ2)
ICk,l=dk,P−dl,P k=l dk,P∼[−,−] σδ∼[−,−]
(6)
For each treatment arm the observed effect relative to the comparator arm is calculated asj, which as before has a normal distribution with measure of variabilityσj. The model makes the assumptions that effects in treat-ment arms of the same study are constant, we therefore assume fixed effects for within study effects. This assump-tion is described in line 3 of equaassump-tion (6). Between trials we assume random effects, as before and each compari-sonICk,lcan be written in terms of basic parametersdk,P. Prior distribution need to be defined for basic parameters and between trial standard deviationσδ.
This model takes the following form for binary outcome measures: ⎧ ⎪ ⎪ ⎪ ⎪ ⎪ ⎪ ⎪ ⎪ ⎪ ⎪ ⎪ ⎨ ⎪ ⎪ ⎪ ⎪ ⎪ ⎪ ⎪ ⎪ ⎪ ⎪ ⎪ ⎩
r.cs(j)∼Bin(n.cs(j),p.cs(j)); r.tj∼Bin(n.tj,p.tj) logit(p.cs(j))=μs(j)
logit(p.tj)=μs(j)+δj,k,P δj,k,P=δs(j),k,P
δs(j),k,P∼N(dk,P,σδ2)
ICk,l=dk,P−dl,P k=l
dk,P∼[−,−] μs(j)∼[−,−] σδ∼[−,−] (7)
Changes from equation (5) to (7) are analogous to changes in the continuous case. A LORδj,k,P is obtained for each treatment arm; treatment arms of the same study are assumed to estimate the same treatment effect, hence line 4 in equation (7). Everything else remains the same.
In a next step we will extend the model to allow for the concurrent treatment with MTX. The effect due to MTX is assumed to be additive, meaning the relative effect between two arms where no MTX is given is the same as the relative effect between two arms where MTX is given in both arms:
(A + MTX) vs. (B + MTX)=A vs. B (8)
The continuous model takes the following form:
⎧ ⎪ ⎪ ⎪ ⎪ ⎪ ⎪ ⎪ ⎪ ⎪ ⎪ ⎪ ⎪ ⎪ ⎪ ⎨ ⎪ ⎪ ⎪ ⎪ ⎪ ⎪ ⎪ ⎪ ⎪ ⎪ ⎪ ⎪ ⎪ ⎪ ⎩
j=.tj−.cs(j)
j∼N(δj,k,P,σj2)
δj,k,P=αs(j),k,P+βs(j)(I.tj−I.cs(j))
αs(j),k,P∼N(ak,P,σα2)
βs(j)=b
ICk,l=ak,P−al,P k=l ak,P∼[−,−] b∼[−,−] σα∼[−,−]
(9)
The difference to the previous model described in equation (6) is the splitting of treatment effectδj,k,P into a part representing the effect due to the drug of interest (in the RA case the anti-TNF effect) αs(j),k,P and a part explaining the effect which is due to the concurrent treat-ment with MTX,βs(j).I.tiandI.cs(i)are indicator variables indicating whether MTX was given in treatment and com-parator group. By multiplying theβs(i)with the difference of the indicator the assumptions of an additive effect as explained above is implemented. In this way, only treat-ment arms, where MTX is given in either the treattreat-ment arm or in the respective control arm inform parameter βs(j). As previously the effect in arms of the same study is assumed constant, henceβj = βs(j) andαj,k,P = αs(j),k,P (this line has been omitted in the equation for simplicity; the effect is incorporated in line 3 of equation 9). Between trials random effects are assumed for αs(j),k,P and fixed effects for βs(j). One could just as well assume random effects for βs(j); but the RA data does not provide suffi-cient evidence to inform a between trial variability for b. All comparisonsICk,l can be expressed in terms of basic parametersak,P. Prior distributions need to be specified for the basic parameters, forband for the between trial standard deviationσα. The binary version of this model is mathematically described as follows:
⎧ ⎪ ⎪ ⎪ ⎪ ⎪ ⎪ ⎪ ⎪ ⎪ ⎪ ⎪ ⎪ ⎪ ⎪ ⎨ ⎪ ⎪ ⎪ ⎪ ⎪ ⎪ ⎪ ⎪ ⎪ ⎪ ⎪ ⎪ ⎪ ⎪ ⎩
r.cs(j)∼Bin(n.cs(j),p.cs(j)); r.ti∼Bin(n.tj,p.tj) logit(p.cs(j))=μs(j)+βs(j)∗I.cs(j)
logit(p.tj)=μs(j)+βs(j)∗I.ts(j)+αs(j),k,P
αs(j),k,P∼N(ak,P,σα2)
βs(j)=b
ICk,l=ak,P−al,P k=l
ak,P∼[−,−] μs(j)∼[−,−] b∼[−,−] σα∼[−,−]
(10)
improvement α is modelled as a multiplier to the HAQ score at baselineλi. All other aspects of model (9) remain unchanged.
⎧ ⎪ ⎪ ⎪ ⎪ ⎪ ⎪ ⎪ ⎪ ⎪ ⎪ ⎪ ⎪ ⎨ ⎪ ⎪ ⎪ ⎪ ⎪ ⎪ ⎪ ⎪ ⎪ ⎪ ⎪ ⎪ ⎩
j=.tj−.cs(j)
j∼N(δj,k,P,σj2)
δj,k,P =αs(j),k,P∗λj+βs(j)(I.tj−I.cs(j))
αs(j),k,P∼N(ak,P,σα2)
βs(i)=b
ICk,l=ak,P−al,P k=l
ak,P ∼[−,−] b∼[−,−] σα ∼[−,−]
(11)
The binomial measures selected for this study are by defi-nition relative to baseline disease activity, since the cut-off
between case and no case is a% improvement relative
to baseline. It is therefore not necessary to adjust the model defined in equation 10 further. For completeness, we will introduce the concept of meta-regression, which
allows for the adjustment for baseline characteristics in the analysis. The resulting model is:
⎧ ⎪ ⎪ ⎪ ⎪ ⎪ ⎪ ⎪ ⎪ ⎪ ⎪ ⎪ ⎪ ⎪ ⎪ ⎨ ⎪ ⎪ ⎪ ⎪ ⎪ ⎪ ⎪ ⎪ ⎪ ⎪ ⎪ ⎪ ⎪ ⎪ ⎩
r.cs(j)∼Bin(n.cs(j),p.cs(j)); r.tj∼Bin(n.tj,p.tj) logit(p.cs(j))=μs(j)+βs(j)∗I.cs(j)
logit(p.tj)=μs(j)+βs(j)∗I.ts(j)+αs(j),k,P+γ∗λs(j)
αs(j),k,P∼N(ak,P,σα2)
βs(j)=b
ICk,l=ak,P−al,P k=l
ak,P ∼[−,−] μs(j)∼[−,−] b∼[−,−] σα ∼[−,−] γ ∼[−,−]
(12)
γ refers to the regression parameter for the baseline HAQ score.
Models described in equations 10 and 11 enable the estimation of relative efficacy of a number of treatments while allowing for multiple treatment arms, concurrent treatment with additional medication and dependence of treatment effect on baseline disease activity for both
for(j IN 1 : N.t)
for(j IN 1 : N.c) for(i IN 1 : 5)
for(l IN 1 : 5) for(k IN 1 : 5) Delta[j]
alpha[j] drug[j]
I.c[j]
I.t[j] lambda[j]
alpha.m[j] delta[j]
Delta.c[j]
s[j] Delta.t[j]
Delta[j]
tau.delta[j] var.delta[j]
sd.delta[j]
beta[j]
sigma b
tau.a
sigma.sq
a[i] IC[k,l]
continuous and binary outcome measures. In the contin-uous case differences in efficacy are estimated; odds ratios are estimated in the binary case. Using methods by Warn et al. [28] the model can be modified to calculate other measures, such as risk ratios.
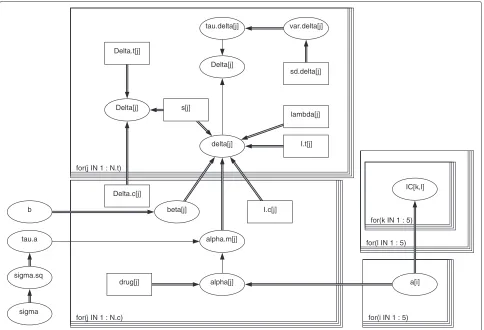
This model has been developed by Nixon et al. [15] for the binary case. Figure 3 shows the DAG for the final MTC models described by equations (11).
Prior distributions
The models described above require prior distributions for the baseline treatment effect, for the effect due to MTX, for the between trial standard deviation and in the binomial models for the log odds of response in the con-trol group and the meta-regression parameter. For the analysis we have chosen vague priors for all of these as described below. The prior distribution in a Bayesian anal-ysis represents the knowledge about the parameter prior to the analysis; in the absence of prior knowledge vague prior distributions intend to cover a wide area of plausi-ble values, such that little information is entered into the
analysis. For the treatment effect parametersdin model
(2) and (3),dk,P in models (4)-(7), forak,P andbin (9) -(12), for the log odds in the control group of the binomial modelsμias well as forγ we have chosen a normal distri-bution centred at no treatment effect 0 with a very large variance:
d ∼N(0, 10000)
dk,P ∼N(0, 10000) a ∼N(0, 10000)
(13)
b ∼N(0, 10000) μi ∼N(0, 10000)
γ ∼N(0, 10000)
The same prior can be used for both continuous and binary models, since the risk difference and the log odds ratios take values on the real line where 0 represents no difference. The priors do not favour any of the drugs and allows for a wide range of likely values in favour for each. This is a widely used vague prior on treatment effects.
A uniform distribution was chosen for the between trial standard deviation parameter σδ/α, as proposed by Gelman [29].
σδ/α∼dunif(0, 2) (14)
To test whether the range of the uniform prior was cho-sen appropriately the analysis has been rerun using wider ranges (dunif(0, 5)anddunif(0, 7)) and estimates did not change.
Computation/ Software
The MTC models were fitted in WinBUGs, a MCMC soft-ware using Gibbs sampling [30]. The DAG in Figure 3 is drawn in WinBUGs. Square shaped nodes represent con-stants; oval shaped nodes are either random or logical. A random dependency between two nodes can be found where a single arrow connects both nodes, a double arrow shows that there is a logical relationship. Loops are rep-resented by boxes. The complete code and input data is
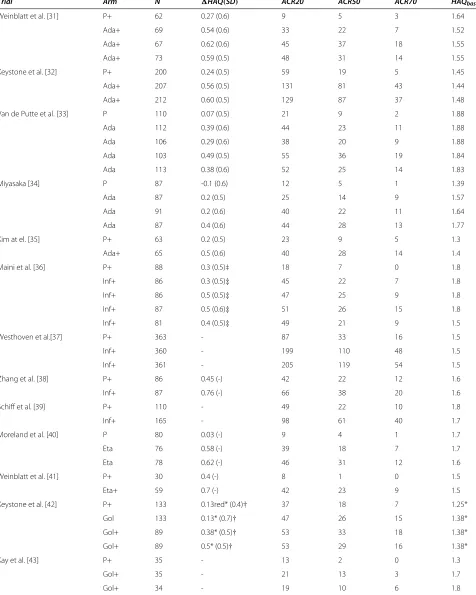
Table 2 Trial Data: Number of patients N; improvement in HAQ scoreHAQ; number of ACR20, ACR50, ACR70 responders; HAQ score at baseline HAQbase; + indicates additional treatment with MTX
Trial Arm N HAQ(SD) ACR20 ACR50 ACR70 HAQbase
Weinblatt et al. [31] P+ 62 0.27 (0.6) 9 5 3 1.64
Ada+ 69 0.54 (0.6) 33 22 7 1.52
Ada+ 67 0.62 (0.6) 45 37 18 1.55
Ada+ 73 0.59 (0.5) 48 31 14 1.55
Keystone et al. [32] P+ 200 0.24 (0.5) 59 19 5 1.45
Ada+ 207 0.56 (0.5) 131 81 43 1.44
Ada+ 212 0.60 (0.5) 129 87 37 1.48
Van de Putte et al. [33] P 110 0.07 (0.5) 21 9 2 1.88
Ada 112 0.39 (0.6) 44 23 11 1.88
Ada 106 0.29 (0.6) 38 20 9 1.88
Ada 103 0.49 (0.5) 55 36 19 1.84
Ada 113 0.38 (0.6) 52 25 14 1.83
Miyasaka [34] P 87 -0.1 (0.6) 12 5 1 1.39
Ada 87 0.2 (0.5) 25 14 9 1.57
Ada 91 0.2 (0.6) 40 22 11 1.64
Ada 87 0.4 (0.6) 44 28 13 1.77
Kim at el. [35] P+ 63 0.2 (0.5) 23 9 5 1.3
Ada+ 65 0.5 (0.6) 40 28 14 1.4
Maini et al. [36] P+ 88 0.3 (0.5)‡ 18 7 0 1.8
Inf+ 86 0.3 (0.5)‡ 45 22 7 1.8
Inf+ 86 0.5 (0.5)‡ 47 25 9 1.8
Inf+ 87 0.5 (0.6)‡ 51 26 15 1.8
Inf+ 81 0.4 (0.5)‡ 49 21 9 1.5
Westhoven et al.[37] P+ 363 - 87 33 16 1.5
Inf+ 360 - 199 110 48 1.5
Inf+ 361 - 205 119 54 1.5
Zhang et al. [38] P+ 86 0.45 (-) 42 22 12 1.6
Inf+ 87 0.76 (-) 66 38 20 1.6
Schiff et al. [39] P+ 110 - 49 22 10 1.8
Inf+ 165 - 98 61 40 1.7
Moreland et al. [40] P 80 0.03 (-) 9 4 1 1.7
Eta 76 0.58 (-) 39 18 7 1.7
Eta 78 0.62 (-) 46 31 12 1.6
Weinblatt et al. [41] P+ 30 0.4 (-) 8 1 0 1.5
Eta+ 59 0.7 (-) 42 23 9 1.5
Keystone et al. [42] P+ 133 0.13red* (0.4)† 37 18 7 1.25*
Gol 133 0.13* (0.7)† 47 26 15 1.38*
Gol+ 89 0.38* (0.5)† 53 33 18 1.38*
Gol+ 89 0.5* (0.5)† 53 29 16 1.38*
Kay et al. [43] P+ 35 - 13 2 0 1.3
Gol+ 35 - 21 13 3 1.7
Table 2 Trial Data: Number of patients N; improvement in HAQ scoreHAQ; number of ACR20, ACR50, ACR70 responders; HAQ score at baseline HAQbase; + indicates additional treatment with MTX(Continued)
Keystone et al. [44] P+ 199 0.18 (-) 27 15 6 1.7
Cert+ 393 0.60 (-) 231 146 84 1.7
Cert+ 390 0.63 (-) 237 156 79 1.7
Smolen et al. [45] P+ 127 0.14 (0.5) 11 4 1 1.6
Cert+ 246 0.5 (0.5) 141 80 39 1.6
Cert+ 246 0.5 (0.5) 142 81 26 1.6
Fleischmann et al. [46] P 109 -0.07 (0.4)‡ 10 4 0 1.6
Cert 111 0.39 (0.7)‡ 51 25 9 1.4
Ada=adalimumab; Inf=infliximab; Eta=etanercept; Gol=golimumab, Cert=certolizumab, P=placebo. *Median;†estimated from IQR;‡data provided by authors following request.
provided in Additional file 1. Computational feasability allowed for a large number of iterations. Each model dis-carded 50,000 burnin iterations and was run with 100,000 iterations and two chains. Convergence was analysed using CODA; the effective sample size was checked, and visual inspection of the autocorrelation and the chains confirmed convergence.
Results and discussion Data
The systematic literature review identified sixteen RCTs meeting our inclusion criteria. Figure 4 shows the net-work of available evidence. Table 2 summarises the data extracted from the trials, baseline demographics can be found in Additional file 2.
The MTC models described previously are fit to the data; the continuous model for the improvement in HAQ score and the binary model for the ACR 20, ACR 50 and ACR 70 outcome measures.
The aim of this paper is to demonstrate the increased power of continuous outcome measures to detect differ-ences in MTC models compared to binary measures. To explore this hypothesis the HAQ score was discretised to a binary outcome measure and the ACR criteria were trans-formed into a continuous measure; the resulting measures were analysed in addition to the trial reported outcome measures and results compared. The rationale for doing this was that comparing HAQ and ACR outcomes is not comparing like with like; they measure quite differ-ent aspects of disease and additional significant findings using the HAQ score could be because of this rather than there being any effect of a continuous vs. a binary out-come measure. Estimating a discrete version of the HAQ and a continuous measure of the ACR allows us to com-pare binary and continuous outcomes while the measure is kept fixed.
Discretised HAQ: HAQ 20 and HAQ 50
For the purpose of comparing continuous and binary out-come measures based on the same data, the HAQ 20
and HAQ 50 measures defined previously are estimated based on the continuous HAQ improvement. These dis-cretised HAQ outcomes are not validated outcome mea-sures for RA and are therefore not reported in the trials.
The trials report mean and standard deviation of HAQ improvement. The number of HAQ 20 and HAQ 50 responders in each trial arm was estimated as follows. For each trial arm, the HAQ improvement of 1000 patients was generated by reference to normal distribution with mean and SD given from the data in that group. From these patients the proportion of HAQ 20 and HAQ 50 responders was calculated and applied to the num-ber of patients in each trial arm. Data is summarised in Table 3.
Continuous ACR: ACRcont
While the continuous ACR measures were proposed by the Americal College of Rheumatology [20], they were not assessed in any of the trials. Therefore a continu-ous ACR measure ACRcont is generated based on the ACR 20, ACR 50 and ACR 70 outcomes reported in the trials. This enables us to compare the outcomes of the binary measures with those resulting from the continuous scale. ACRcont takes a value between 0 and 1 represent-ing the percentage improvement in the dimensions which are combined for the binary ACR criteria.
The trial data allows the categorisation of patients into non-responders (group 1) (patients not achieving an ACR 20 response), patients achieving ACR 20 but not ACR 50 response (group 2), patients achieving ACR 50 but not ACR 70 response (group 3) and ACR 70 respon-ders (group 4). Assuming a mean ACRcont response
mi for each group of patients these numbers are used
to generate the mean and SD of ACRcont for each trial arm:
Mean(ACRcont)= 1
N
4
i=1 Ni·mi
Table 3 Input Data for discretised HAQ score and continuous ACR: Number of patients N; number of HAQ20 and HAQ50 responders; continuous ACR response ACRcont; + indicates additional treatment with MTX
Trial Arm N HAQ20 HAQ50 ACRcont (SD)
Weinblatt et al. [31] P+ 62 30 12 0.08 (0.22)
Ada+ 69 45 24 0.35 (0.20)
Ada+ 67 47 26 0.46 (0.22)
Ada+ 73 52 26 0.42 (0.21)
Keystone et al. [32] P+ 200 95 32 0.13 (0.22)
Ada+ 212 141 81 0.42 (0.21)
Ada+ 207 154 82 0.41 (0.21)
Van de Putte et al. [33] P 110 29 4 0.09 (0.20)
Ada 112 47 16 0.31 (0.19)
Ada 106 60 19 0.30 (0.19)
Ada 103 57 20 0.38 (0.22)
Ada 113 60 21 0.33 (0.20)
Miyasaka [34] P 87 23 8 0.07 (0.17)
Ada 87 37 10 0.28 (0.19)
Ada 91 39 16 0.33 (0.20)
Ada 87 48 18 0.37 (0.21)
Kim et al. [35] P+ 63 28 10 0.18 (0.27)
Ada+ 65 43 24 0.42 (0.22)
Maini et al. [36] P+ 88 40 9 0.09 (0.19)
Inf+ 86 40 12 0.35 (0.19)
Inf+ 86 54 19 0.36 (0.20)
Inf+ 87 52 23 0.38 (0.21)
Inf+ 81 48 20 0.37 (0.19)
Westhoven et al. [37] P+ 363 - - 0.12 (0.23)
Inf+ 360 - - 0.37 (0.20)
Inf+ 361 - - 0.38 (0.21)
Zhang et al. [38] P+ 86 52 28 0.27 (0.31)
Inf+ 87 61 39 0.46 (0.20)
Schiff et al. [39] P+ 110 - - 0.22 (0.29)
Inf+ 165 - - 0.41 (0.22)
Moreland et al. [40] P 80 25 8 0.06 (0.16)
Eta 76 47 26 0.34 (0.19)
Eta 78 53 31 0.40 (0.21)
Weinblatt et al. [41] P+ 30 16 8 0.10 (0.17)
Eta+ 59 45 29 0.43 (0.19)
Keystone et al. [42] P+ 133 49 13 0.14 (0.25)
Gol 133 56 29 0.30 (0.20)
Gol+ 89 51 24 0.40 (0.22)
Gol+ 89 60 31 0.39 (0.21)
Kay et al. [43] P+ 35 - - 0.14 (0.20)
Gol+ 35 - - 0.39 (0.20)
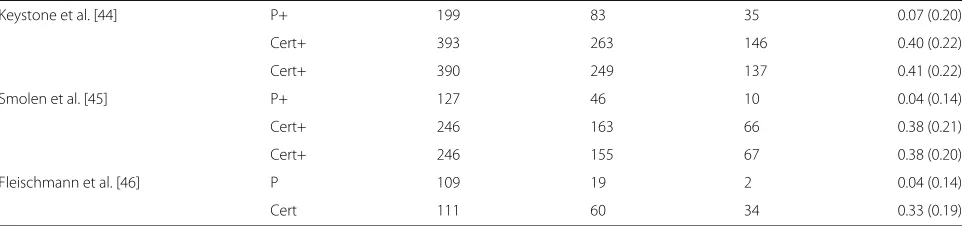
Table 3 Input Data for discretised HAQ score and continuous ACR: Number of patients N; number of HAQ20 and HAQ50 responders; continuous ACR response ACRcont; + indicates additional treatment with MTX(Continued)
Keystone et al. [44] P+ 199 83 35 0.07 (0.20)
Cert+ 393 263 146 0.40 (0.22)
Cert+ 390 249 137 0.41 (0.22)
Smolen et al. [45] P+ 127 46 10 0.04 (0.14)
Cert+ 246 163 66 0.38 (0.21)
Cert+ 246 155 67 0.38 (0.20)
Fleischmann et al. [46] P 109 19 2 0.04 (0.14)
Cert 111 60 34 0.33 (0.19)
Ada=adalimumab; Inf=infliximab; Eta=etanercept; Gol=golimumab, Cert=certolizumab, P=placebo.
whereNi refers to the number of patients in each group andN= 4i=1Ni.
sd(ACRcont)= 1
N
4
i=1
Ni·(mi−Mean(ACRcont))2
(16)
Patient level data from a RA cohort allowed the
esti-mation of mi for the four groups [47]. Mean ACRcont
response can be based on either continuous ACR measure described previously, depending upon which underlying measure we are trying to recreate. For the main analy-sis we are using the meanACR measure; results based on the ACRhybrid are discussed in the sensitivity analysis. Table 4 summarizes the mean ACRcont responses for the four groups based on both outcome measures. Improve-ment in the core sets is measured by a drop in score; therefore overall improvement is restricted by an upper bound of 100%. To achieve a symmetric measuring scale overall worsening has also been restricted to -100% in each of the criteria, as proposed elsewhere [20].
The patient level estimates are based on patients receiv-ing biologic treatment; estimates can therefore be applied to the treatment arms of the studies. Unfortunately no patient level data representing the control groups is avail-able to us. Given the lack of further information the analysis assumes interval midpoints as mean ACRcont estimates for the control groups. Group 1 is assumed to have a response in [-1, 0.2), group 2 in [0.2, 0.5), group 3 in [0.5, 0.7) and the response of group 4 lies in [0.7, 1]. The interval for non responders is very broad covering a wide
Table 4 Mean improvement estimated from patient level data
group 1 group 2 group 3 group 4
meanACR 0.17 0.41 0.57 0.72
ACRhybrid 0.10 0.41 0.59 0.77
Control Group 0.00 0.35 0.60 0.85
range of extreme values. The baseline analysis therefore assumes a conservative mean value of 0.00 for this group. This yields the control group estimates in Table 4. Alter-native scenarios assuming the same mean response for the control group as estimated for the treatment group are analysed in the sensitivity analysis. The estimated input data for the continuous ACR model based on meanACR is summarised in Table 3.
Efficacy Results
The models calculate the relative efficacy among all anti-TNF agents and placebo. Relative efficacy for the con-tinuous measures (HAQ improvement and ACRcont) was measured as difference in improvement. Relative improvement was modelled as a multiplier to baseline HAQ score. Odds ratios were calculated for the bino-mial measures ACR 20, ACR 50, ACR 70 and HAQ 20 and HAQ50. Thirteen trials were included for the HAQ analysis and sixteen for the ACR analysis.
The MTC results are summarised in forest plots; in Figure 5 for the HAQ measures and in Figure 6 for the ACR measures. Binomial results are plotted on the log scale. Plots show mean and 80% credible intervals to sum-marize the posterior distribution for the relative efficay between anti-TNF agents; significant differences on the 80% level are marked in red. The 80% level was chosen to shift away from the misunderstood acceptance-rejection dichotomy of random signifiance levels [23]. For addi-tional information, Tables 5 and 6 provide the exact means and interval endpoints; significant differences on the 80% level are marked with a “∗”.
Figure 5Forest Plot of HAQ results.Plots pairwise LORs for HAQ 20 and HAQ 50 outcome and improvement differences for % improvement in HAQ score of anti-TNF agents against placebo and one another. Red colour indicates significant differences at the 80% level.
ACR analysis. It illustrates the point made that a contin-uous measure of effect has a greater power to detect a difference between treatments in an evidence synthesis.
Conclusion
This analysis illustrates the enhanced sensitivity to change of continuous measures in MTC models compared to using binary outcome measures, which was recently high-lighted for epidemiological studies [48]. While binary measures work well for demonstrating a certain level of
response, which is the primary aim of many clinical tri-als, the information lost when categorizing the underlying continuous response can have significant impact on the results of a mixed treatment comparison.
MTC models are often utilized when faced with a choice of agents rather than for demonstrating efficacy. In the above application, for example, it is already known that all of the anti-TNF agents provide improvement in the treatment of RA. What remains is to determine whether some of these agents work better than others. Therefore
Table 5 Results from HAQ analysis: Mean estimate with 80% credible intervals for each pair-wise comparison
Comparison HAQ HAQ20 HAQ50
Ada vs P 0.20 (0.17,0.23)* 2.6 (2.2,3.1)* 3.1 (2.1,4.4)*
Inf vs P 0.10 (0.06,0.15)* 1.6 (1.2,2.1)* 2.0 (1.2,3.5)*
Eta vs P 0.31 (0.25,0.37)* 3.6 (2.6,5.2)* 4.1 (2.2,7.7)*
Gol vs P 0.23 (0.17,0.29)* 2.8 (2.0,4.1)* 4.2 (1.9,8.8)*
Cert vs P 0.25 (0.22,0.29)* 3.3 (2.7,4.0)* 5.0 (3.0,7.6)*
Inf vs Ada -0.10 (-0.15,-0.05)* 0.6 (0.4,0.8)* 0.7 (0.3,1.3)
Eta vs Ada 0.11 (0.04,0.17)* 1.4 (0.9,2.1) 1.3 (0.7,2.7)
Eta vs Inf 0.21 (0.13,0.28)* 2.3 (1.4,3.6)* 2.0 (0.9,4.9)
Gol vs Ada 0.02 (-0.05,0.08) 1.1 (0.7,1.6) 1.4 (0.6,3.3)
Gol vs Inf 0.12 (0.05,0.20)* 1.8 (1.1,2.8)* 2.1 (0.8,5.4)
Gol vs Eta -0.09 (-0.17,0.00)* 0.8 (0.5,1.3) 1.0 (0.4,2.7)
Cert vs Ada 0.05 (0.00,0.09)* 1.2 (0.97,1.6) 1.6 (0.8,2.8)
Cert vs Inf 0.15 (0.10,0.21)* 2.0 (1.5,2.9)* 2.4 (1.1,4.7)*
Cert vs Eta -0.06 (-0.13,0.01) 0.9 (0.6,1.3) 1.2 (0.5,2.5)
Cert vs Gol 0.03 (-0.04,0.09) 1.1 (0.8,1.7) 1.2 (0.4,2.7)
σ 0.03 (0.01,0.05) 0.1 (0.0,0.3) 0.4 (0.1,0.6)
Significant results are marked with∗. Outcome measures are % improvement for continuous HAQ and ORs for HAQ 20 and HAQ 50. Ada=adalimumab; Inf=infliximab; Eta=etanercept; Gol=golimumab, Cert=certolizumab, P=placebo, σ=between trial SD.
it would be of interest to know whether an agent provides a 30% improvement or a 60% improvement. When look-ing at the ACR 20 outcome, no difference would be seen between the two response rates.
The above analyses have shown two things. Firstly, the enhanced power to detect differences of a continuous measure as opposed to a binary measure was shown for both, the HAQ and the ACR measures. Secondly, the choice of cut-off level (e.g. 20%, 50% or 70%) has shown to have a strong impact on the results. Different significant results were detected when choosing different cut-offs; even the sequence of treatments when ordering from best to worse changes.
It may be argued that binary outcomes are clear and easy to interpret. However, where binary outcome sures are required, results based on continuous mea-sures can be transformed subsequently using cut-off points, [49].
From a clinical point of view these results show that a MTC model based on continuous outcome measures pro-vides greater precision of estimates of efficacy. This is of great benefit when carrying out an economic evaluation.
Sensitivity Analysis
The trials included for the analysis were conducted over a time period of 10 years. The model was extended to a meta-regression to include potential confounding param-eters such as duration of disease, number of previous
Table 6 Results from ACR analysis: Mean estimate with 80% credible intervals for each pair-wise comparison
Comparison ACR 20 ACR 50 ACR 70 ACRcont
Ada vs P 4.2 (3.4,5.3)* 5.6 (4.3,7.2)* 7.0 (4.3,10.9)* 0.27 (0.25,0.29)*
Inf vs P 3.5 (2.8,4.4)* 3.4 (2.7,4.4)* 3.7 (2.3,5.5)* 0.24 (0.22,0.27)*
Eta vs P 8.8 (5.5,13.9)* 12.1 (5.7,23.2)* 30.9 (4.2,123.8)* 0.32 (0.28,0.35)*
Gol vs P 3.3 (2.3,4.8)* 4.2 (2.7,6.5)* 6.5 (2.8,13.3)* 0.25 (0.21,0.28)*
Cert vs P 10.6 (8.0,14.1)* 9.5 (6.7,13.5)* 14.3 (6.8,27.0)* 0.32 (0.30,0.35)*
Inf vs Ada 0.8 (0.6,1.1) 0.6 (0.4,0.9)* 0.5 (0.3,1.0)* -0.03 (-0.06,0.00)*
Eta vs Ada 2.1 (1.2,3.4)* 2.2 (0.96,4.2) 4.4 (0.6,19.0) 0.05 (0.01,0.09)*
Eta vs Inf 2.5 (1.5,4.1)* 3.5 (1.5,6.9)* 8.3 (1.1,37.7)* 0.08 (0.03,0.12)*
Gol vs Ada 0.8 (0.5,1.2) 0.8 (0.4,1.2) 0.9 (0.4,2.2) -0.02 (-0.06,0.02)
Gol vs Inf 0.9 (0.6,1.5) 1.2 (0.7,2.0) 1.7 (0.7,4.1) 0.01 (-0.04,0.05)
Gol vs Eta 0.4 (0.2,0.7)* 0.3 (0.2,0.8)* 0.2 (0.0,1.8) -0.07 (-0.12,-0.02)*
Cert vs Ada 2.5 (1.8,3.6)* 1.7 (1.1,2.6)* 2.1 (0.9,4.7) 0.05 (0.02,0.09)*
Cert vs Inf 3.0 (2.1,4.3)* 2.8 (1.8,4.3)* 3.8 (1.7,8.3)* 0.08 (0.05,0.12)*
Cert vs Eta 1.2 (0.7,2.0) 0.8 (0.4,1.8) 0.5 (0.1,3.6) 0.01 (-0.04,0.05)
Cert vs Gol 3.2 (2.0,5.1)* 2.3 (1.3,3.9)* 2.2 (0.8,6.4) 0.08 (0.03,0.12)*
σ 0.2 (0.0,0.4) 0.2 (0.0,0.4) 0.5 (0.0,0.8) 0.03 (0.01,0.04)
DMARDs and year of publication. None of these were found to have a significant impact and therefore were not included in the main analysis.
Different prior distributions on the between trial vari-ance parameter allowing for a wider range of values were tested, but did not alter the conclusions. Varying the pre-cision parameter of the normal prior distributions for the remaining parameters between 1,000 and 100,000 did not alter the results either.
The continuous ACR response underlying the binary ACR 20, ACR 50 and ACR 70 measures is estimated using the mean ACRcont response for each of the four respon-der groups. For the baseline analysis meanACR was used as the underlying continuous effect. In a sensitivity analy-sis a model was fit using the ACR hybrid as the underlying effect. This did not alter the results much, however, adal-imumab was not found to be superior to infliximab in this scenario. There was substantial uncertainty regard-ing the mean ACRcont response in the control arms, as no patient level data was available. An additional model has been fit assuming the mean response in each group to be the same for treatment arms and control arms. While this did influence the biologic treatment effect versus control, the relative efficacy between biologic treat-ments was not affected much. Again, these models did not detect a difference between adalimumab and inflix-imab. Outcomes of the various MTCs can be accessed in Additional file 3.
The scale chosen for dichotomized outcome measures has been shown to influence outcomes of MTC models [50]. In addition to the OR scale we therefore also fitted an analysis based on risk ratios (RRs). The OR model can be adapted to estimate RRs making a few changes, for further details see Schmitz et al. [23]. The results can be accessed in Additional file 4; the findings of increased power of continuous outcomes are confirmed.
Limitation
Doses across treatments and treatment arms varied, which has not been accounted for in the analysis. Gen-eralising the model to include a meta-regression for dose would raise difficulties of comparability; doses across treatments are hard to compare as well as within one treatment when the same dose is given, but with different frequency.
The analysis only includes RCT evidence. However, there exists a large body of observational data collected via registries and open label studies. The inclusion of such evidence is possible within this framework, helping to reduce uncertainty further [51].
Patient level data allowed the estimation of mean ACR response within each of the responder groups. While this provided some additional information towards estimating the continuous ACR response measure, it did not replace
the full information lost. The estimated ACRcont mea-sure is still subject to high uncertainty. Patient level data of the RCTs included in the analysis would allow the exact calculation of the continuous ACR measure.
The evidence network has a star design, which does not allow testing of the assumption of treatment exchangeability. Baseline characteristics across the tri-als were compared and and the model was extended to a meta-regression to explain the potential influence of differing demographics.
This paper confirms the effectiveness of anti-TNF agents in the treatment of RA. The study illustrates the enhanced ability to detect differences between treatments when using continuous measures and shows the high dependency of MTC outcomes on the cut-off level when using binary data.
Rather than steering away from binary measures, we would like to advocate the additional reporting of under-lying continuous effect measures in clinical trials to facil-itate further analyses. The importance of the involvement of statisticians in the choice of clinical measures has been recently highlighted [10].
Additional files
Additional file 1: Bugs code.Additional file providing the WinBUGs code and input data for the MTC model.
Additional file 2: Baseline Demographics.Mean Baseline Demographics of randomized controlled trials for anti-TNF agents. Additional file 3: Sensitivity Analysis (1).Additional file providing outcomes of the sensitivity analysis conducted on the continuous ACR measure.
Additional file 4: Sensitivity Analysis (2).Additional file providing outcomes of the sensitivity analysis conducted on the risk ratio scale.
Competing interests
The authors declare that they have no competing interests.
Authors’ contributions
SS is responsible for the study concept and design, designed and
implemented the MTC models and participated in the systematic review and data extraction. RR is responsible for the study concept and design and carried out the systematic review and data extraction. CW oversaw the design and implementation of the MTC models. All authors contributed to the interpretation of findings. All authors read and approved the final manuscript.
Author details
1Department of Statistics, Trinity College Dublin, Dublin, Ireland.2National
Centre for Pharmacoeconomics, St. James Hospital, Dublin, Ireland.
Received: 23 May 2012 Accepted: 30 October 2012 Published: 6 November 2012
References
1. Sutton A, Higgins JPT:Recent developments in meta-analysis.Stat Med2008,27:625–650.
2. Lu G, Ades AE:Combination of direct and indirect evidence in mixed treatment comparisons.Stat Med2004,23:3105–3124.
4. Royston P, Altman D, Sauerbrei W:Dichotomizing continuous predictors in multiple regression: a bad idea.Stat Med2006, 25:127–141.
5. Austin P, Brunner L:Inflation of the type I error rate when a continuous confounding variable is categorized in logistic regression analyses.Stat Med2004,23:1159–1178. 6. Chen H, Cohen P, Chen S:Biased odds ratios from
dichotomization of age.Stat Med2007,26:2487–3497.
7. Sauerbrei W, Royston P, Zapien K:Detecting an interaction between treatment and a continuous covariate: A comparison of two approaches.Comput Stat Data Anal2007,51:4054–4063. 8. Breitling L, Brenner H:Odd odds interactions introduced through
dichotomisation of continuous outcomes.J Epidemiol Community Health2010,64:300–303.
9. Dawson N, Weiss R:Dichotomizing continuous variables in statistical analysis: a practice to avoid.Med Decision Making2012,32:225–226. 10. Senn S, Julious S:Measurement in clinical trials: A neglected issue for
statisticians?Stat Med2009,28:3189–3209.
11. Julious S, George S, Machin D, Stephens R:Sample sizes for randomized trials measuring quality of life in cancer patients.Qual Life Res1997, 6:109–117.
12. Hutton J, McGrath C, Frybourg J, Tremblay M, Bramley-Harker E, Henshall C:Framework for describing and classifying decision-making systems using technology asesessment to determine the reimbursement of health technologies (fourth hurdle systems). Int J Technol Assess Health Care2006,22:10–18.
13. Klareskog L, Catrina A, Paget S:Rheumatoid arthritis.The Lancet2009, 979:659–672.
14. Sutton A, Abrams KR:Bayesian methods in meta-analysis and evidence synthesis.Stat Methods Med Res2001,10:277–303. 15. Nixon R, Bansback N, Brennan A:Using mixed treatment comparisons
and meta-regression to perform indirect comparisons to estimate the efficacy of biologic treatments in rheumatoid arthritis. Stat Med2007,26:1237–1254.
16. Jansen J, Crawford B, Bergman G, Stam W:Bayesian meta-analysis of multiple treatment comparisons: an introduction to mixed treatment comparisons.Value in Health2008,11:956–964.
17. Saag K, Teng G, Patkar N, Anuntiyo J, Finney C, Curtis J, Paulus H, Mudano A, Piso M, Elkins-Melton M, Outman R, Allison J, Suarez Almazor M, Bridges A, Chatham W, Hochberg M, Maclea C, Mikuls T, Moreland L, O’Dell J, Turkiewicz A, Furst D:American College of Rheumatology 2008 Recommendations for the use of nonbiologic and biologic disease-modifying antirheumatic drugs in rheumatoid arthritis. Arthritis & Rheumatism2008,59:762–784.
18. Felson D, Anderson J, Boers M, Combarier C, Furst D, Goldsmith C, Katz L, Lightfoot R, Paulus H, Strand V, Tugwell P, Weinblatt M, Williams H, Wolfe F, Kieszak S:American College of Rheumatology preliminary definition of improvement in rheumatoid arthritis.Arthritis & Rheumatism1995,38:727–735.
19. Van Riel P, van Gelstel A:Clinical outcome measures in rheumatoid arthritis.Ann Rheumatic Diseases2000,59:128–131.
20. American College of Rheumatology:A proposed revision to the ACR20: The hybrid measure of american college of rheumatology response.Arthritis & Rheumatism2007,57:193–202.
21. Prevoo M, van’t Hof M, Kuper H, van Leeuwen M, van de Putte L, van Riel P:Modified disease activity scores that include twenty-eight-joint counts. Development and validation in a prospective longitudinal study of patients with rheumatoid arthritis.Arthritis & Rheumatism
1995,38:44–48.
22. Moher D, Liberati A, Tetzlaff J, Altman D, PRISMA Group:Preferred reporting items for systematic reviews and meta-analyses: the PRISMA statement.PLoS Medicine2009,6:e1000097.
23. Schmitz S, Adams R, Walsh C, Barry M, FitzGerald O:A mixed treatment comparison of the efficacy of anti-TNF agents in rheumatoid arthritis for methotrexate non-responders demonstrates differences between treatments: a Bayesian approach.Ann rheumatic diseases2012,71:225–230.
24. Dias S, Welton N, Caldwell D, Ades A:Checking consistency in mixed treatment comparison meta-analysis.Stat Med2010,
29:932–944.
25. Bucher HC, Guyatt GH, Griffith LE, Walter SD:The results of direct and indirect treatment comparisons in meta-analysis of randomized controlled trials.J Clin Epidemiol1997,50:683–691.
26. Lumley T:Network meta-analyis for indirect treatment comparisons. Stat Med2002,21:2313–2324.
27. Hyrich K, Watson K, Silman A, Symmons D, The BSR Biologics Register: Predictors of response to anti-TNF-αtherapy among patients with rheumatoid arthritis: results from the British Society for
Rheumatology Biologics Register.Rheumatology2006,45:1558–1565. 28. Warn D, Thompson D, Spiegelhalter D:Bayesian random effects
meta-analysis of trials with binary outcomes: methods forthe absolute risk difference and relative risk scales.Stat Med2002,21:1601–1623. 29. Gelman A:Prior distributions for variance parameters in hierarchical
models.Bayesian analysis2006,1:133–151.
30. Lunn D, Thomas A, Best N, Spiegelhalter D:WinBUGS – a Bayesian modelling framework: concepts, structure, and extensibility.Stat Comput2000,10:325–337.
31. Weinblatt M, Keystone E, Furst D, Moreland L, Weisman M, Birbara C, Teoh L, Fischkoff S, Chartash E:Adalimumab, a fully human anti-tumour necrosis factor alpha monoclonal antibody, for the treatment of rheumatoid arthritis in patients taking concomitant methotrexate: the ARMADA trial.Arthitis & Rheumatism2003,48:35–45.
32. Keystone E, Kavanaugh A, Sharp J, Tannenbaum H, Hua Y, Teoh L, Fischkoff S, Chartash E:Radiographic, clinical, and functional outcomes of treatment with adalimumab (a human anti-tumor necrosis factor monoclonal antibody) in patients with active rheumatoid arthritis receiving concomitant methotrexate therapy: A randomized, placebo-controlled, 52-week trial.Arthritis & Rheumatism2004,50:1400–1411.
33. Van De Putte L, Atkins C, Malaise M, Sany J, Russell A, van Riel P, Settas L, Bijlsma J, Todesco A, Dougados M, Nash P, Emery P, Walter N, Kaul M, Fischkoff A, Kupper H:Efficacy and safety of adalimumab as monotherapy in patients with rheumatoid arthritis for whom previous disease modifying antirheumatic drug treatment has failed.Ann Rheumatic Diseases2004,63:508–516.
34. Miyasaka N:Clinical investigation in highly disease-affected rheumatoid arthritis patients in Japan with adalimumab applying standard and general evaluation: the CHANGE study.Modern Rheumatology2008,18:252–262.
35. Kim H, Lee K, Song Y, Dae-Hyun Y, Koh E, Yoo B, Luo A:A randomized, double-blind, placebo-controlled, phase III study of the human anti-tumor necrosis factor antibody adalimumab administered as subcutaneous injections in Korean rheumatoid arthritis patients treated with methotrexate.APLAR J Rheumatology2007,10:9–16. 36. Maini R, St Clair E, Breedveld F, Furst D, Kalden J, Weisman M, Smolen J,
Emery P, Harriman G, Feldmann M, Lipsky P:Infliximab (chimeric anti-tumour necrosis factor [alpha] monoclonal antibody) versus placebo in rheumatoid arthritis patients receiving concomitant methotrexate: a randomised phase III trial.The Lancet1999, 353:1932–1939.
37. Westhovens R, Yocum D, Han J, Berman A, Strusberg I, Geusens P, Rahman M:The safety of infl iximab, combined with background treatments, among patients with rheumatoid arthritis and various comorbidities: a large, randomized, placebo-controlled trial.Arthritis & Rheumatism2006,54:1075–1086.
38. Zhang F, Hou Y, Huang F, Wu D, Bao C, Ni L, Yao C:Infliximab versus placebo in rheumatoid arthritis patients receiving concomitant methotrexate: A preliminary study from China.APLAR J Rheumatology
2006,9:127–130.
39. Schiff M, Keiserman M, Codding C, Songcharoen A, Berman A, Nayiager S, Saldate C, Li T, Aranda R, Becker J, Lin C, Cornet P, Dougados M:Efficacy and safety of abatacept or infliximab vs placebo in ATTEST: a phase III, multi-centre, randomised, double-blind, placebo-controlled study in patients with rheumatoid arthritis and an inadequate response to methotrexate.Ann rheumatic diseases2008,67:1096–1103. 40. Moreland L, Schiff M, Baumgartner A, Tindall E, Fleischmann R, Bulpitt K,
41. Weinblatt M, Kremer J, Bankhurst A, Bulpitt K, Fleischmann R, Fox R, Jackson C, Lange M, Burge D:A trial of etanercept, a recombinant tumor necrosis factor receptor:Fc fusion protein, in patients with rheumatoid arthritis receiving methotrexate.New England J Med
1999,340:253–259.
42. Keystone E, Genovese M, Klareskog L, Hsia E, Hall A, Miranda P, Pazdur J, Bae S, Palmer W, Zrubek J, Wiekowski M, Visvanathan S, Wu Z, Rahman M: Golimumab, a human antibody to tumour necrosis factor (alpha) given by monthly subcutaneous injections, in active rheumatoid arthritis despite methotrexate therapy: The GO-FORWARD Study. Ann Rheumatic Diseases2009,68:769–289.
43. Kay J, Matteson E, Dasgupta B, Nash P, Durez P, Hall A, Hsia E, Han J, Wagner C, Xu Z, Visvanathan S, Rahman M:Golimumab in patients with active rheumatoid arthritis despite treatment with methotrexate: a randomized, doubleblind, placebo-controlled, dose-ranging study. Arthritis & Rheumatism2008,58:964–975.
44. Keystone E, Van Der Heijde D, Mason D, Landewe R, van Vollenhoven R, Combe B, Emery P, Strand V, Mease P, Desai C, Pavelka K:Certolizumab pegol plus methotrexate is significantly more effective than placebo plus methotrexate in active rheumatoid arthritis: Findings of a fifty-two-week, phase III , multicenter, randomized,
double-blind, placebo-controlled, parallel-group study.Arthritis & Rheumatism2009,58:3319–3329.
45. Smolen J, Landewe R, Mease P, Brzezicki J, Mason D, Luijtens K, van Vollenhoven R, Kavanaugh A, Schiff M, Burmester G, Strand V, Vencovsky J, van der Heijde D:Efficacy and safety of certolizumab pegol plus methotrexate in active rheumatoid arthritis: the RAPID 2 study. A randomised controlled trial.Ann rheumatic diseases2008,68:797–804. 46. Fleischmann R, Vencovsky J, Van Vollenhoven R, Borenstein D, Box J,
Coteur G, Goel N, Brezinschek H, Innes A, Strand V:Efficacy and safety of certolizumab pegol monotherapy every 4 weeks in patients with rheumatoid arthritis failing previous disease-modifying antirheumatic therapy: the FAST4WARD study.Ann rheumatic diseases2009,68:805–8011.
47. Adams R, Walsh C, Veale D, Bresnihan B, FitzGerald O, Barry M: Understanding the relationship between the EQ-5D, SF-6D, HAQ and disease activity in inflammatory arthritis.Pharmacoeconomics
2010,28:477–487.
48. Bennette C, Vickers A:Against quantiles: categorization of continuous variables in epidemiologic research, and its discontents.BMC Med Res Methodology2012,12:21.
49. Hasselblad V, Hedges L:Meta-analyses of screening and diagnostic tests.Quant Methods Psychology1995,117:167–178.
50. Caldwell D, Welton N, Dias S, Ades A:Selecting the best scale for measuring treatment effect in a network meta-analysis: a case study in childhood nocturnal enuresis.Res Synth Methods2012,3:126–141. 51. O’Rourke K, Walsh C, Hutchinson M:Outcome of beta-interferon
treatment in relapsing-remitting multiple sclerosis: a Bayesian analysis.J Neurology2007,254:1547–1554.
doi:10.1186/1471-2288-12-167
Cite this article as:Schmitzet al.:The use of continuous data versus binary data in MTC models: A case study in rheumatoid arthritis.BMC Medical Research Methodology201212:167.
Submit your next manuscript to BioMed Central and take full advantage of:
• Convenient online submission
• Thorough peer review
• No space constraints or color figure charges
• Immediate publication on acceptance
• Inclusion in PubMed, CAS, Scopus and Google Scholar
• Research which is freely available for redistribution