R E S E A R C H
Open Access
Decitabine alters the expression of
Mecp2
isoforms
via
dynamic DNA methylation at the
Mecp2
regulatory elements in neural stem cells
Vichithra R B Liyanage, Robby M Zachariah and Mojgan Rastegar
*Abstract
Background:Aberrant MeCP2 expression in brain is associated with neurodevelopmental disorders including autism. In the brain of stressed mouse and autistic human patients, reduced MeCP2 expression is correlated with Mecp2/MECP2promoter hypermethylation. Altered expression of MeCP2 isoforms (MeCP2E1 and MeCP2E2) is associated with neurological disorders, highlighting the importance of proper regulation of both isoforms. While known regulatory elements (REs) within theMECP2/Mecp2 promoter and intron 1 are involved inMECP2/Mecp2 regulation,Mecp2isoform-specific regulatory mechanisms are unknown.We hypothesized that DNA methylation at these REs may impact the expression ofMecp2isoforms.
Methods:We used a previously characterizedin vitrodifferentiating neural stem cell (NSC) system to investigate the interplay betweenMecp2isoform-specific expression and DNA methylation at theMecp2REs. We studied altered expression ofMecp2isoforms, affected by global DNA demethylation and remethylation, induced by exposure and withdrawal of decitabine (5-Aza-2′-deoxycytidine). Further, we performed correlation analysis between DNA methylation at theMecp2REs and the expression ofMecp2isoforms after decitabine exposure and withdrawal.
Results:At different stages of NSC differentiation,Mecp2isoforms showed reciprocal expression patterns associated with minor, but significant changes in DNA methylation at theMecp2REs. Decitabine treatment inducedMecp2e1/ MeCP2E1 (but notMecp2e2) expression at day (D) 2, associated with DNA demethylation at theMecp2REs. In contrast, decitabine withdrawal downregulated bothMecp2isoforms to different extents at D8, without affecting DNA
methylation at theMecp2REs. NSC cell fate commitment was minimally affected by decitabine under tested conditions. Expression of both isoforms negatively correlated with methylation at specific regions of theMecp2 promoter, both at D2 and D8. The correlation between intron 1 methylation andMecp2e1(but notMecp2e2) varied depending on the stage of NSC differentiation (D2: negative; D8: positive).
Conclusions:Our results show the correlation between the expression ofMecp2isoforms and DNA methylation in differentiating NSC, providing insights on the potential role of DNA methylation at theMecp2REs inMecp2 isoform-specific expression. The ability of decitabine to induceMecp2e1/MeCP2E1, but notMecp2e2suggests differential sensitivity ofMecp2isoforms to decitabine and is important for future drug therapies for autism.
Keywords:Epigenetics,Mecp2e1,Mecp2e2, Decitabine/5-aza-2′-deoxycytidine, DNA methylation, Autism
* Correspondence:[email protected]
Regenerative Medicine Program, Department of Biochemistry and Medical Genetics, Faculty of Medicine, University of Manitoba, Rm. 627, Basic Medical Sciences Bldg., 745 Bannatyne Avenue, Winnipeg, Manitoba R3E 0J9, Canada
Background
Methyl CpG Binding Protein 2 (MeCP2) is a key tran-scriptional regulator in the brain [1].MECP2 mutations and expression deficits result in a broad range of neuro-developmental disorders, including Rett syndrome (RTT) and autism spectrum disorders [2,3]. In mice (Mecp2) and humans (MECP2), alternative splicing of a single gene leads to the generation of two protein isoforms MeCP2E1 and MeCP2E2 (mature transcripts for Mecp2e1 and Mecp2e2 are shown in Figure 1A) [4,5]. We and others have shown differential expression of the two Mecp2/ MeCP2 isoforms in mouse brain [5-7]. Recent studies sug-gest that MeCP2E1 is the most relevant isoform for RTT pathology [8,9]. Moreover, overexpression of Mecp2e2, but notMecp2e1, promotes neuronal cell death [10], im-plicating the importance of proper regulation of both Mecp2isoforms in the brain.
In RTT mouse models, transgenic expression of either Mecp2isoform can rescue RTT phenotypes to different extents [14,15]. However, gene therapy delivery of MECP2 into the affected cells or drug therapies to in-duceMECP2 expression has to be carried out with cau-tion, as even mild overexpression of MeCP2 can lead to progressive neurological disorders [16,17]. Currently,
limited knowledge exists on MECP2/Mecp2 regulation, with no specific knowledge on possible differential MECP2/Mecp2isoform-specific regulatory mechanisms.
MECP2/Mecp2 gene expression is known to be regu-lated by regulatory elements (REs) within the promoter and a silencer element within the Mecp2 intron 1 [12,13,18] (Figure 1B). Implying the role of DNA methy-lation inMECP2regulation, reduced MECP2expression in the brains of male autistic patients correlates with hu-man MECP2 promoter hypermethylation [2,19]. More-over, reducedMecp2 expression in the postnatal murine brain in response to early maternal separation and stress is associated with hypermethylation of the mouseMecp2 promoter [20]. However, possible differential impact of DNA methylation on MECP2/Mecp2 isoforms is cur-rently unknown. DNA methylation is a major epigenetic modification that controls gene expression without af-fecting the underlying DNA sequences (reviewed in [21,22]). DNA methylation at the cytosine residues (5-methylcytosine (5mC)) of the CpG dinucleotides is car-ried out by DNA methyltransferases (DNMT) and is generally considered to be a repressive epigenetic modifica-tion [1,23]. Conversely, 5-hydroxymethylcytosine (5hmC), which is generated by oxidation of 5mC by TET proteins
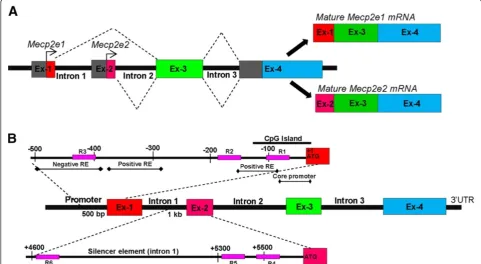
Figure 1Schematics of the Methyl CpG binding protein 2 gene (Mecp2),Mecp2e1/e2transcripts, and known regulatory elements (REs). (A)Generation of MeCP2 isoforms by alternative splicing; matureMecp2e1transcripts comprise of exons 1, 3, and 4. MatureMecp2e2transcripts comprise of exons 2, 3, and 4 (adapted from [4,11]). Exons are denoted as Ex.(B)Regulatory elements of theMECP2/Mecp2gene. TheMECP2/
Mecp2gene is reported to be regulated by negative and positive REs within the promoter and a silencer element within the intron 1 (information
is generally considered to be an active epigenetic mark [24,25]. Promoter methylation is mostly associated with gene silencing [26], while DNA methylation at both in-tronic and exonic regions are shown to correlate with isoform-specific transcription by alternative splicing or by utilizing alternate promoters [27,28].
Treatment with DNA demethylating agents orDNMT/ Dnmtinhibitors such as decitabine (also called 5-Aza-2′ -deoxycytidine) is a commonly used method to study the role of DNA methylation in gene expression [29,30]. While exposure to decitabine results in DNA demethyla-tion, its subsequent withdrawal causes remethylation or methylation reprogramming [29], providing an excellent platform to uncover the role of DNA methylation in gene expression.
In vitrodifferentiation of neural precursor cells/neural stem cells (NSC) into different brain cell types is utilized as an acceptable model system to mimic the in vivo neural development [31-36]. Previously, we used a simi-lar in vitroNSC differentiation system to report the first preclinicalMECP2 isoform-specific gene therapy vectors, for future gene therapy applications in Rett syndrome [35]. Further, we introduced differentiating NSC as a suit-ablein vitromodel to study the expression and function of developmentally important genes such asMeis1in neural development [37]. In the current study, we used this previ-ously characterized system to study the expression and regulation ofMecp2isoforms during NSC differentiation.
Investigation of MECP2/MeCP2 expression and func-tion in neurodevelopmental disorders has been the focus of intensive research. However, despite the critical im-portance of precisely controlled levels of MeCP2 expres-sion in the brain, the underlying regulatory mechanisms have been understudied. Here, we report the correlation between the expression of Mecp2 isoforms and DNA methylation patterns at the Mecp2 REs at different stages of NSC differentiation. Further, we demonstrate the effect of dynamic changes in DNA methylation in-duced by exposure and withdrawal of decitabine on the expression ofMecp2/MeCP2 isoforms.
Methods Ethics statement
All experiments were performed in accordance with the standards of the Canadian Council on Animal Care with the approval of the Office of Research Ethics of University of Manitoba. All experimental procedures were reviewed and approved (protocol number 12–031) by the University of Manitoba Bannatyne Campus Protocol Management and Review Committee.
Neural stem cell isolation, culture and differentiation Embryonic mouse forebrain-derived NSC were isolated from the forebrains of CD-1 mice at embryonic day (E)
14.5 and were cultured according to previously described methods [35,37]. Briefly, dissected forebrain tissues were mechanically homogenized in NSC media DMEM/F12 1:1 (Wisent, Quebec, Canada) containing HEPES, glu-tamine, antibiotic/antimycotic, glucose, recombinant hu-man epidermal growth factor (rhEGF) (Sigma Aldrich, Oakville, Ontario, Canada, 20 ng/ml), basic fibroblast growth factor (bFGF) (Upstate (Millipore), Billerica, MA, USA, 20 ng/ml), heparin (Sigma Aldrich, Oakville, Ontario, Canada, 2 μg/ml) and hormone mix. Dissoci-ated single cells were plDissoci-ated at a density of 105cells/cm2 in NSC media. The media were refreshed every 48 h and cells were cultured under these conditions for 7 days to generate neurospheres. Primary neurospheres were gen-tly dissociated to single cells by accutase treatment. Dis-sociated cells were plated on plates coated with growth factor-reduced matrigel (BD Biosciences, Mississauga, Ontario, Canada) at a density of 105cells/cm2in DMEM (GIBCO, Life Technologies Inc, Burlington, Ontario, Canada) and 10% Fetal Bovine Serum (Invitrogen, Life Technologies Inc, Burlington, Ontario, Canada) in the absence of rhEGF and bFGF. Cells were differentiated for 8 days, reported to be sufficient for differentiation of neuronal and glial cells [35,37], and media were changed every other day.
Decitabine treatment
At the onset of differentiation on day zero (D0), dissoci-ated NSC were tredissoci-ated with 2.5μM decitabine for 48 h. After two days (D2), the media were replaced with fresh media that was refreshed every other day for an extra 6 days (until D8). Control cells were cultured under simi-lar experimental conditions, in the absence of decitabine.
quantitative reverse transcription PCR (qRT-PCR) forXist (X-inactive specific transcript) gene, as previously described, with minor modifications [39]. The PCR program forXist included an initial denaturation at 95°C for 5 minutes; followed by 35 cycles of 95°C for 30 s, 53°C for 30 s, 72°C for 30 s, and 78°C for 30 s.
Quantitative reverse transcription polymerase chain reaction RNeasy Mini Kit (Qiagen, Ontario, Toronto, Canada) was used for RNA extraction as per the manufacturer’s
protocol. Preparation of cDNA and qRT-PCR were car-ried out as described previously [40-42]. Transcript levels of Mecp2 (total), Mecp2e1 [NCBI: NM_001081979.1], Mecp2e2 [NCBI: NM_010788.3], Dnmt genes (Dnmt1, Dnmt3aand Dnmt3b), neuronal genes (Tubulin III (Tub III), NeuN), astrocytic genes (Gfap, S100b), and oligo-dendrocyte-specific genes (Cnpase, Mbp) were examined by using gene-specific primers (Table 2), as described pre-viously [37,43]. The relative expression and fold changes were calculated as described previously [37]. Two-way analysis of variance (ANOVA) and the Studentt-test were used to calculate significant differences between untreated control and decitabine-treated samples.
Immunofluorescence experiments
Immunofluorescence (IF) experiments were performed according to previously described protocols [7,35,37]. Primary and secondary antibodies used for IF are listed Table 1 List of primers used for PCR
Gene Direction Sequence Reference
Sry Forward 5′-TGGGACTGGTGACAATTGTC-3′ [38] Reverse 5′-GAGTACAGGTGTGCAGCTCT-3′
Il3 Forward 5′-GGGACTCCAAGCTTCAATCA-3′ Reverse 5′-GGAGGAGGAAGAAAAGCAA-3′
Table 2 List of primers used for qRT-PCR
Gene Direction Sequence Reference
Mecp2(total) Forward 5′-GGTAAAACCCGTCCGGAAAATG-3′ [4]
Reverse 5′-TTCAGTGGCTTGTCTCTGAG-3′
Mecp2e1 Forward 5′-AGGAGAGACTGGAGGAAAAGT-3′ [5]
Reverse 5′-CTTAAACTTCAGTGGCTTGTCTCTG-3′
Mecp2e2 Forward 5′-CTCACCAGTTCCTGCTTTGATGT-3′
Reverse 5′-CTTAAACTTCAGTGGCTTGTCTCTG-3′
Tubulin III (Tub III) Forward 5′-TCAGCGATGAGCACGGCATA-3′ [37]
Reverse 5′-CACTCTTTCCGCACGACATC-3′
Gfap Forward 5′-GCTCACAATACAAGTTGTCC-3′
Reverse 5′-ACCTAATTACACAGAGCCAGG-3′
Gapdh Forward 5′-AACGACCCCTTCATTGAC-3′ [43]
Reverse 5′-TCCACGACATACTCAGCAC-3′
NeuN Forward 5′-GGCAATGGTGGGACTCAAAA-3′ [44]
Reverse 5′-GGGACCCGCTCCTTCAAC-3′
S100b Forward 5′-GCTGACCACCATGCCCCTGTAG-3′ [45]
Reverse 5′-CTGGCCATTCCCTCCTCTGTC-3′
Mbp Forward 5′-GGCACGCTTTCCAAAATCT-3′ [46]
Reverse 5′-CCATGGGAGATCCAGAGC-3′
Cnpase Forward 5′-CATCCTCAGGAGCAAAGGAG-3′ [47]
Reverse 5′-TGAATAGCGTCTTGCACTCG-3′
Dnmt1 Forward 5′-AGGGAAAAGGGAAGGGCAAG-3′ [48]
Reverse 5′-AGAAAACACATCCAGGGTCCG-3′
Dnmt3a Forward 5′-CAGCGTCACACAGAAGCATATCC-3′
Reverse 5′-GGTCCTCACTTTGCTGAACTTGG-3′
Dnmt3b Forward 5′-CCTGCTGAATTACTCACGCCCC-3′
Reverse 5′-GTCTGTGTAGTGCACAGGAAAA-3′
Xist Forward 5′-TTGTGGCTTGCTAATAAT-3′ [39]
in the Tables 3 and 4, respectively. Immunofluorescence signals were detected by an Axio Observer Z1 inverted microscope and LSM710 Confocal microscope from Carl Zeiss. Images were obtained with AxioVision 4.8 (Carl Zeiss Canada Ltd. Ontario, Toronto, Canada) and Zen 2009 software and assembled using Adobe Photoshop CS5 and Adobe Illustrator CS5. For quantification ana-lysis in neurospheres, three neurospheres were randomly selected and all of the cells within each neurosphere were counted based on 4',6-diamidino-2-phenylindole (DAPI) staining. For cell quantification of differentiating cells at D2 and D8, 8 to 10 random fields were selected under the microscope. Approximately 250 cells from the D2 population and 750 cells from the D8 population were counted based on DAPI labeling. The cell counting was done using the ImageJ program.
Nuclear extractions and western blotting
Nuclear extraction from D2 and D8 NSC were carried out using the NE-PER Nuclear and Cytoplasmic Extraction Kit (Thermo Scientific, Ontario, Toronto, Canada), as per the manufacturer’s instructions. Western blot (WB) experiments were conducted according to previously described protocols [49-51], and quantification of the signals was performed as reported [7]. ACTIN or glyceraldehyde-3-phosphate dehydrogenase (GAPDH) was used as a loading control. Studentt-test was used to determine statistical significance between control and treated cells. Primary and secondary antibodies used for WB are listed in the Tables 3 and 4, respectively.
DNA dot blot assay for 5mC and 5hmC
Genomic DNA was isolated using the DNeasy Blood and Tissue kit (Qiagen, Ontario, Toronto, Canada). DNA dot blot was performed using a previously described protocol [52], with minor modifications. The DNA blotted mem-branes were probed with either 5mC or 5hmC antibody (Tables 3 and 4). Total DNA levels were detected by stain-ing the same membrane with 0.02% methylene blue (MB) in 0.3μM sodium acetate (pH 5.2). Adobe Photoshop CS5 software was used to quantify dot blot signals.
Bisulfite pyrosequencing
Genomic DNA was isolated as described in the previous section. Primer design and bisulfite pyrosequencing ex-periments were conducted as a service by The Hospital for Sick Children (SickKids), Toronto, Canada, as re-ported elsewhere [53], using the primers listed in Table 5. The regions analyzed for the methylation patterns are shown in Figure 1B. Specific CpG dinucleotides that are analyzed within each region are shown in Additional file 1.
Correlation analysis
The correlation between DNA methylation at theMecp2 REs and expression of Mecp2isoforms was determined using the Pearson’s correlation analysis and linear regres-sion. The Pearson’s correlation coefficient (r) was calcu-lated for average methylation against eachMecp2isoform, over entire regions and for individual CpG sites within each region. The strength of correlation was considered as follows: weak, 0 <r <0.3; moderate, 0.3 <r <0.4; strong,
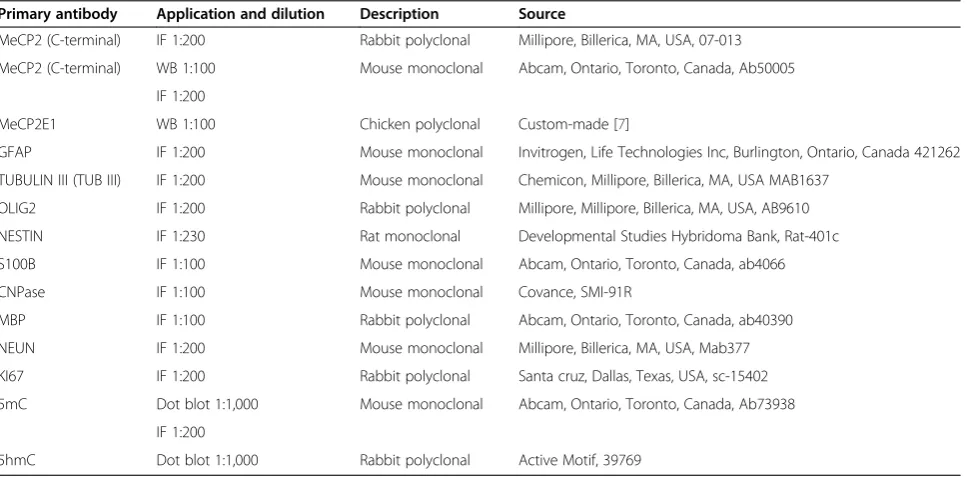
Table 3 Primary antibodies used
Primary antibody Application and dilution Description Source
MeCP2 (C-terminal) IF 1:200 Rabbit polyclonal Millipore, Billerica, MA, USA, 07-013
MeCP2 (C-terminal) WB 1:100 Mouse monoclonal Abcam, Ontario, Toronto, Canada, Ab50005
IF 1:200
MeCP2E1 WB 1:100 Chicken polyclonal Custom-made [7]
GFAP IF 1:200 Mouse monoclonal Invitrogen, Life Technologies Inc, Burlington, Ontario, Canada 421262
TUBULIN III (TUB III) IF 1:200 Mouse monoclonal Chemicon, Millipore, Billerica, MA, USA MAB1637
OLIG2 IF 1:200 Rabbit polyclonal Millipore, Millipore, Billerica, MA, USA, AB9610
NESTIN IF 1:230 Rat monoclonal Developmental Studies Hybridoma Bank, Rat-401c
S100B IF 1:100 Mouse monoclonal Abcam, Ontario, Toronto, Canada, ab4066
CNPase IF 1:100 Mouse monoclonal Covance, SMI-91R
MBP IF 1:100 Rabbit polyclonal Abcam, Ontario, Toronto, Canada, ab40390
NEUN IF 1:200 Mouse monoclonal Millipore, Billerica, MA, USA, Mab377
KI67 IF 1:200 Rabbit polyclonal Santa cruz, Dallas, Texas, USA, sc-15402
5mC Dot blot 1:1,000 Mouse monoclonal Abcam, Ontario, Toronto, Canada, Ab73938
IF 1:200
5hmC Dot blot 1:1,000 Rabbit polyclonal Active Motif, 39769
0.4 <r<0.7; or very strong, 0.7 <r<1.0. A negativer-value indicates an inverse/negative correlation whereas a posi-tiver-value indicates direct/positive correlation. Statistical significance was determined atP<0.05.
Results
Dynamic expression ofMecp2isoforms during NSC differentiation and DNA methylation patterns at the
Mecp2regulatory elements
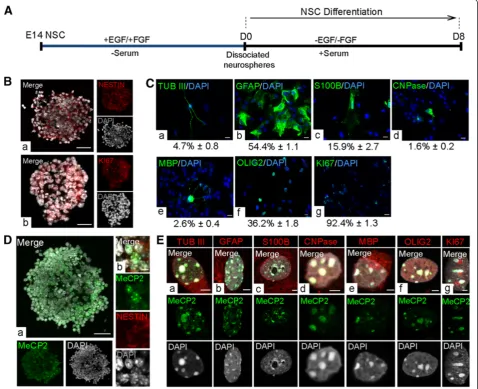
Primary neural stem cells were isolated from the embry-onic forebrain at E14.5 and were cultured in the presence of growth factors to generate primary neurospheres. After 7 days in culture, primary neurospheres were dissociated and cultured under differentiation conditions for 8 days, reported to be sufficient for differentiation of both neur-onal and glial cells [35,37] (Figure 2A). In agreement with
our previous report [37] the proliferating primary neuro-spheres expressed NESTIN and KI67 (Figure 2B). Similar to our previous reports [35,37] differentiated NSC at D8 consisted of a mixed population of neurons, astrocytes, and oligodendrocytes (Figure 2C). The composition of the D8 population was determined by detection of cell type-specific markers (TUB III (4.7% ± 0.8 mean ± standard error of the mean (SEM)), Glial fibrillary acidic protein (GFAP) (54.4% ± 1.1), S100B (15.9% ± 2.7), 2',3'-Cyclic-nu-cleotide 3'-phosphodiesterase (CNPase) (1.6% ± 0.2), Myelin basic protein (MBP) (2.6% ± 0.42), Oligodendrocyte lineage transcription factor 2 (OLIG2) (36.2% ± 1.8) and KI67 (92.4% ± 1.3)) by immunofluorescence (Figure 2C). KI67 is not a cell type-specific marker, but rather reflects the frac-tion of cycling cells within differentiating NSC. Indi-cating that the cells at an early stage of differentiation Table 4 Secondary antibodies used
Secondary antibody Application and dilution Source
FITC conjugated goat anti rabbit IgG IF 1:400 Jackson Immunoresearch, PA, USA, 111-095-144
Rhodamine Red-X conjugated goat anti mouse IgG IF 1:400 Jackson Immunoresearch, PA, USA, 115-259-146
Dylight 649 conjugated goat anti chicken IgY IF 1:400 Jackson Immunoresearch, PA, USA, 103-485-155
Dylight 649 conjugated donkey anti goat IgG IF 1:400 Jackson Immunoresearch, PA, USA, 705-494-147
Alexa Fluor 594 conjugated donkey anti mouse IgG IF 1:1,000 Life Technologies Inc, Ontario, Canada, 987237
Alexa Fluor 448 conjugated donkey anti rabbit IgG IF 1:1,000 Life Technologies Inc, Ontario, Canada, 913921
Peroxidase-Affinipure Gt anti-mouse IgG WB 1:7,500 Jackson ImmunoResearch, PA, USA, 115-035-174
Dot blot 1:7,500
IF, Immunofluorescence; WB, Western blot.
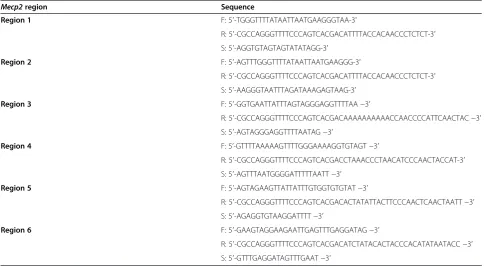
Table 5 Primers used in bisulfite pyrosequencing
Mecp2region Sequence
Region 1 F: 5′-TGGGTTTTATAATTAATGAAGGGTAA-3′
R: 5′-CGCCAGGGTTTTCCCAGTCACGACATTTTACCACAACCCTCTCT-3′
S: 5′-AGGTGTAGTAGTATATAGG-3′
Region 2 F: 5′-AGTTTGGGTTTTATAATTAATGAAGGG-3′
R: 5′-CGCCAGGGTTTTCCCAGTCACGACATTTTACCACAACCCTCTCT-3′
S: 5′-AAGGGTAATTTAGATAAAGAGTAAG-3′
Region 3 F: 5′-GGTGAATTATTTAGTAGGGAGGTTTTAA−3′
R: 5′-CGCCAGGGTTTTCCCAGTCACGACAAAAAAAAAACCAACCCCATTCAACTAC−3′ S: 5′-AGTAGGGAGGTTTTAATAG−3′
Region 4 F: 5’-GTTTTAAAAAGTTTTGGGAAAAGGTGTAGT−3′
R: 5′-CGCCAGGGTTTTCCCAGTCACGACCTAAACCCTAACATCCCAACTACCAT-3′
S: 5′-AGTTTAATGGGGATTTTTAATT−3′
Region 5 F: 5′-AGTAGAAGTTATTATTTGTGGTGTGTAT−3′
R: 5′-CGCCAGGGTTTTCCCAGTCACGACACTATATTACTTCCCAACTCAACTAATT−3′ S: 5′-AGAGGTGTAAGGATTTT−3′
Region 6 F: 5′-GAAGTAGGAAGAATTGAGTTTGAGGATAG−3′
R: 5′-CGCCAGGGTTTTCCCAGTCACGACATCTATACACTACCCACATATAATACC−3′ S: 5′-GTTTGAGGATAGTTTGAAT−3′
are actively dividing, expression of KI67 (98.8% ± 0.8) was also detected in D2 cells (Additional file 2). Our detection of KI67 in the majority of cells at D8 indicates that al-though most differentiating NSC are actively dividing, fewer than 10% of cells are post-mitotic and may include neurons (TUB III+) or non-proliferating cells committed towards neuronal cell fate. Taken together, this in vitro NSC differentiation system provided a suitable model sys-tem consisting of the three main neural cell types (neurons, astrocytes and oligodendrocytes) in the brain to study Mecp2/MeCP2 isoforms during neural differentiation.
we detected MeCP2 in KI67+ cells in the D8 population (Figure 2E, g). The detected nuclear MeCP2 signals were enriched at the heterochromatin-rich regions of all three cell types. These observations are consistent with our pre-vious reports on MeCP2 nuclear expression inin vivo dif-ferentiated primary neurons and astrocytes [7].
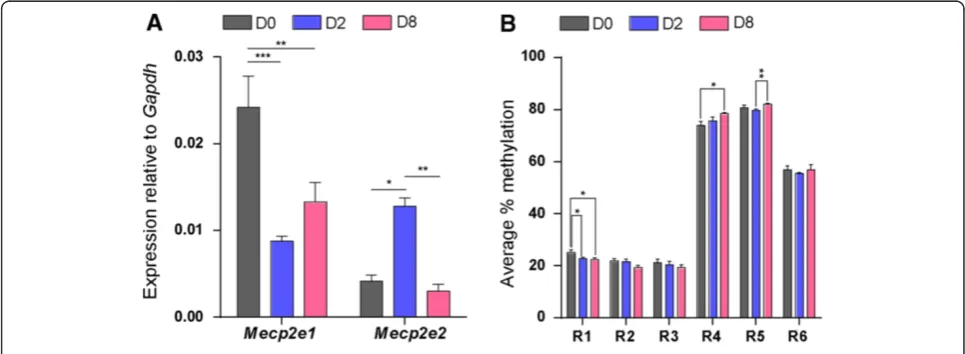
Next, we investigated Mecp2 isoform-specific tran-script expression at three stages of NSC differentiation: undifferentiated cells (D0), cells at an early stage of differ-entiation (D2), and cells at a later stage of differdiffer-entiation (D8). Distinct and mirror-like (reciprocal) transcript ex-pression patterns forMecp2isoforms were observed dur-ing NSC differentiation (D0, D2, and D8) (Figure 3A), suggesting possible differential regulation of these iso-forms during NSC differentiation. Expression ofMecp2e1 was reduced from D0 to D2 (2.7-fold,P<0.001) and was slightly elevated from D2 to D8. In contrast,Mecp2e2 ex-pression increased from D0 to D2 (3.1-fold,P<0.05), but declined from D2 to D8 (4.2-fold, P <0.01). At each of these studied differentiation stages, the expression ratio between the two isoforms (Mecp2e1/Mecp2e2) varied sig-nificantly (D0, 5.99; D2, 0.69; D8, 4.62) (Additional file 3). At D0 and D8, Mecp2e1 expression was significantly higher than Mecp2e2 (D0,P <0.01, and D8, P <0.05). In contrast at D2, Mecp2e2 expression was significantly higher than Mecp2e1 (D2, P <0.05). These observations imply differential regulation of Mecp2isoforms and pos-sible changes in alternative splicing ofMecp2 at different stages of NSC differentiation.
MECP2/Mecp2expression is known to be regulated by REs found within its promoter and intron 1. The altered MeCP2 expression in autistic patients and in mouse
brains subjected to stress is correlated with increased MECP2/Mecp2 promoter methylation [2,12,13,18-20]. Therefore, we hypothesized that DNA methylation at the Mecp2 promoter and intron 1 might impact Mecp2 isoform-specific expression. For DNA methylation ana-lysis by bisulfite pyrosequencing, we selected three regions within the Mecp2promoter (named R1 to R3, hereafter) and three regions within the intron 1 (named R4 to R6, hereafter) (Figure 1B). These regions harbored different numbers of CpG sites; promoter regions R1: CpG island contains 13 CpG sites; R2: 4 CpG sites; R3: 2 CpG sites, and intron 1 regions R4: 1 CpG site; R5: 1 CpG site; and R6: 2 CpG sites.
Pyrosequencing analysis of R1-R6 indicated that down-regulation of Mecp2e1 and upregulation of Mecp2e2 from D0 to D2 were associated with slight, but significant demethylation of Mecp2 promoter R1 (2.3%, P <0.05). Similarly, upregulation ofMecp2e1and downregulation of Mecp2e2 from D2 to D8 were associated with hyperme-thylation ofMecp2intron 1 R5 (2.4%,P<0.01) (Figure 3B). Detected expression changes inMecp2isoforms from D0 to D8 were associated with demethylation ofMecp2 pro-moter R1 (2.6%,P<0.05), and hypermethylation ofMecp2 intron 1 R4 (4.6%,P<0.05). In all cases, the differences in average percentage methylation between D0, D2 and D8 were relatively small, but statistically significant and ran-ging between 2 to 5%. Previous reports have shown that an increase in the overall MECP2promoter methylation by approximately 2.0 to 2.5% in male autistic patients cor-relates with significantly reducedMECP2expression levels [2]. In mouse brain exposed to maternal separation and stress, DNA methylation changes that are as little as 2 to
Figure 3Methyl CpG binding protein 2 gene (Mecp2) isoform-specific transcript expression and DNA methylation at theMecp2
5% at individual CpG sites of theMecp2promoter are as-sociated with significantly reduced MeCP2 expression [20]. As even slightly altered MECP2/Mecp2 promoter methylation (2 to 5%) affectsMECP/Mecp2gene expres-sion in the human and mouse brain, it is likely that the statistically significant changes detected in the present study might be biologically important forMecp2e1and/or Mecp2e2expression.
As mentioned, the ratio of Mecp2 splice variants was changed at different stages of NSC differentiation. There-fore, we performed Pearson's correlation analysis between Mecp2e1/Mecp2e2expression ratio and DNA methylation at R1, R4 and R5 (the three regions that showed sig-nificant changes) during NSC differentiation. Pearson’s correlation coefficient (r) represents the strength of correl-ation, with negative r indicating inverse correlation, and positive r indicating direct correlation between DNA methylation and the Mecp2e1/Mecp2e2 splice ratio. We detected a statistically significant positive correlation (r>0.9, P <0.01) betweenMecp2e1/Mecp2e2splice ratio at D2 and DNA methylation at intron 1 R4 (Additional file 3). Although it is possible that intron 1 (R4) may play a role in alternative splicing ofMecp2, further investigations are required to establish the involvement of DNA methylation inMecp2transcriptional splicing.
As MECP2/Mecp2 is an X-linked gene, it is possible that the observed changes inMecp2 expression are due to a shift in the number of cells derived from male and female embryos. To exclude such a possibility, we deter-mined the contribution from the male/female embryonic cells during NSC differentiation using a semiquantitative PCR-based method. Genomic DNA was extracted from each differentiation stage and subjected to PCR analysis for the presence of theSry gene found in the Y chromo-some. The autosomal geneIl3was used an internal con-trol. The adult male brain cortex was used as a positive control for the presence of the male genomic DNA (Additional file 4: Figure S4A). We did not observe sta-tistically significant changes in the ratio ofSry/Il3 in the cells collected at different stages of differentiation, indi-cating that the ratio of male/female differentiating NSC were unchanged (Additional file 4: Figure S4B). To fur-ther confirm the contribution from the male/female gen-der, we tested the transcript levels ofXistgene (the gene is involved in X-chromosome inactivation) by qRT-PCR. We did not detect any significant change in Xist gene expression at different stages of NSC differentiation (Additional file 4: Figure S4C). These results indicate that our observed changes in Mecp2expression are not due to altered contribution of male and female cells. Taken together, our results suggest a possible link be-tween the Mecp2 isoform-specific expression and DNA methylation at the Mecp2 REs within the Mecp2 pro-moter and intron 1 during NSC differentiation.
Decitabine exposure leads toMecp2e1upregulation but its withdrawal downregulates bothMecp2isoforms to different extents
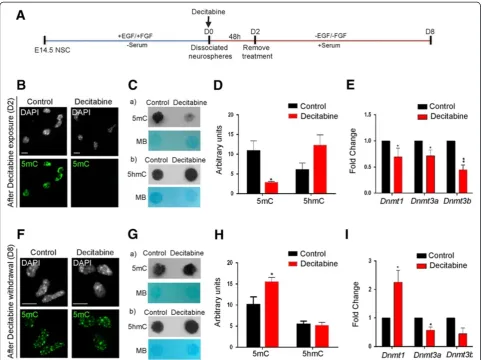
To further study the impact of DNA demethylation/ remethylation in Mecp2 isoform-specific expression, we treated dissociated neurosphere cells with 2.5μM decita-bine for 48 h, at the onset of NSC differentiation (D0) (Figure 4A). At D2, decitabine was withdrawn from the media and cells were kept in culture for another 6 days until D8, to study the effect of DNA remethylation (Figure 4A). First, as a proof of principle, we verified whether decitabine acted as a DNA demethylating agent in our system. Global change in DNA methylation was determined by IF for 5mC and DNA dot blot assay for both 5mC and 5hmC. As expected, IF experiments showed that 5mC nuclear signals were noticeably lower in decitabine-treated NSC compared to D2 control untreated cells (Figure 4B). DNA dot blot assays indicated that deci-tabine treatment resulted in reduced 5mC levels (3.79-fold, P <0.05), with slight but statistically insignificant increase in 5hmC levels (Figure 4C-D). In contrast, decita-bine withdrawal led to re-establishment of global DNA methylation (5mC) at D8 as detected by IF (Figure 4F). Furthermore, DNA dot blot assay showed DNA methyla-tion reprogramming upon decitabine withdrawal, with elevated 5mC levels (1.5-fold,P<0.05), and relatively un-changed 5hmC levels in decitabine-treated NSC compared to controls (Figure 4G-H). Although globally altered 5mC levels were expected following decitabine treatment in agreement with previous studies [54,55], the observed ef-fect of decitabine to slightly increase 5hmC levels was novel and might be biologically important.
DNA demethylating agents can function as cytosine analogues and/or asDnmt/DNMT inhibitors [56]. There-fore, we investigatedDnmtexpression levels in decitabine-treated differentiating NSC by qRT-PCR. In accordance with reduced DNA methylation levels at D2, decitabine treatment caused significant inhibition of transcript levels of all three DNA methyltransferases (Dnmt1, 1.7-fold, P<0.05;Dnmt3a, 1.5-fold,P<0.05 andDnmt3b, 2.5-fold, P<0.01) (Figure 4E). Even though we anticipated that de-citabine withdrawal would restore Dnmt levels, only Dnmt1 levels were elevated (2.2-fold, P <0.05), whereas both Dnmt3a (1.4-fold, P <0.05) and Dnmt3b (1.8-fold, P= 0.06) levels remained inhibited (Figure 4I). In sum-mary, these results indicate that decitabine functions as a DNA demethylating agent in differentiating NSC and glo-bally affects DNA methyl marks. Additionally, our data in-dicate that decitabine withdrawal would lead to DNA methylation reprogramming in differentiating NSC.
ofMecp2e1 (1.41-fold, P <0.05), with minimal and insig-nificant increased levels of the totalMecp2(1.2-fold,P= 0.5), and unchanged levels ofMecp2e2(Figure 5A). Ana-lysis of protein levels by WB showed that decitabine up-regulated total MeCP2 (2.5-fold,P <0.05), and MeCP2E1 (3.1-fold,P<0.05) protein expression (Figure 5B-C). How-ever, the lack of an antibody specific for MeCP2E2 limited our investigation of MeCP2E2 protein levels. Correlation analysis of transcript and protein levels ofMecp2/MeCP2 at D2 indicated significant correlation between the de-tected transcript and protein expression (Mecp2/MeCP2 (r= 0.97,P<0.05) andMecp2e1/MeCP2E1 (r= 0.98,P<0.01); Figure 5G).
Mecp2 transcript levels are biologically important and can result in significantly altered MeCP2 protein expres-sion levels.
Next, we aimed to study whether the detected changes inMecp2/MeCP2 expression were due to changes in cell population in response to decitabine treatment. There-fore, we studied the effect of decitabine on cell fate com-mitment of differentiating NSC at D2 and D8. After decitabine exposure at D2, we examined the expression of cell type-specific markers (neurons:Tub III,NeuN; as-trocytes: Gfap, S100b; oligodendrocytes: Cnpase, Mbp) at the transcript levels by qRT-PCR. Comparing the con-trol and decitabine-treated cells, we did not detect any statistically significant change in these cell type-specific genes, except for significant downregulation of Cnpase (9-fold, P <0.01) (Figure 5I). In order to determine whether any of these detected changes in transcript levels are represented in the number of cells expressing each corresponding cell type-specific marker, we per-formed IF experiments with specific antibodies against these markers (Figure 5J). IF experiments showed that there was no significant change in the number of TUB III+, GFAP+, CNPase+, or MBP+ cells. However, we did not find any NEUN+, or S100B+ cells in the control or decitabine-treated populations at D2, probably because these cells are still in the early stages of differentiation (Figure 5J). In the D8 population, decitabine treatment led to insignificant changes in the transcript levels for all neuronal and oligodendrocyte markers compared to control untreated cells. Additionally, Gfap expression in decitabine-treated cells was downregulated 5.5-fold, whereas S100b expression was upregulated to a similar extent (6-fold) (Figure 5K). Quantification of differenti-ated neurons, astrocytes and oligodendrocytes at D8 by IF did not show any significant change in the cell-fate commitment of these cells (Figure 5L). However, re-duced Gfap expression in decitabine-treated cells with-out any changes in the number of GFAP+cells might be
explained by the reduced intensity of GFAP staining relative to the control astrocytes, since the images were taken at the same exposure level (Figure 5M, a). Simi-larly, the significant upregulation of S100b transcript levels by decitabine with no change in the number of S100B+ cells could be explained by the increased inten-sity of S100B in decitabine-treated cells, when the im-ages were taken at the same exposure time (Figure 5M, b). Taken together, these results suggest that decitabine has minimal effect on the differentiated number of neurons, astrocytes and oligodendrocytes under the described conditions. They further suggest that the detected changes in Mecp2 expression are not likely due to altered population of differentiating cell types.
Next, we investigated whether the observed altered Mecp2/MeCP2 expression was due to changes in the number of cells deriving from male and female embryos. Detection ofSry andIl3 by PCR indicated that the ratio of Sry/Il3 was relatively similar in D2 control and decitabine-treated populations (Additional file 4: Figure S4D). Similar PCR analysis at D8 also showed no signifi-cant differences in the ratio ofSry/Il3between D8 control and decitabine-treated cells (Additional file 4: Figure S4E). Furthermore, qRT-PCR analysis of the Xist gene expres-sion in both D2 and D8 populations with and without decitabine treatment showed no significant change inXist transcript expression levels between the control and decitabine-treated cells (Additional file 4: Figure S4F-G). Therefore, these results indicate that the observed changes inMecp2/MeCP2 expression in response to decitabine ex-posure and withdrawal are not due to a shift in the num-ber of cells deriving from male/female embryos.
Taken together, our data so far indicate that a single administration of decitabine for 48 h induces Mecp2e1/ MeCP2E1, MeCP2 (total) expression, whereas its with-drawal downregulates Mecp2 (total)/MeCP2 (total), Mecp2e1/MeCP2E1, and Mecp2e2 expression with min-imal change in NSC differentiation.
(See figure on previous page.)
Figure 5Effect of decitabine exposure and withdrawal on Methyl CpG binding protein gene (Mecp2/MeCP2) expression. (A-C), After exposure to decitabine at D2.(A)Analysis ofMecp2(total),Mecp2e1andMecp2e2transcript levels by qRT-PCR.(B)Detection of MeCP2 (total) protein expression levels by western blot; n = 2 ± standard error of the mean (SEM).(C)Detection of MeCP2E1 protein expression levels by western blot; n = 2 ± SEM.(D-F), After withdrawal of decitabine at day 8 (D8).(D)Analysis of totalMecp2,Mecp2e1andMecp2e2transcript levels by qRT-PCR.(E)Detection of MeCP2 (total) protein expression levels by western blot.(F)Detection of MeCP2E1 protein expression levels by western blot.(G-H)Pearson's correlation analysis of the relation betweenMecp2transcript levels and MeCP2 protein levels at D2(G)and D8(H); r= Pearson’s correlation coefficient,r2= coefficient of determination.(I)Transcript detection of cell type-specific markers for neurons (Tub III, NeuN); astrocytes (Gfap,S100b); oligodendrocytes (Cnpase,Mbp) by qRT-PCR in D2 control and decitabine-treated cells.(J)Quantification of neurons, astrocytes and oligodendrocytes using cell type-specific markers by immunofluorescence in D2 control and decitabine-treated cells. (K)Transcript detection of cell type-specific markers for neurons (Tub III,NeuN); astrocytes (Gfap,S100b); oligodendrocytes (Cnpase,Mbp) by qRT-PCR in D8 control and decitabine-treated cells.(L)Quantification of neurons, astrocytes and oligodendrocytes using cell type-specific markers in D8 control and decitabine-treated cells.(M)Comparison of immunofluorescent detection of (a) Glial fibrillary acidic protein (GFAP) and (b) S100B between control and decitabine-treated cells. Images were taken at the same exposure time. Scale bars represent 20μm. For all the panels, fold changes are calculated relative to expression levels at D2 or D8 controls. Significant differences from controls:****P<0.0001;***P<0.001;**P<0.01; *
Decitabine mediates altered DNA methylation patterns at
theMecp2regulatory elements
As mentioned earlier, DNA methylation changes at the overall MECP2 promoter and individual CpG sites within the MECP2/Mecp2promoter are associated with altered MECP2/Mecp2 expression [2,19,20]. Therefore, we investigated whether altered expression of Mecp2
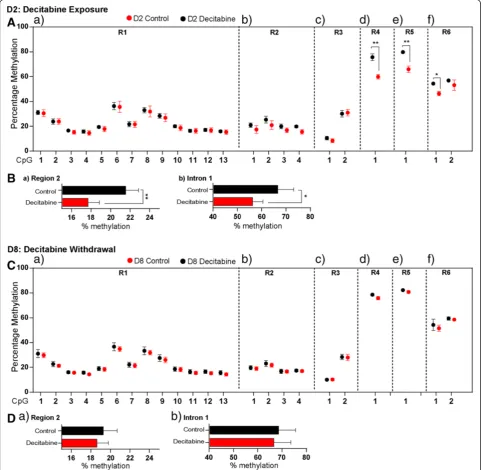
isoforms in our NSC system are associated with change in DNA methylation at theMecp2REs found within the Mecp2 promoter and intron 1. Bisulfite pyrosequencing analysis showed that decitabine treatment (D2) caused no significant change in the percentage DNA methylation at theMecp2promoter R1 and R3 (Figure 6A, a, c). How-ever, decitabine caused demethylation of all individual
CpG dinucleotides at the R2 (CpG1, 3.5%; CpG2, 4.4%; CpG3, 3.1%; CpG4, 4.28%) (Figure 6A, b), as well as the average R2 percentage DNA methylation (3.83%,P<0.05) (Figure 6B, a). Similarly, decitabine caused demethylation of individual CpG sites at the intron 1 R4 (15.8%,P<0.05), R5 (13.08%, P <0.05), and R6 (CpG1, 8.01%, P <0.01; CpG2, 3.8%, P= 0.4) (Figure 6A, d-f ), with significant demethylation at the entire intron 1 (10.37%, P <0.05) (Figure 6B, b). These results indicated that decitabine in-duced significant DNA demethylation at both the Mecp2 promoter and intron 1, at the individual CpG sites and the overall DNA methylation. As mentioned earlier, this de-tected DNA demethylation was associated with significant upregulation of Mecp2e1 isoform, but not Mecp2e2. Therefore, it is possible that the observed changes in DNA methylation at the studied REs contribute to the up-regulation ofMecp2e1.
Similar bisulfite pyrosequencing analysis at D8 indi-cated that the three Mecp2promoter regions (R1 to R3) and intron 1 regions (R4 to R6) were remethylated and DNA methylation was almost re-established following decitabine withdrawal (Figure 6C). Analyzing the average DNA methylation over the Mecp2promoter R2 and the entire intron 1 (which were demethylated at D2), we ob-served no significant differences in DNA methylation be-tween D8 control and decitabine-treated cells (Figure 6D). Despite the fact that DNA remethylation is expected to re-store the gene expression levels, expression of bothMecp2 isoforms were significantly downregulated. This observa-tion implies that at D8, other regulatory mechanisms apart from promoter/intron 1 DNA methylation might be in-volved in downregulatingMecp2expression.
Taken together, these results show that the induced Mecp2e1 (but not Mecp2e2) expression is associated with reduced DNA methylation at the Mecp2 REs and decreased global 5mC DNA methylation. Hence, our findings implicate the possible role of Mecp2 gene-specific DNA demethylation at the gene-specific REs on the expression of Mecp2e1/MeCP2E1, and MeCP2 (total) at D2. Moreover, altered expression of Mecp2 isoforms without any change in DNA methylation at the Mecp2 REs at D8 imply that mechanisms other than DNA methylation could be involved in downregulatingMecp2 isoforms.
Mecp2isoform-specific expression correlates with DNA
methylation at theMecp2regulatory elements
In order to establish a link between Mecp2 isoform-specific expression and DNA methylation, we performed Pearson's correlation analysis by comparing normalized (log2) expression of Mecp2 in each dataset to the re-spective average percentage methylation levels over en-tire regions, as well as methylation at individual CpG sites (from both control and decitabine-treated cells).
First, we tested whether average DNA methylation of the entireMecp2promoter (R1 to R3), and intron 1 (R4 to R6) regions correlate withMecp2e1and Mecp2e2 ex-pression at D2 in control and decitabine-treated cells. We observed a significant negative correlation between Mecp2e1 expression and the average methylation at R1, R3 and R5 (r>−0.9, P <0.05). Correlation between Mecp2e1 upregulation and significant demethylation at R5, induced by decitabine at D2, suggests a possible con-tribution of R5 in upregulating Mecp2e1. On the other hand, Mecp2e2 showed significant negative correlation only with R3 methylation (r>−0.9,P<0.05) (Figure 7A, a), that remained unchanged at D2, and this could explain the unaffectedMecp2e2expression at D2.
Similar correlation analysis at D8 (in control D8 and decitabine-treated cells), indicated that Mecp2e1 shows a significant negative correlation with average DNA methylation at the promoter R1 (r>−0.7, P <0.05), R2 (r>−0.8,P <0.05) and R3 (r>−0.7,P= 0.06, close to sig-nificant) and a significant positive correlation with the average DNA methylation at the intron 1 R6 (r >0.9, P <0.001) (Figure 7A, b). In contrast, Mecp2e2 did not show any significant correlation with any of the promoter regions (R1 to R3), but showed a significant positive correlation with the average methylation at intron 1 R4 (r>0.9,P<0.05) and R6 (r>0.9,P<0.01). This divergence in the correlation patterns (negative and positive depend-ing on the stage of differentiation), might imply a potential dynamic role of DNA methylation in regulating Mecp2 isoforms at different stages of NSC differentiation.
correlation with individual isoforms. For instance, at D2, the only CpG site within R5 showed negative, significant correlation withMecp2e1(r>−0.8,P<0.05) (Figure 7B, e). Interestingly, at D8 intron 1 R4 and R6 showed positive, significant correlation with the Mecp2e2 isoform (r >0.8, P<0.05) (Figure 7C, d-f). The observed correlations for all REs are represented in Figure 7B-C and are summarized in Figure 8.
Taken together, these results show a strong (r> 0.8, P <0.05) and dynamic (positive or negative) relationship between DNA methylation at the Mecp2 REs and ex-pression of Mecp2 isoforms depending on the different stages of NSC differentiation. Therefore, these results implicate a possible dynamic role of DNA methylation at the Mecp2 REs in regulating Mecp2 isoform-specific expression.
Discussion
In the brain, precisely controlled MECP2/MeCP2 tran-script and protein expression levels are critical, as even slightly altered expression is associated with severe neurological symptoms [2,16,57-60]. However, so far lit-tle is known about how MeCP2 expression is regulated in the developing brain. MeCP2 is a major epigenetic regulator in brain, and its reduced expression in the aut-istic brain is associated withMECP2promoter hyperme-thylation [2]. Surprisingly, the role of DNA mehyperme-thylation in MeCP2 expression during brain development is un-clear. Currently, most diseases that are associated with aberrant MeCP2 function or expression deficits, includ-ing autism and Rett syndrome, have no cure or effective treatment. This underscores an urgent need for investi-gating how MeCP2 expression is regulated in the brain. Such knowledge for addressing this gap is essential for designing possible future therapeutic strategies. DNA methylation is a reversible epigenetic modification [22], which can be targeted by existing Food and Drug Administration (FDA)-approved drugs, including decita-bine, which is suggested for use in autism [61,62]. Therefore, investigating the effect of such epigenetic drugs on MeCP2 expression is important. Therapeutic approaches such as gene therapy or restoring MeCP2 expression by genetic engineering have been suggested as possible therapeutic strategies for MeCP2-associated
disorders [14,15,35]. However, even mild MeCP2 overex-pression can lead to severe neurological complications, highlighting the importance of understanding MeCP2 regulatory mechanisms. Since both MeCP2 isoforms have been implicated in severe neurological disorders, investigating MeCP2 regulation is equally important for individual isoforms. This present study is the first report on the potential role of DNA methylation at theMecp2 REs and the impact on the expression of Mecp2 isoforms.
We observed globally altered DNA methylation upon decitabine exposure and withdrawal. Since DNA methy-lation is a major epigenetic mechanism that is involved in modulating gene expression and chromatin architecture [22], these observed changes in 5mC levels may possibly lead to altered chromatin structure and genome-wide changes in gene expression. Furthermore, the presented findings highlight that exposure to drugs that disturb the epigenetic marks during differentiation of brain cells may lead to aberrant DNA methylation profiles. Our observa-tions at D8 indicate that, even after the disturbance factor is withdrawn from the system, an epigenetic memory for this disturbance may be associated throughout cellular dif-ferentiation of brain cells. Thus, our findings highlight the biological importance of maintaining proper regulation of epigenetic factors/modifications during brain development with a clear focus on DNA methylation and MeCP2.
Our results show that decitabine altersMecp2/MeCP2 expression at both the transcript and protein levels. Im-portantly, even minor changes in Mecp2 transcript ex-pression led to nearly 2- to 3-fold altered protein expression, highlighting the biological significance of proper regulation of Mecp2 expression at the transcript levels. The observed correlation between the Mecp2/ MeCP2 (total) and Mecp2e1/MeCP2E1 transcript/pro-tein expression at D2 reinforces the concept that poten-tial changes in Mecp2 transcript levels may reflect possible changes at the protein levels. However, the non-correlated Mecp2/MeCP2 (total) and Mecp2e1/MeCP2E1 transcript/protein expression at D8 indicates that decita-bine withdrawal causes not only transcriptional but also, post-transcriptional regulation of MeCP2 expression, lead-ing to reduced expression of MeCP2 (total)/MeCP2E1. One such post-transcriptional regulatory mechanism
(See figure on previous page.)
Figure 7Correlation analysis between DNA methylation at the Methyl CpG binding protein 2 gene (Mecp2) regulatory elements and
Mecp2expression after decitabine treatment (day 2) and decitabine withdrawal (day 8).All graphs represent the Pearson's correlation coefficient (r) forMecp2e1(black), andMecp2e2(pink): statistical significance:***P<0.001;**P<0.01;*P<0.05; n = 3.(A)Correlation coefficients for the relation betweenMecp2expression and average methylation over entire regions inMecp2promoter (region (R)1 to R3) and intron 1 (R4 to R6) after decitabine exposure on day 2 (D2) (a), and after decitabine withdrawal on D8 (b).(B)After decitabine exposure: correlation coefficients
forMecp2e1(black), andMecp2e2(pink) with individual CpG methylation at the promoter regions (a) R1, (b) R2 and (c) R3, and intron 1 regions
could be the action of micro-RNAs such as miR132, ex-pression of which has been shown to be increased by 5-aza-2′-deoxycytidine/decitabine [63], and has the ability to repress MeCP2 expression [64].
Increased promoter methylation of autistic candidate genes such asRORA,BCL2andMECP2are shown to be associated with reduced expression of these genes in aut-istic patients [2,19,62]. Treatment with decitabine was
shown to demethylate promoters and restore/induce the expression of the silenced RORA and BCL2 in autistic and patients with fragile X syndrome and hence, the use of DNA demethylating agents in drug therapy for autism and fragile X syndrome has been suggested [61,62]. A similar strategy to restore/induce MeCP2 expression might be extended to treat such diseases associated with reduced MeCP2 expression, including autism and RTT. Figure 8Summary of the correlations between the expression of Methyl CpG binding protein 2 gene (Mecp2) isoforms and DNA methylation at theMecp2regulatory elements. (A)Dynamic changes in the expression ofMecp2isoforms (Mecp2e1andMecp2e2) at different time points of neural stem cell (NSC) differentiation at day 0 (D0), D2 and D8. Decitabine caused upregulation ofMecp2e1/MeCP2E1 but not
Mecp2e2at D2. Decitabine effect on MeCP2E2 at the protein levels is unknown. Decitabine withdrawal by D8 downregulatedMecp2e1/MeCP2E1,
andMecp2e2/MeCP2E2 (unknown) to different extents.(B)Schematic representation of the correlation betweenMecp2isoform-specific expression
Providing insights on such therapeutic strategies, the ap-plication of epigenetic drug therapy to induce non-mutated copy of MECP2 expression in Rett syndrome cell lines has been suggested and attempted previously [65]. Therefore, our findings on the ability of decitabine to induce MeCP2 expression in differentiating NSC pro-vide further insights on designing possible drug therap-ies for autism. Even though the exposure of RTT cell lines (fibroblasts) to lower doses of decitabine for a lon-ger period did not activate MECP2 expression [65], our results indicate that moderate dose of decitabine can in-duce Mecp2/MeCP2 expression within a shorter period. However, inhibition of MeCP2 by withdrawal of decita-bine as well as other observed changes in DNA methyl marks implies that such drug therapy should be admin-istrated with great caution.
Our findings on the changes in DNA methylation at the Mecp2 REs are in agreement with the previous re-ports on MECP2 promoter methylation, which demon-strate that an approximate difference of 2.0 to 2.5% overall methylation over a region −233 to −531 up-stream of the MECP2 promoter is correlated with re-duced MECP2 expression in autistic male brains. The authors report that within the 15 CpG sites found in this MECP2 promoter region, two CpG sites are specifically altered in the autistic males [2]. Furthermore, our results are in agreement with a previous report on significantly reduced MeCP2 expression in the postnatal mouse brain (under stress), which is associated with 2 to 5% in-creased methylation at the individual CpG sites within a 164-bp region of the Mecp2 promoter [20]. Supporting these observations, studies have also shown minor differ-ences, such as 2 to 5% DNA methylation causing signifi-cant changes in the expression of other genes, such as RASSF1, in the human brain [66], AMOTL2 in the hu-man heart [67], and PGC1α in human muscles [68]. Therefore, although the detected DNA methylation changes in this current study are not considerably high (they varied between 2 to 15%), they were statistically significant for average DNA methylation (within R1, R3 and R5) during NSC differentiation, and for several spe-cific CpG dinucleotides subsequent to decitabine treat-ment (within R2, R4, R5, and R6), and are likely to be biologically important.
The Mecp2 promoter CpG island studied by Franklin et al., [20] overlaps with the R1 and R2 of the Mecp2 promoter that we studied here. The significantly methyl-ated CpGs reported in their study coincides with the R2 CpGs, where we observed changes at individual CpG sites as well as average methylation upon decitabine treatment. However, in our study we did not see any sig-nificant change in the R1 CpG sites (both D2 and D8), where Franklin et al., reported DNA methylation changes. Importantly, the results we obtained for one of
the promoter regions studied (R2) are in agreement with this previous report, which showed a biological and functional importance of the methylation changes in regulating MeCP2 expression in response to stress in vivo. Therefore, it is likely that the detected changes we observed in the Mecp2 REs in our study also have biological importance. The hypermethylation of this R2 region in mouse brain was associated with MeCP2 downregulation [20], and hence it is possible that the hy-pomethylation/demethylation of the same R2 region causesMecp2/MeCP2 upregulation.
Our results on the ability of 2.5 μM decitabine to up-regulate Mecp2e1 (but not Mecp2e2) suggest that the two isoforms may have different sensitivities to drugs/ chemicals. This observation is in agreement with the previous report on the higher sensitivity of Mecp2e1 than Mecp2e2 to Bisphenol A [69]. These observations further suggest that the differential sensitivity to drugs might be used to specifically induce only oneMecp2 iso-form. This is also important because overexpression of Mecp2e2, but not Mecp2e1 causes neuronal cell death [10]. Hence, our study provides a functional relevance of DNA demethylation at the Mecp2 REs by decitabine causing upregulation ofMecp2e1, but notMecp2e2.
The observed negative correlation between the expres-sion of both Mecp2 isoforms and Mecp2 promoter ele-ments are novel and are in accordance with previous correlation studies on the human MECP2 expression and promoter DNA methylation [2,19]. Furthermore, our study is novel in demonstrating a dynamic (positive/ negative) correlation between the intronic DNA methy-lation and expression of Mecp2isoforms in differentiat-ing brain cells. It is possible that the promoter regions analyzed in our study (which also overlap with the core Mecp2 promoter [13]) might be shared by both Mecp2 isoforms, whereas depending on the stage of neural dif-ferentiation, intron 1 regions may add another layer of regulation for Mecp2 isoform-specific expression. Sup-porting our findings, the role of intronic DNA methyla-tion in regulating gene expression of other genes has been previously reported [70,71]. Several other reports also show evidence that gene expression negatively cor-relates with promoter methylation and positively corre-lates with gene-body methylation [67,72].
The intron 1 regions analyzed in this study were desig-nated as part of a silencer element, which has been pre-viously proposed to regulate MECP2 alternative splicing and tissue-specific expression [12]. Our findings are in agreement with possible involvement of these regions in Mecp2 isoform-specific expression. Although the link between DNA methylation andMecp2expression is sup-ported by our results in the NSC system, the contribu-tion of other epigenetic modificacontribu-tions such as histone acetylation and histone methylation should not be excluded [73,74].
Conclusion
The summary of the findings presented in our study is illustrated in Figure 8. First, expression of Mecp2 iso-forms was significantly and reciprocally changed at dif-ferent stages of NSC difdif-ferentiation, in association with minor but significant changes in DNA methylation at se-lected Mecp2 REs, suggesting possible involvement of these regions inMecp2regulation. Second, treatment of differentiating NSC with decitabine for 48 h led to de-methylation of specificMecp2REs (promoter R2 and all intron 1 regions) and subsequent upregulation of Mecp2e1/MeCP2E1 (but notMecp2e2), implying the dif-ferential sensitivity of the twoMecp2isoforms to decita-bine. Such differential sensitivity of Mecp2 isoforms to decitabine might be useful in future drug therapies to specifically activate one isoform but not the other. Fur-thermore, the ability of decitabine to induce Mecp2e1/ MeCP2E1 at both transcript and protein levels provide insights for future therapeutic strategies for MeCP2 deficiency-related neurodevelopmental disorders such as autism and Rett syndrome. Finally, the significant and dynamic (positive or negative) correlation between the expression ofMecp2isoforms and DNA methylation im-plies the potential contribution of these REs in regulating Mecp2 isoforms at different stages of neural differenti-ation. Collectively, our study contributes to the under-standing of expression and regulation of Mecp2isoforms during neural development and provides important in-sights for future therapeutic applications of decitabine for MeCP2-related neurological disorders.
Additional files
Additional file 1: Figure S1.Comparison of CpG sites in human Methyl CpG binding protein 2 gene (MECP2) and mouse Methyl CpG binding protein 2 gene (Mecp2) promoter and intron 1. CpG sites analyzed in the mouseMecp2(black) are underlined. Conserved CpGs between mouse and human sequences are also underlined in humanMECP2(red) sequence.
Additional file 2: Figure S2.Detection of KI67 in day 2 (D2) control cells. KI67 was detected in (98.8% ± 0.8) of the D2 cell population, indicating that they were actively proliferating. Scale bars represent 20μm.
Additional file 3: Figure S3.Relationship between the ratio of mouse Methyl CpG binding protein 2 geneMecp2splice variants and DNA methylation at selectedMecp2regulatory elements. Pearson’s correlation analysis between DNA methylation at theMecp2regions R1, R4 and R5 andMecp2e1/Mecp2e2ratio at different stages of neural stem cell (NSC) differentiation. Significant differences:*P<0.05. The regions are, promoter regions R1: CpG island contains 13 CpG sites, intron 1 regions R4: 1 CpG site, and R5: 1 CpG site; n = 3 ± standard error of the mean.
Additional file 4: Figure S4.Determination of the male/female contribution at different stages of neural stem cell (NSC) differentiation. (A) PCR amplification ofSry(402 bp) andIl3(544 bp) in adult male cortex (positive control) and the absence of the signal in negative control PCR (no template). (B) The detection ofSryandIl3in the positive and negative controls and during NSC differentiation (day 0 (D0), D2, D8). The graph represents ratio ofSry/Il3; n = 3 ± standard error of the mean (SEM). (C) Expression ofXisttranscripts relative toGapdhat different stages of NSC differentiation; n = 3 ± SEM. Significance was determined at*P<0.05. (D) Ratio ofSry/Il3in D2 control and D2 decitabine-treated cells. (E) Ratio ofSry/Il3in control and decitabine-treated cells at D8; n = 3 ± SEM. Ex-pression ofXisttranscripts relative toGapdhat D2 after decitabine treat-ment (F), and at D8 after decitabine withdrawal (G); n = 3 ± SEM. Significance was determined at *P<0.05.
Abbreviations
5hmC:5-hydroxymethylcytosine; 5mC: 5-methylcytosine; ANOVA: Analysis of variance; bFGF: Basic Fibroblast growth factor; bp: Base pairs; CNPase: 2',3'-Cyclic-nucleotide 3'-phosphodiesterase; D: Day; DAPI: 4',6-diamidino-2-phenylindole; DMEM: Dulbecco's modified Eagle’s medium; DNMT: DNA methyltransferases; E: Embryonic day; GAPDH: Glyceraldehyde-3-phosphate dehydrogenase; GFAP: Glial fibrillary acidic protein; IF: Immunofluorescence; MBP: Myelin basic protein;MECP2: Methyl CpG binding protein 2, human gene;Mecp2: Methyl CpG binding protein 2, mouse gene; MeCP2: Methyl CpG binding protein; NEUN: NEUronal Nuclei; NSC: Neural stem cells; OLIG2: Oligodendrocyte lineage transcription factor 2; qRT-PCR: Quantitative reverse transcription polymerase chain reaction;r: Pearson’s correlation coefficient; RE: Regulatory element; RTT: Rett syndrome; rhEGF: Recombinant human epidermal growth factor; SEM: Standard error of the mean; TUB III: TUBULIN III; WB: Western blot.
Competing interests
The authors have declared that no competing interests exist.
Author contributions
VRBL, RMZ and MR conceived and designed experiments. MR performed neural stem cell isolation, culture and differentiation. RMZ maintained neural stem cell cultures. VRBL performed qRT-PCR, dot blot, WB, IF, inverted microscopy imaging. RMZ performed IF and confocal imaging. VRBL and MR analyzed data. MR contributed reagents/materials/analysis tools. VRBL and MR wrote the paper. All authors read and approved the final manuscript.
Acknowledgements
We thank Mr Carl Olson in the Rastegar laboratory for neurosphere sectioning. This work was supported by funds from the Natural Sciences and Engineering Research Council of Canada (NSERC Discovery Grant 372405– 2009), and Scottish Rite Charitable Foundation of Canada (SRCFC, Grant 10110). VRBL and RMZ are recipients of MHRC-MICH studentship awards. The NESTIN monoclonal antibody developed by Susan Hockfield was obtained from the Developmental Studies Hybridoma Bank, developed under the auspices of the NICHD and maintained by The University of Iowa, Department of Biology, Iowa City, IA 52242.
Received: 11 June 2013 Accepted: 1 October 2013 Published: 15 November 2013
References
2. Nagarajan RP, Hogart AR, Gwye Y, Martin MR, LaSalle JM:Reduced MeCP2 expression is frequent in autism frontal cortex and correlates with aberrant MECP2 promoter methylation.Epigenetics2006,1:e1–e11. 3. Amir RE, Van den Veyver IB, Wan M, Tran CQ, Francke U, Zoghbi HY:Rett
syndrome is caused by mutations in X-linked MECP2, encoding methyl-CpG-binding protein 2.Nat Genet1999,23:185–188.
4. Kriaucionis S, Bird A:The major form of MeCP2 has a novel N-terminus generated by alternative splicing.Nucleic Acids Res2004,32:1818–1823. 5. Mnatzakanian GN, Lohi H, Munteanu I, Alfred SE, Yamada T, MacLeod PJ, Jones JR, Scherer SW, Schanen NC, Friez MJ, Vincent JB, Minassian BA:A previously unidentified MECP2 open reading frame defines a new protein isoform relevant to Rett syndrome.Nat Genet2004,36:339–341. 6. Dragich JM, Kim YH, Arnold AP, Schanen NC:Differential distribution of
the MeCP2 splices variants in the postnatal mouse brain.J Comp Neurol 2007,501:526–542.
7. Zachariah RM, Olson CO, Ezeonwuka C, Rastegar M:Novel MeCP2 isoform-specific antibody reveals the endogenous MeCP2E1 expression in murine brain, primary neurons and astrocytes.PloS one2012,7:e49763. 8. Saunders CJ, Minassian BE, Chow EW, Zhao W, Vincent JB:Novel exon 1
mutations in MECP2 implicate isoform MeCP2_e1 in classical Rett syndrome.Am J Med Genet Part A2009,149A:1019–1023.
9. Fichou Y, Nectoux J, Bahi-Buisson N, Rosas-Vargas H, Girard B, Chelly J, Bienvenu T: The first missense mutation causing Rett syndrome specifically affecting the MeCP2_e1 isoform.Neurogenet2009,10:127–133.
10. Dastidar SG, Bardai FH, Ma C, Price V, Rawat V, Verma P, Narayanan V, D’Mello SR:Isoform-specific toxicity of Mecp2 in postmitotic neurons: suppression of neurotoxicity by FoxG1.J Neurosci2012,32:2846–2855. 11. Williamson SL, Christodoulou J:Rett syndrome: new clinical and molecular
insights.Eur J Hum Genet2006,14:896–903.
12. Liu J, Francke U:Identification of cis-regulatory elements for MECP2 expression.Hum Mol Genet2006,15:1769–1782.
13. Adachi M, Keefer EW, Jones FS:A segment of the Mecp2 promoter is sufficient to drive expression in neurons.Hum Mol Genet2005, 14:3709–3722.
14. Jugloff DG, Vandamme K, Logan R, Visanji NP, Brotchie JM, Eubanks JH: Targeted delivery of an Mecp2 transgene to forebrain neurons improves the behavior of female Mecp2-deficient mice.Hum Mol Genet2008, 17:1386–1396.
15. Kerr B, Soto CJ, Saez M, Abrams A, Walz K, Young JI:Transgenic
complementation of MeCP2 deficiency: phenotypic rescue of Mecp2-null mice by isoform-specific transgenes.Eur J Hum Genet2012,20:69–76. 16. Collins AL, Levenson JM, Vilaythong AP, Richman R, Armstrong DL, Noebels
JL, David Sweatt J, Zoghbi HY:Mild overexpression of MeCP2 causes a progressive neurological disorder in mice.Hum Mol Genet2004, 13:2679–2689.
17. Luikenhuis S, Giacometti E, Beard CF, Jaenisch R:Expression of MeCP2 in postmitotic neurons rescues Rett syndrome in mice.Proc Nat Acad Sci USA2004,101:6033–6038.
18. Singh J, Saxena A, Christodoulou J, Ravine D:MECP2 genomic structure and function: insights from ENCODE.Nucleic Acids Res2008,36:6035–6047. 19. Nagarajan RP, Patzel KA, Martin M, Yasui DH, Swanberg SE, Hertz-Picciotto I,
Hansen RL, Van de Water J, Pessah IN, Jiang R, Robinson WP, LaSalle JM: MECP2 promoter methylation and X chromosome inactivation in autism. Autism Res2008,1:169–178.
20. Franklin TB, Russig H, Weiss IC, Graff J, Linder N, Michalon A, Vizi S, Mansuy IM:Epigenetic transmission of the impact of early stress across generations.Biol Psych2010,68:408–415.
21. Delcuve GP, Rastegar M, Davie JR:Epigenetic control.J Cell Phys2009, 219:243–250.
22. Liyanage VRB, Zachariah RM, Delcuve GP, Davie JR, Rastegar M:New Developments in Chromatin Research: An Epigenetic Perspective. InNew Developments in Chromatin Research.Edited by Simpson NM, Stewart VJ. NY, USA: Nova Science Publishers; 2012:29–58.
23. Jeltsch A:Beyond Watson and Crick: DNA methylation and molecular enzymology of DNA methyltransferases.Chembiochem2002,3:274–293. 24. Kriaucionis S, Heintz N:The nuclear DNA base 5-hydroxymethylcytosine is
present in Purkinje neurons and the brain.Science2009,324:929–930. 25. Tahiliani M, Koh KP, Shen Y, Pastor WA, Bandukwala H, Brudno Y, Agarwal S,
Iyer LM, Liu DR, Aravind L, Rao A:Conversion of methylcytosine to 5-hydroxymethylcytosine in mammalian DNA by MLL partner TET1.Science 2009,324:930–935.
26. Elango N, Yi SV:DNA methylation and structural and functional bimodality of vertebrate promoters.Mol Biol Evol2008,25:1602–1608. 27. Flores K, Wolschin F, Corneveaux JJ, Allen AN, Huentelman MJ, Amdam GV:
Genome-wide association between DNA methylation and alternative splicing in an invertebrate.BMC genomics2012,13:480.
28. Shukla S, Kavak E, Gregory M, Imashimizu M, Shutinoski B, Kashlev M, Oberdoerffer P, Sandberg R, Oberdoerffer S:CTCF-promoted RNA polymerase II pausing links DNA methylation to splicing.Nature2011, 479:74–79.
29. Mossman D, Kim KT, Scott RJ:Demethylation by 5-aza-2′-deoxycytidine in colorectal cancer cells targets genomic DNA whilst promoter CpG island methylation persists.BMC cancer2010,10:366.
30. Ishimaru N, Fukuchi M, Hirai A, Chiba Y, Tamura T, Takahashi N, Tabuchi A, Tsuda M, Shiraishi M:Differential epigenetic regulation of BDNF and NT-3 genes by trichostatin A and 5-aza-2′-deoxycytidine in Neuro-2a cells. Biochem Biophys Res Comm2010,394:173–177.
31. Bazan E, Alonso FJ, Redondo C, Lopez-Toledano MA, Alfaro JM, Reimers D, Herranz AS, Paino CL, Serrano AB, Cobacho N, Caso E, Lobo MV:In vitro and in vivo characterization of neural stem cells.Histol Histopathol2004, 19:1261–1275.
32. Tropepe V, Sibilia M, Ciruna BG, Rossant J, Wagner EF, van der Kooy D: Distinct neural stem cells proliferate in response to EGF and FGF in the developing mouse telencephalon.Dev Biol1999,208:166–188. 33. Bartl J, Mori T, Riederer P, Ozawa H, Grunblatt E:Methylphenidate
enhances neural stem cell differentiation.J Mol Psych2013,1:5. 34. Kishi N, Macklis JD:MECP2 is progressively expressed in post-migratory
neurons and is involved in neuronal maturation rather than cell fate decisions.Mol Cell Neurosci2004,27:306–321.
35. Rastegar M, Hotta A, Pasceri P, Makarem M, Cheung AY, Elliott S, Park KJ, Adachi M, Jones FS, Clarke ID, Dirks P, Ellis J:MECP2 isoform-specific vectors with regulated expression for Rett syndrome gene therapy. PloS one2009,4:e6810.
36. Olynik BM, Rastegar M:The genetic and epigenetic journey of embryonic stem cells into mature neural cells.Frontiers in genetics2012,3:81. 37. Barber BA, Liyanage VR, Zachariah RM, Olson CO, Bailey MA, et al.:Dynamic
expression of MEIS1 homeoprotein in E14.5 forebrain and differentiated forebrain-derived neural stem cells.Ann Anat2013,195:431–440. 38. Lambert JF, Benoit BO, Colvin GA, Carlson J, Delville Y, Quesenberry PJ:Quick
sex determination of mouse fetuses.J Neurosci Methods2000,95:127–132. 39. Hartshorn C, Rice JE, Wangh LJ:Developmentally-regulated changes of
Xist RNA levels in single preimplantation mouse embryos, as revealed by quantitative real-time PCR.Mol Reprod Dev2002,61:425–436.
40. Kobrossy L, Rastegar M, Featherstone M:Interplay between chromatin and trans-acting factors regulating the Hoxd4 promoter during neural differentiation.J Biol Chem2006,281:25926–25939.
41. Nolte C, Rastegar M, Amores A, Bouchard M, Grote D, Maas R, Kovacs EN, Postlethwait J, Rambaldi I, Rowan S, Yan YL, Zhang F, Featherstone M: Stereospecificity and PAX6 function direct Hoxd4 neural enhancer activity along the antero-posterior axis.Dev Biol2006,299:582–593. 42. Huang H, Rastegar M, Bodner C, Goh SL, Rambaldi I, Featherstone M:MEIS
C termini harbor transcriptional activation domains that respond to cell signaling.J Biol Chem2005,280:10119–10127.
43. Rastegar M, Kobrossy L, Kovacs EN, Rambaldi I, Featherstone M: Sequential histone modifications at Hoxd4 regulatory regions distinguish anterior from posterior embryonic compartments.Mol Cel Biol2004,24:8090–8103.
44. Manczak M, Mao P, Nakamura K, Bebbington C, Park B, Reddy PH: Neutralization of granulocyte macrophage colony-stimulating factor decreases amyloid beta 1–42 and suppresses microglial activity in a transgenic mouse model of Alzheimer’s disease.Hum Mol Genet2009, 18:3876–3893.
45. Tsoporis JN, Marks A, Haddad A, Dawood F, Liu PP, Parker TG:S100B expression modulates left ventricular remodeling after myocardial infarction in mice.Circulation2005,111:598–606.
46. Schneider L, d’Adda di Fagagna F:Neural stem cells exposed to BrdU lose their global DNA methylation and undergo astrocytic differentiation. Nucleic Acids Res2012,40:5332–5342.