R E V I E W
Open Access
Near vision examination in presbyopia
patients: Do we need good homologated
near vision charts?
Wolfgang Radner
Abstract
Presbyopia correction is mainly concerned with the goal of regaining an uncorrected reading performance. Since historic reading charts do not provide a unique standard that is applicable for the analysis of clinical and scientific reading performance, new standardized reading charts have been developed, in order to provide reading performance analyses analogous to modern single-optotype distance acuity measurements: the Bailey-Lovie Word Reading Chart, the Colenbrander English Continuous Text Near Vision Cards, the MNREAD Charts, and the RADNER Reading Charts. The last three are also meant to measure reading speed, thus allowing detailed analysis of the reading capabilities of the patient’s functional vision. Furthermore, these reading charts can be declared homologated, based on the standards that were published for reading charts by the Visual Function Committee of the International Council of Ophthalmology (ICO) in 1988. Many research studies have shown that by analyzing the reading performance with homologated reading charts, valuable insight into the reading performance of patients suffering from various diseases can be obtained. These reading charts have also been successfully used in presbyopia research. It therefore seems evident that homologated, standardized reading charts facilitate not only research concerning functional vision in many fields of ophthalmology but also international communication about near visual performance. Homologated reading charts are available in almost all languages and have become a valuable tool in analyzing reading
performance. We argue in this review that homologated reading charts are clearly a necessity for presbyopia research.
Keywords:Reading charts, Reading test, Reading acuity, Reading speed, Reading performance, Functional vision
Backgrounds
Presbyopia is an age-related condition that reduces near visual function through successive losses of ac-commodation. In addition, distance-corrected pseudo-phakia results in an iatrogenic presbyopia that results from the implantation of a monofocal intraocular lens (IOL). Since both conditions affect near visual proper-ties, particularly the ability to read, presbyopic and cataract patients share the desire to regain a comfortable reading ability.
Whereas age-related presbyopia usually is corrected with reading glasses, sufficient reading acuity after cataract surgery can be achieved with several types of presbyopic correction: (a) with monofocal IOLs and reading glasses, (b) with contact lenses [1] (c) with multifocal IOLs [2–5] or (d) pseudophakic monovision [6] and (e) with corneal
inlays [7]. The accommodative potential of accommodat-ing IOLs, however, seems to be limited [8–10]. Recently, promising results have been obtained with a new accom-modative IOL model [11]. A noninvasive pharmacological approach for the treatment of presbyopia is the use of a drug combination in order to improve accommodation with eye drops [12].
Given that reading is an important visual task in our information-based society, and cataract and refractive surgery ideally aims to restore a comfortable reading ability, there is increasing clinical interest in scientifically investigating the postoperative reading performance of such patients [1–23]. It seems evident for such research questions that a reading chart standard, by analogy to distance acuity standards, is required in order to make various reading charts and their various language versions comparable with each other. In other words, reading charts need to be homologated.
Correspondence:wolfgang.radner@inode.at
Austrian Academy of Ophthalmology, Mollgasse 11, A-1180 Vienna, Austria
Is there a standard that allows us to homologate reading charts and their print sizes? In 1988, the Visual Function Committee of the International Council of Ophthalmol-ogy published a standard for reading charts [24] in order to establish homologated reading acuity measures. In short: By analogy to the standards of visual acuity mea-surements, the print sizes of reading charts have to pro-gress logarithmically. The committee concluded that it is desirable that the test conditions, optotypes, and chart de-sign used are homologated and that the test distance is specified in all instances. They further postulated that for reading charts, continuous text materials are desirable, and they recommended that the typeset material be based upon the distance at which the height of lower-case letters such as“o”,“m”, and“x”subtends 5 min of arc.
Since then, only a few modern reading charts have been built upon these useful standards: (a) the Bailey-Lovie Word Reading Chart [25], (b) the Colenbrander English Continuous Text Near Vision Cards (Precision Vision, Woodstock, IL), (c) the MNREAD Charts [26, 27] (Precision, Vision, Woodstock, IL), and (d) the RADNER Reading Charts [28–30] (NeuMed AG, AT; Precision Vision, Woodstock, IL). The last three reading charts are available in several languages.
An innovative example for homologating a well-recognized reading chart with modern standards is the Oculus Reading Probe, which is a printed chart using long paragraphs. For reading acuity, decimal acuities are given for 25 cm, 32 cm, and 40 cm. The OCULUS Corporation reissued their German reading charts in 2015 and decided to ask the author of this article to collaborate in order to homologate the Oculus print sizes with those of the RADNER Reading Charts that are in accordance with the standards of the ICO committee (the author was responsible for the accuracy of the print sizes). Now, the two leading reading charts in the German-speaking countries provide homologated reading acuity measures. This was a hallmark collabor-ation in ophthalmology since it was the first time that two different reading chart systems have been homologated so that the print sizes, and therefore the reading acuity measures, have been equalized.
For the present review article, I selected only those reading charts that are in accordance with the stan-dards of the Visual Function Committee of the ICO and with EN-ISO 8596 [25, 31]. From a PubMed search, only those studies were selected that had been performed with such homologated reading charts, and a further selection was made in order to avoid multiple presentations of materials and/or surgical methods. The backgrounds of these homologated logarithmic reading charts are discussed with regard to the advantages they offer for research and clinical purposes in the field of presbyopia.
Main text
Historical aspects of reading charts
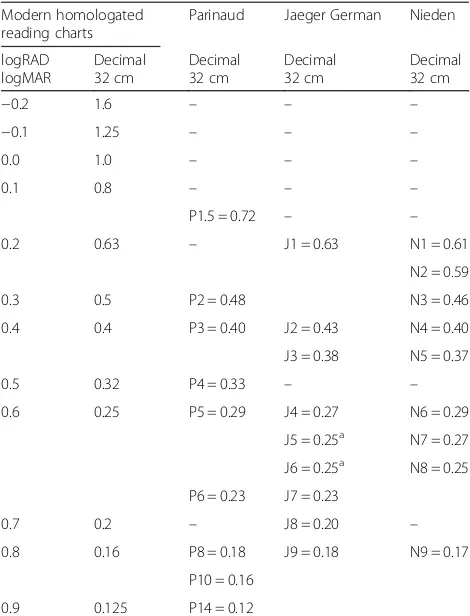
While clear standards for distance acuity measurements and optotypes were established [32] in the second half of the 19th century, a similar standard has not been developed for reading charts. The historic reading charts that are still used, such as the Jaeger [33], Nieden [34], and Parinaud Charts, suffer from a considerable lack of standardization (Table 1). Their print sizes (letter heights) are not standardized and do not logarithmically progress because of the limitations of earlier printing techniques. Whereas today it is possible to print letter heights with an accuracy of approximately 0.01–0.03 mm [28, 29], the historic charts have often been printed only with the limited print sizes available for hot-lead typesetting. This limitation could be the explanation for the many different versions of the English Jaeger charts [35], which are hardly compar-able with each other and are not at all comparcompar-able to the versions in German or other languages.
The Jaeger charts were originally developed by the Viennese Professor Eduard Jaeger (1818–1884) in 1854 [33]. However, even the original versions do not repre-sent a comparable international standard because the German version was printed with Gothic letters, while an Antiqua font type was used for the English version. In the current version of the German Jaeger charts, there are a number of nonconformities with modern require-ments for visual acuity tests (Table 1), including the fact that paragraphs J5 and J6 have the same print size (1.95 mm in height) but different font types. J1 is just comparable to a decimal acuity of 0.63 (Snellen: 20/32) at 32 cm, and J2 corresponds to a visual acuity of 0.43 (Snellen: 20/47) instead of 0.5 (Snellen: 20/40). Between J3 and J4, the print sizes differ by almost 2 log units.
Because historic reading charts like the Jaeger, Parinaud, and Nieden Charts lack useful standards, it seems evi-dent that the evaluation of reading performance using these charts has never been applicable for research purposes. Therefore, historic reading charts should be considered obsolete for the purposes of research and medical documentation.
Modern logarithmic reading charts
All of these modern reading charts use a logarithmic progression of print sizes and are homologated in accord-ance with the standards established by the International Council of Ophthalmology [24] and EN-ISO 8596 [31].
The RADNER Reading Charts
(d) reading length, and to keep the geometric proportions between the test items as constant as possible [28, 29].
The concept of sentence optotypesThe standardization of test items by statistical selection has been introduced for reading charts because the statistical definition of test items is a necessity for a medical test used in patient care [28, 29]. The sentences optotypes of the RADNER Reading Charts are highly comparable in terms of the number of words (14 words), word length, number of syllables, number of characters, position of words, lexical difficulty, and syntactical complexity. The position of words is defined by specified rules [28, 29]: e.g., the first line (5 words) starts with a word of three letters and one syllable, followed by a noun with two syllables in pos-ition two or three. The second line also starts with a word of three letters and one syllable, which is followed by a noun of 10 letters and 3 syllables. Then the relative clause starts with 3 short one-syllable words, and so on. Such sentence optotypes of 3 lines (main clause/relative clause) incorporate 82–84 characters including spaces (27–29 characters per line) and 22–24 syllables. By introducing a narrow“reading length interval”, the most equivalent sentence optotypes (n= 38) were statistically
selected by testing a group of 198 volunteers with re-spect to reading length and difficulty [27, 28]. The Cronbach’s alpha and the corrected item total correlation were well above statistically required limits [28, 29]. The reading speed correlated well with that obtained for long paragraphs, indicating a good validity of these test items.
Standardization of the reading charts For standardizing the RADNER Reading Charts, a methodical design for reading chart standardization including Bland-Altman analyses was established in 2004 to investigate their test-retest reliability and inter-chart reliability and to evaluate a reading chart through variance component analysis (test-re-test interval: 4 weeks) [30]. The results have demonstrated that these reading charts provide highly reproducible mea-surements of reading acuity and speed in individuals with no, moderate, or increased visual impairment. In addition, they have shown that the reading charts provide reliable, reproducible, and comparable measurements of reading performance for clinical practice and scientific surveys.
The sans serif Helvetica typeface was used for the reading charts. All notations (decimal, Snellen, M-units, and logRAD) are given for 40 cm and 32 cm (in the German version, these are also given for 1 m). Except for logRAD, which is given in all language versions, the nota-tions shown on the charts depend on the tradition of read-ing acuity determinations of the countries in which the particular language is spoken. A logRAD adjustment scale for different reading distances is provided on every chart (range: 4 cm to 50 cm).
The concept of sentence optotypes has been applied to 11 different languages (a total of 1253 volunteers have been tested in order to standardize the sentence optotypes in the 11 languages). The RADNER Reading Charts are commercially available in German, Spanish, English, French, Dutch, Italian, Swedish, Danish, Portuguese, Turk-ish and Hungarian, with further languages in progress.
The Bailey-Lovie Word Reading Charts
In 1980, Bailey and Lovie published the Bailey-Lovie Word Reading Charts that were designed to determine reading acuity and speed in one simultaneous examin-ation with a reading chart [25]; this principle has also been applied to the MNREAD and the RADNER Reading Charts. Bailey and Lovie designed a word-reading chart with a logarithmic size progression and used unrelated words. Following the recommendations of the British Faculty of Ophthalmologists [38, 39], they used the Times Roman typeface. They further decided to use 4-, 7-, and 10-letter words at each size level, based on the observation that in patients with age-related macular de-generation (AMD), the word length can affect the read-ability (some patients prefer longer words, others shorter ones). The words and word order were selected with the
Table 1Reading acuity Equivalents of Modern and Historic Reading Charts
Modern homologated reading charts
Parinaud Jaeger German Nieden
logRAD logMAR
Decimal 32 cm
Decimal 32 cm
Decimal 32 cm
Decimal 32 cm
−0.2 1.6 – – –
−0.1 1.25 – – –
0.0 1.0 – – –
0.1 0.8 – – –
P1.5 = 0.72 – –
0.2 0.63 – J1 = 0.63 N1 = 0.61
N2 = 0.59
0.3 0.5 P2 = 0.48 N3 = 0.46
0.4 0.4 P3 = 0.40 J2 = 0.43 N4 = 0.40
J3 = 0.38 N5 = 0.37
0.5 0.32 P4 = 0.33 – –
0.6 0.25 P5 = 0.29 J4 = 0.27 N6 = 0.29
J5 = 0.25a N7 = 0.27
J6 = 0.25a N8 = 0.25
P6 = 0.23 J7 = 0.23
0.7 0.2 – J8 = 0.20 –
0.8 0.16 P8 = 0.18 J9 = 0.18 N9 = 0.17
P10 = 0.16
0.9 0.125 P14 = 0.12
a
intention of having the first letters of the words evenly dis-tributed over the whole alphabet. The frequency of word use also became a selection criterion, and care was taken to avoid obvious syntactic associations between adjacent words [40]. On the charts, print sizes were labeled in the N-notation (points) and logMAR values given for 25 cm.
The MNREAD Charts
Legge and colleagues [41] were the first to use single sentences for a computer-aided test of reading speed, first called the Minnesota low-vision reading test. Subse-quently, a chart version was developed using short sen-tences over a wide range of print sizes in 1993, called the MNREAD test [19]. This test incorporated the con-cept of “standard-length word” introduced by Carver [42, 43]. The sentences of the MNREAD tests are
characterized by their length, which is defined as 60 characters including spaces and an implied period at the end of a sentence [26]. Based on a study by Carver [42], this length turned out to be convenient for scoring read-ing errors and speed when a “standard-length word” is defined to have 6 characters. In this case, a 60-character sentence consisted of 10 standard-length words. Using standard-length words helps minimize the differences in scoring that occur as a result of the different word lengths found in different sentences [26, 41–43]. The MNREAD Charts are available in several languages and they give the logMAR notation, Snellen notation, and M-units for 40 cm.
performed by Subramanian et al. in 2009 [44] for the two MNREAD Charts. Virgili published the coefficient of repeatability obtained for a group of children with the two Italian MNREAD Charts. The studies showed good repeatability in visually impaired adults and chil-dren [45].
The Colenbrander English Continuous Text Near Vision Cards (Fig. 2)
The Colenbrander English Continuous Text Near Vision Cards (Precision Vision, Woodstock, IL) are also logarith-mically scaled; they are available in 11 languages. For use at 40 cm, they cover decimal acuities from 0.063 to 1.25 and also give the Snellen notation and M-units. A log-MAR notation is not given. To maintain the correct read-ing distance, a 40-cm cord is mounted on the cards, and for use in low vision, they come with a ruler to facilitate use at shorter distances for lower acuity levels. The test sentences have 44 characters including spaces and 9 to 11 words. From decimal acuities from 0.063 to 0.1, one sentence is presented per print size, and for 0.12 and smaller, two sentences are presented. These reading cards are also available as mixed-contrast cards;
high and low contrast (20 % Weber) are presented side-by-side on the same card.
Reading parameters
Standardized logarithmic reading charts give better in-sights into the visual performance of our patients than do conventional or historic charts. In addition to reading acuity, the reading acuity score, maximum reading speed, mean reading speed, and several other reading parameters can be analyzed. An interesting parameter is the “critical print size” (CPS), which is defined either as the smallest print size read with normal reading speed [2, 28–30] or in such a way that all smaller print sizes of the chart are read at a speed below the average reading speed of the largest preceding sentences minus 1.96 times the standard deviation [44]. However, in the vari-ant component analysis performed by Stifter et al. for the CPS [30], the patients investigated accounted for only 31 to 54 % of the entire variance. The higher this percentage, the more likely it is that the test is dependent on the person’s reading ability, as is shown for reading acuity: 85 to 94 %. In comparison to the other variables, the variance component analyses re-vealed that, for the CPS, a considerable proportion of
the variability came from unidentified sources. One explanation for this difference might be that the CPS is not a measurement like reading acuity or speed since it has to be set by the examiner at the smallest print size the patient can read with optimal reading speed. For the statistical definition of the CPS [44], it was also found that the coefficient of repeatability was considerably weaker than that of reading acuity and reading speed.
“Reading speed based upon reading acuity” (Fig. 3) and the “logMAR/logRAD ratio” can also provide use-ful information about functional vision, as can the reading score [10], which was developed to compare the reading speed obtained under different reading conditions.
Stop criteria
A further advantage of the standardized reading charts is that they permit the introduction of a stop criterion, which can be freely chosen with regard to the require-ments of a particular study design. For the RADNER Reading Charts, a stop criterion of 20 s is recommended [28], which represents a reading speed of about 40 wpm, the higher limit of spot-reading; whereas the limit for fluent, sense-capturing reading is 80 wpm. A speed of 80 wpm seems to be too short for a stop criterion, since it represents a reading time of just about 7 s per sentence for the MNREAD Charts and 10 s per sentence for the RADNER Reading Charts. In normal-sighted persons, these speeds per sentence represent the reading speed at a print size that is close to the CPS; with this limit, the patient’s full visual potential (i.e., best reading acuity) cannot be shown. However, the best possible reading acuity is an important result, as is the best distance acu-ity. It is also a valuable indicator of a comfortable
reading performance. Reading acuity should therefore be determined in detail, in accordance with the procedures used for single-optotype distance acuity [24, 31].
LogRAD, a modern reading acuity measure
Since from a psychophysical point of view reading acuity involves a different visual task than single-optotype dis-tance acuity, the author of this article suggests the use of different definitions for different tasks and has introduced the term “logRAD” (log-Reading Acuity Determination) for reading acuity measures, which is the reading equiva-lent of logMAR [28, 29].
This concept was found to be convenient because it avoids the confusion between distance and reading acuity that occurs when logMAR is used for both distance and reading acuity. In addition, this differentiation of distance and reading acuity follows the principle that different defi-nitions should be used for different functional properties, as is the case for physics terms used in everyday life (e.g., Hz, Watt, kg, kp, meter, seconds).
Several notations are in use for measuring reading acuity: the (a) decimal notation, (b) Snellen notation, (c) M-notation, (d) N notation, (e) logRAD notation and (f ) logMAR notation. Except for the N-notation, all of these notations are based on the same defin-ition of the visual angle that was introduced by Snel-len in 1862 [36], and all of them are calculated based on the mathematical relation between the vis-ual angle and the testing distance. Furthermore, all of these notations are related to the “minimal angle of resolution” of the eye. Reading acuity, however, is a visual task that is different from that of single-optotype distance recognition, and the definitions of the print sizes are based on the size of lower-case letters. Therefore, it seems to be useful to use differ-ent terms for distance acuity (logMAR) and reading acuity (logRAD).
Clinical aspects of homologated reading charts
The first study in which the reading performance with multifocal IOLs was investigated with a standardized reading chart was performed with the RADNER Reading Charts [2]. Since then, a number of studies have been performed with these standardized logarithmic reading charts and have shown that it is possible to obtain detailed information about the reading performance achieved with bi-, multi-focal, and accommodative IOLs [2–5, 9–11, 16, 17, 22], corneal inlays, [7], monofocal IOLs [18, 23], and following LASIK/LASEK [15] or refractive laser treatment for presbyopia [18–20]. Interesting in-sights into the reading performance of cataract patients have also been obtained with the Bailey-Lovie Word Reading Charts [14] and with the MNREAD Charts as e.g. for two accommodating IOLs [16] and for reading Fig. 3Mean reading speed, based on reading acuity and mean
performance of diffractive MIOLs obtained from pa-tients of working age [22].
In addition, the RADNER Reading Charts have also been used to investigate the reading performance of pa-tients suffering from many diseases, including AMD [46–48], amblyopia [49, 50], infantile nystagmus [51], uveitis [52], and telangiectasia type 2 [53], as well as that of patients who have undergone various surgical treat-ments [54–59].
Many clinical research studies have used standardized and homologated reading chart systems, indicating that they have become a useful tool for investigating reading performance. Such results not only allow the compari-son of different conditions within a particular study, but they also allow the comparison of the results of studies and clinical results. Also, readers of the articles have a clear idea of the print sizes behind homologated reading acuity measures.
Conclusions
Bailey and Lovie-Kitchin concluded that “reading of words or sentences is clearly a more complex function than is reading the widely spaced letters of a distance acuity chart” [25]. They further summarized that, as “compared to isolated letters, the individual letters within words are more difficult to recognize because of interactions with closely packed neighboring letters” [60, 61]; the more important element in reading was found by Bouma to be the recognition of letter and word sequences [62–64].
It therefore is not surprising that routine single-optotype distance visual acuity tests have been shown to be poor predictors of reading performance and, thus, cannot elucidate the full functional impairment of sev-eral ophthalmic diseases [65, 66].
In presbyopia research, modern standardized reading charts allowed the investigation of reading performance in a standardized manner. In particular, reading speed evalu-ation based upon reading acuity, the critical print size, and the mean and maximum reading speeds has provided in-teresting insights into the near-visual performance of pres-byopic patients prior to and following therapy. Clinical studies have investigated the reading performance of pa-tients with various models of multifocal and accommodat-ing IOLs [2–5, 9–11, 16, 17, 22], corneal inlays [7], or following laser refractive surgery [19–21]. Also, the reading performance of cataract patients has been analyzed in de-tail [17, 67, 23], and reading tests have been shown to be useful for estimating potential acuity [14, 68]. Another study has investigated the reading performance of cataract patients who had received a monofocal IOL, with or with-out glasses, under bright and dim light conditions [23].
In summary, it is quite evident that homologated, stan-dardized reading charts such as the Bailey Lovie Reading
Word Reading Charts [25], the Colenbrander Cards, the MNREAD Charts [26, 27], and the RADNER Reading Charts [28–30] facilitate not only research concerning functional vision in many fields of ophthalmology but also international communication about near-visual per-formance. Homologated reading charts are available in almost all languages and have become a valuable tool for analyzing reading performance.
Acknowledgments
The author would like to thank Prof. Ian Bailey, PhD, Prof. August Colenbrander, PhD, and Prof. Gordon Legge, PhD, for their valuable contribution in writing the paragraphs explaining their reading charts.
Funding No funding.
Availability of data and materials Not applicable.
Authors’information
The author is President of the Austrian Academy of Ophthalmology and Optometry.
Competing interests
The author receives royalties for the RADNER Reading Charts and is a consultant for the Oculus GmbH.
Consent for publication
The author gives consent for publication.
Ethics approval and consent to participate Not applicable.
Received: 25 August 2016 Accepted: 27 October 2016
References
1. Sivardeen A, Laughton D, Wolffsohn JS. Investigating the utility of clinical assessments to predict success with presbyopic contact lens correction. Cont Lens Anterior Eye. 2016;39(5):322–30.
2. Richter-Mueksch S, Weghaupt H, Skorpik C, Velikay-Parel M, Radner W. Reading performance with a refractive multifocal and a diffractive bifocal intraocular lens. J Cataract Refract Surg. 2002;28:1957–63.
3. Agresta B, Knorz MC, Kohnen T, Donatti C, Jackson D. Distance and near visual acuity improvement after implantation of multifocal intraocular lenses in cataract patients with presbyopia: a systematic review. J Refract Surg. 2012;28:426–35.
4. Hütz WW, Eckhardt HB, Röhrig B, Grolmus R. Reading ability with 3 multifocal intraocular lens models. J Cataract Refract Surg. 2006;32:2015–21. 5. Hütz WW, Eckhardt HB, Röhrig B, Grolmus R. Intermediate vision and
reading speed with array, Tecnis, and ReSTOR intraocular lenses. J Refract Surg. 2008;24:251–6.
6. Greenbaum S. Monovision pseudophakia. J Cataract Refract Surg. 2002;28:1439–43.
7. Dexl AK, Seyeddain O, Riha W, Hohensinn M, Rückl T, Hitzl W, et al. Reading performance after implantation of a modified corneal inlay design for the surgical correction of presbyopia: 1-year follow-up. Am J Ophthalmol. 2012;153(5):994–1001. e2.
8. Menapace R, Findl O, Kriechbaum K, Leydolt-Koeppl Ch. Accommodating intraocular lenses: a critical review of present and future concepts. Graefes Arch Clin Exp Ophthalmol. 2007;245:473–89.
9. Pallikaris IG, Kontadakis GA, Portaliou DM. Real and pseudoaccommodation in accommodative lenses. J Ophthalmol. 2011;2011:284961.
11. Alio JL, Simonov A, Plaza-Puche AB, Angelov A, Angelov Y, van Lawick W, et al. Visual outcomes and accommodative response of the Lumina accommodative intraocular lens. Am J Ophthalmol. 2016;164:37–48. 12. Renna A, Vejarano LF, De la Cruz E, Alió JL. Pharmacological treatment of
presbyopia by novel binocularly instilled eye drops: a pilot study. Ophthalmol Ther. 2016;5(1):63–73.
13. Brussee T, van Nispen RM, van Rens GH. Measurement properties of continuous text reading performance tests. Ophthalmic Physiol Opt. 2014;34(6):636–57.
14. Elliott D, Patel B, Whitaker D. Development of a reading speed test for potential-vision measurements. Invest Ophthalmol Vis Sci. 2001;42:1945–9. 15. Richter-Mueksch S, Kaminski S, Kuchar A, Stifter E, Velikay-Parel M, Radner W.
Influence of laser in situ keratomileusis and laser epithelial keratectomy on patients’reading performance. J Cataract Refract Surg. 2005;31:1544–8. 16. Brown D, Dougherty P, Gills JP, Hunkeler J, Sanders DR, Sanders ML.
Functional reading acuity and performance: comparison of 2
accommodating intraocular lenses. J Cataract Refract Surg. 2009;35:1711–4. 17. Alió JL, Plaza-Puche A, Piñero DP, Amparo F, Jiménez R, Rodríguez-Prats JL, et al. Optical analysis, reading performance, and quality-of-life evaluation after implantation of a diffractive multifocal intraocular lens. J Cataract Refract Surg. 2011;37:27–37.
18. Lehmann RP, Houtman DM. Visual performance in cataract patients with low levels of postoperative astigmatism: full correction versus spherical equivalent correction. Clin Ophthalmol. 2012;6:333–8.
19. Uthoff D, Pölzl M, Hepper D, Holland D. A new method of cornea modulation with excimer laser for simultaneous correction of presbyopia and ametropia. Graefes Arch Clin Exp Ophthalmol. 2012;250:1649–61. 20. Luger MH, Ewering T, Arba-Mosquera S. One-year experience in presbyopia
correction with biaspheric multifocal central presbyopia laser in situ keratomileusis. Cornea. 2013;32:644–52.
21. Baudu P, Penin F, Arba Mosquera S. Uncorrected binocular performance after biaspheric ablation profile for presbyopic corneal treatment using AMARIS with the PresbyMAX module. Am J Ophthalmol. 2013;155:636–47. 22. Cillino G, Casuccio A, Pasti M, Bono V, Mencucci R, Cillino S. Working-age
cataract patients: visual results, reading performance, and quality of life with three diffractive multifocal intraocular lenses. Ophthalmology. 2014;121(1):34–44.
23. Radner W, Radner S, Raunig V, Diendorfer G. Reading performance of monofocal pseudophakic patients with and without glasses under normal and dim light condition. J Cataract Refract Surg. 2014;40:369–75. 24. Colenbrander A. Consilium Ophthalmologicum Universale Visual Functions
committee, visual acuity measurement standard. Ital J Ophthalmol. 1988;11:5–19. 25. Bailey IL, Lovie JE. The design and use of a new near-vision chart. Am J
Optom Physiol Opt. 1980;57(6):378–87.
26. Mansfield J, Ahn SJ, Legge GE, Luebker A. A new reading-acuity chart for normal and low vision. Ophthalmic and Visual Optics/Noninvasive Assessment of the Visual System Technical Digest. 1993;3:232–5. 27. Ahn SJ, Legge GE, Luebker A. Printed cards for measuring low-vision
reading speed. Vision Res. 1995;35:1939–44.
28. Radner W, Willinger U, Obermayer W, Mudrich C, Velikay-Parel M, Eisenwort B. A new reading chart for simultaneous determination of reading vision and reading speed. Klin Monbl Augenheilkd. 1998;213:174–81. 29. Radner W, Obermayer W, Richter-Mueksch S, Willinger U, Velikay-Parel M,
Eisenwort B. The validity and reliability of short German sentences for measuring reading speed. Graefes Arch Clin Exp Ophthalmol. 2002;240:461–7. 30. Stifter E, König F, Lang T, Bauer P, Richter-Müksch S, Velikay-Parel M, Radner
W. Reliability of a standardized reading chart system: variance component analysis, test-retest and inter-chart reliability. Graefes Arch Clin Exp Ophthalmol. 2004;242:31–9.
31. CEN European Committee of Norms. Europäische Norm Sehschärfenprüfung EN ISO 8596. Beuth-Publisher: Berlin; 1996. 32. Graefe A, Saemisch T. Handbuch der gesamten Augenheilkunde. Leipzig:
Engelmann Publisher; 1874. Bd 3, Part 1.
33. Jaeger E. Über Staar und Staaroperationen nebst anderer Beobachtungen und Erfahrungen. Wien: Seidel und Sohn; 1854.
34. Nieden A. Schrift-Proben zur Bestimmung der Sehschärfe. Wiesbaden: J.F. Bergman Publisher; 1882.
35. Colenbrander A, Runge P. Can Jaeger numbers be standardized? Invest Ophthalmol Vis Sci. 2007;48:Abstract 3563.
36. Snellen H. In: Snellen H, editor. Optotypi ad visum determinandum. Utrecht: P.W. van der Weijer; 1862.
37. Green J. On a new series of test-letters for determining the acuteness of vision. Trans Am Ophthalmol Soc. 1868;1(4-5):68–71.
38. Law FW. Standardization of reading types. Br J Ophthalmol. 1951;35:765–73. 39. Law FW. Reading types. Br J Ophthalmol. 1952;36:689–90.
40. Bailey IL, Lovie-Kitchin JE. Visual acuity testing. From the laboratory to the clinic. Vision Res. 2013;90:2–9.
41. Legge GE, Ross JA, Luebker A, LaMay JM. Psychophysics of reading VIII. The Minnesota low-vision reading test. Optom Vis Sci. 1998;66:843–53. 42. Carver R. Word length, prose difficulty, and reading rate. J Lit Res.
1976;8:193–203.
43. Carver R. Reading rate: a review of research and theory. San Diego: Academic Press; 1990.
44. Subramanian A, Pardhan S. Repeatability of reading ability indices in subjects with impaired vision. Invest Ophthalmol Vis Sci. 2009;50:3643–7. 45. Virgili G, Cordaro C, Bigoni A, Crovato S, Cecchini P, Menchini U. Reading acuity in children: evaluation and reliability using MNREAD charts. Invest Ophthalmol Vis Sci. 2004;45:3349–54.
46. Richter-Mueksch S, Stur M, Stifter E, Radner W. Differences in reading performance of patients with drusen maculopathy and subretinal fibrosis after CNV. Graefes Arch Clin Exp Ophthalmol. 2006;244:154–62. 47. Muether PS, Hoerster R, Hermann MM, Kirchhof B, Fauser S. Long-term
effects of ranibizumab treatment delay in neovascular age-related macular degeneration. Graefes Arch Clin Exp Ophthalmol. 2013;251:453–8. 48. Koch KR, Muether PS, Hermann MM, Hoerster R, Kirchhof B, Fauser S.
Subjective perception versus objective outcome after intravitreal ranibizumab for exudative AMD. Graefes Arch Clin Exp Ophthalmol. 2012;250:201–9. 49. Stifter E, Burggasser G, Hirmann E, Thaler A, Radner W. Evaluating reading
acuity and speed in children with microstrabismic amblyopia using a standardized reading chart system. Graefes Arch Clin Exp Ophthalmol. 2005;243:1228–35.
50. de Wit DW, Diaz JM, Moore TC, Moore JE. Refractive lens exchange for a multifocal intraocular lens with a surface-embedded near section in mild to moderate anisometropic amblyopic patients. J Cataract Refract Surg. 2012;38:1796–801.
51. Barot N, McLean RJ, Gottlob I, Proudlock FA. Reading performance in infantile nystagmus. Ophthalmology. 2013;120:1232–8.
52. Kiss CG, Barisani-Asenbauer T, Maca S, Richter-Mueksch S, Radner W. Reading performance of patients with uveitis-associated cystoid macular edema. Am J Ophthalmol. 2006;142:620–4.
53. Finger RP, Charbel Issa P, Fimmers R, Holz FG, Rubin GS, Scholl HP. Reading performance is reduced by parafoveal scotomas in patients with macular telangiectasia type 2. Invest Ophthalmol Vis Sci. 2009;50:1366–70. 54. Caramoy A, Fauser S, Kirchhof B. Retinal stimuli can be restored after
autologous transplant of retinal pigment epithelium and choroid in pigment epithelium tears. Acta Ophthalmol. 2011;89(6):e490–5. 55. Joussen AM, Joeres S, Fawzy N, Heussen FM, Llacer H, van Meurs JC, et al.
Autologous translocation of the choroid and retinal pigment epithelium in patients with geographic atrophy. Ophthalmology.
2007;114:551–60.
56. Richter-Mueksch S, Sacu S, Osarovsky-Sasin E, Stifter E, Kiss C, Velikay-Parel M. Visual performance 3 years after successful macular hole surgery. Br J Ophthalmol. 2009;93:660–3.
57. Joeres S, Heussen FM, Treziak T, Bopp S, Joussen AM. Bevacizumab (Avastin) treatment in patients with retinal angiomatous proliferation. Graefes Arch Clin Exp Ophthalmol. 2007;245:1597–602.
58. Krepler K, Wagner J, Sacu S, Wedrich A. The effect of intravitreal triamcinolone on diabetic macular oedema. Graefes Arch Clin Exp Ophthalmol. 2005;243:478–81.
59. Munk MR, Kiss C, Huf W, Sulzbacher F, Roberts P, Mittermüller TJ, et al. One year follow-up of functional recovery in neovascular AMD during monthly anti-VEGF treatment. Am J Ophthalmol. 2013;156:633–43.
60. Flom MC, Weymouth FW, Kahneman D. Visual resolution and contour interactions. J Opt Soc Am. 1963;53:1026–32.
61. Flom MC, Heath GG, Takahashi E. Contour interactions and visual resolution: contralateral effects. Science. 1963;142:979–80.
62. Bouma H. Interaction effects in parafoveal letter recognition. Nature. 1970;226:177–8.
63. Bouma H. Visual interference in parafoveal recognition of initial and final letter of words. Vision Res. 1973;13:767–82.
65. Legge GE, Ross JA, Isenberg LM, LaMay JM. Psychophysics of reading. Clinical predictors of low-vision reading speed. Invest Ophthalmol Vis Sci. 1992;33:677–87.
66. McClure ME, Hart PM, Jackson AJ, Stevenson MR, Chakravarthy U. Macular degeneration: do conventional measurements of impaired visual function equate with visual disability? Br J Ophthalmol. 2000;84:244–50. 67. Stifter E, Sacu S, Weghaupt H, König F, Richter-Müksch S, Thaler A, et al.
Reading performance depending on the type of cataract and its predictability on the visual outcome. J Cataract Refract Surg. 2004;30:1259–67.
68. Stifter E, Weghaupt H, Benesch T, Thaler A, Radner W. Discriminative power of reading tests to differentiate visual impairment caused by cataract and age-related macular degeneration. J Cataract Refract Surg. 2005;31:2111–9.
• We accept pre-submission inquiries
• Our selector tool helps you to find the most relevant journal
• We provide round the clock customer support
• Convenient online submission
• Thorough peer review
• Inclusion in PubMed and all major indexing services
• Maximum visibility for your research
Submit your manuscript at www.biomedcentral.com/submit


![requirements [2, 3]. In Germany, mainly paper-based documentation system](data:image/gif;base64,R0lGODlhAQABAIAAAP///wAAACH5BAEAAAAALAAAAAABAAEAAAICRAEAOw==)